Finland Driving Metal Chain Market (2025-2031) | Analysis, Revenue, Value, Segmentation, Trends, Growth, Companies, Industry, Forecast, Outlook, Size & Share
Market Forecast By Type (Stainless Steel Chain, Carbon Steel Chain, Alloy Chain, Copper Chain, Others), By Application (Automobile, Agricultural, Construction, Others) And Competitive Landscape
| Product Code: ETC4924493 | Publication Date: Nov 2023 | Updated Date: Apr 2026 | Product Type: Market Research Report | |
| Publisher: 6Wresearch | Author: Shubham Padhi | No. of Pages: 60 | No. of Figures: 30 | No. of Tables: 5 |
Finland Driving Metal Chain Market Size (2020-2030)
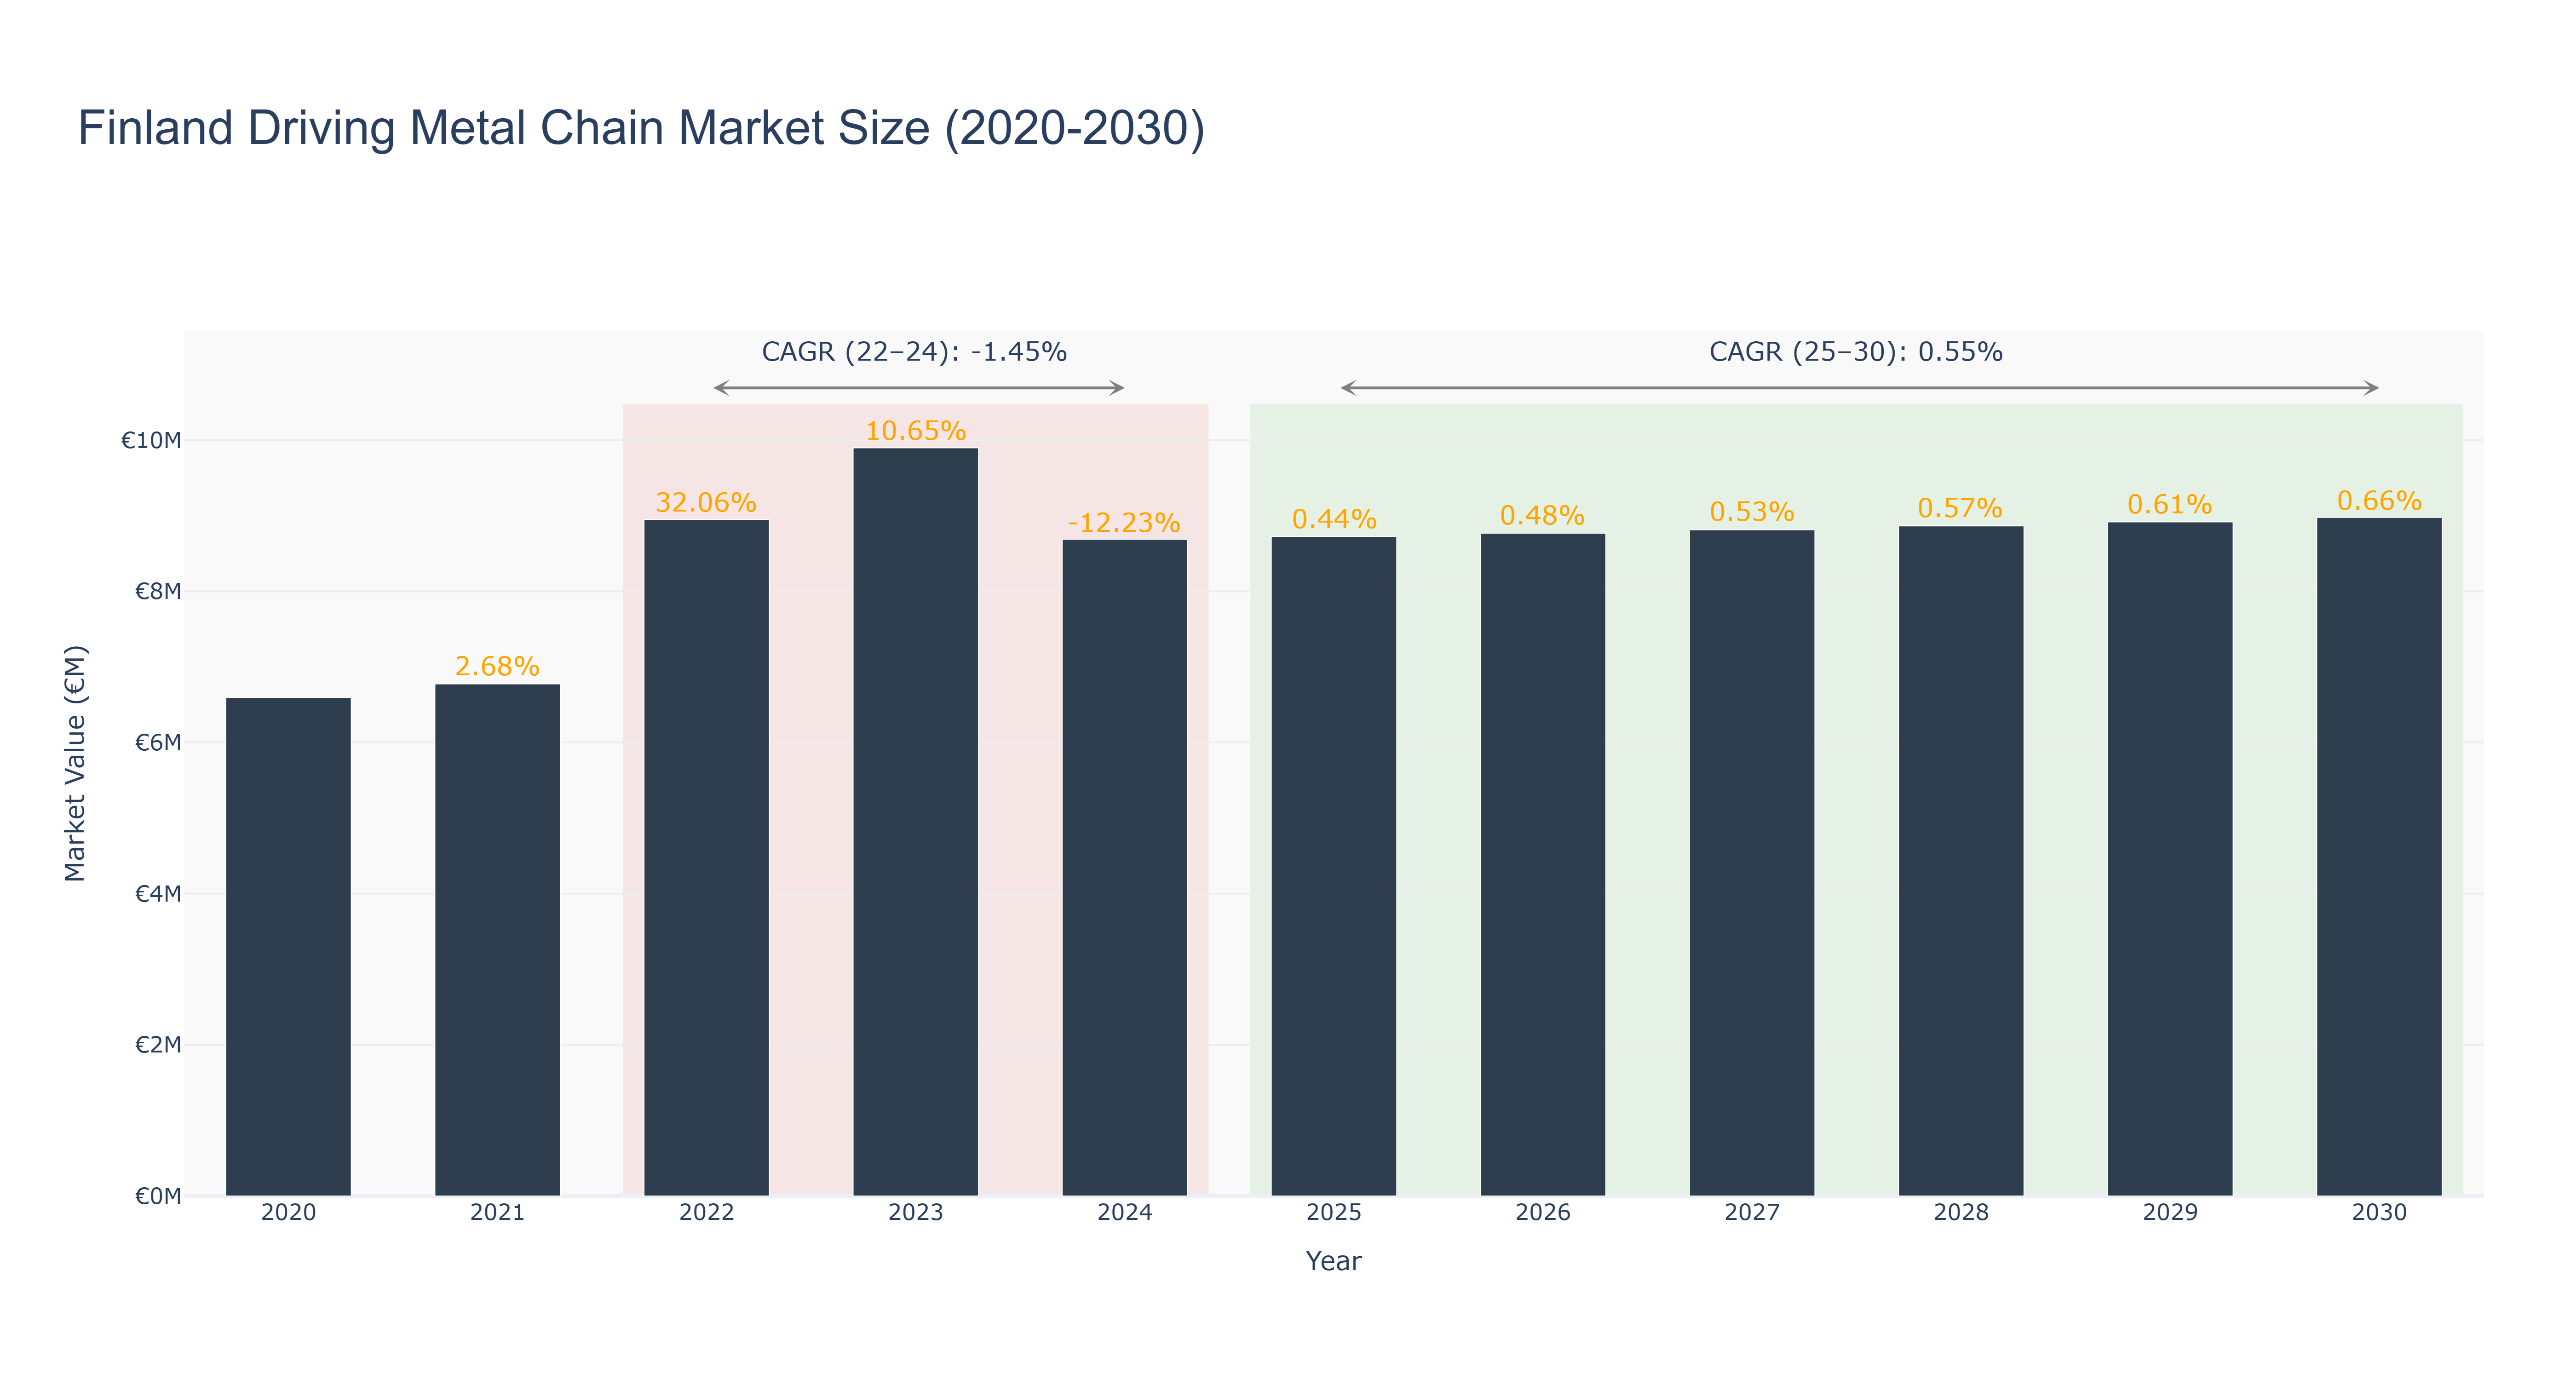
The Finland Driving Metal Chain Market experienced a peak market size of €9.90 million in 2023. From 2020 to 2024, the market size fluctuated, starting at €6.60 million in 2020, peaking in 2023, and then declining to €8.69 million in 2024. The forecasted market size from 2025 to 2030 shows a steady increase, reaching €8.98 million in 2030. The CAGR for the period 2022-24 was -1.45%, reflecting the market's contraction, while the CAGR for 2025-30 is projected to be 0.55%, indicating a modest growth trend. The decline in market size from 2022-24 could be attributed to economic downturns, while the subsequent growth may be driven by technological advancements and increased demand for metal chains in various industries. Recent developments in the Finnish market include investments in sustainable manufacturing processes and the introduction of innovative metal chain designs to cater to evolving consumer needs.
Finland Driving Metal Chain Market: Production & Trade Performance (2019-2025)
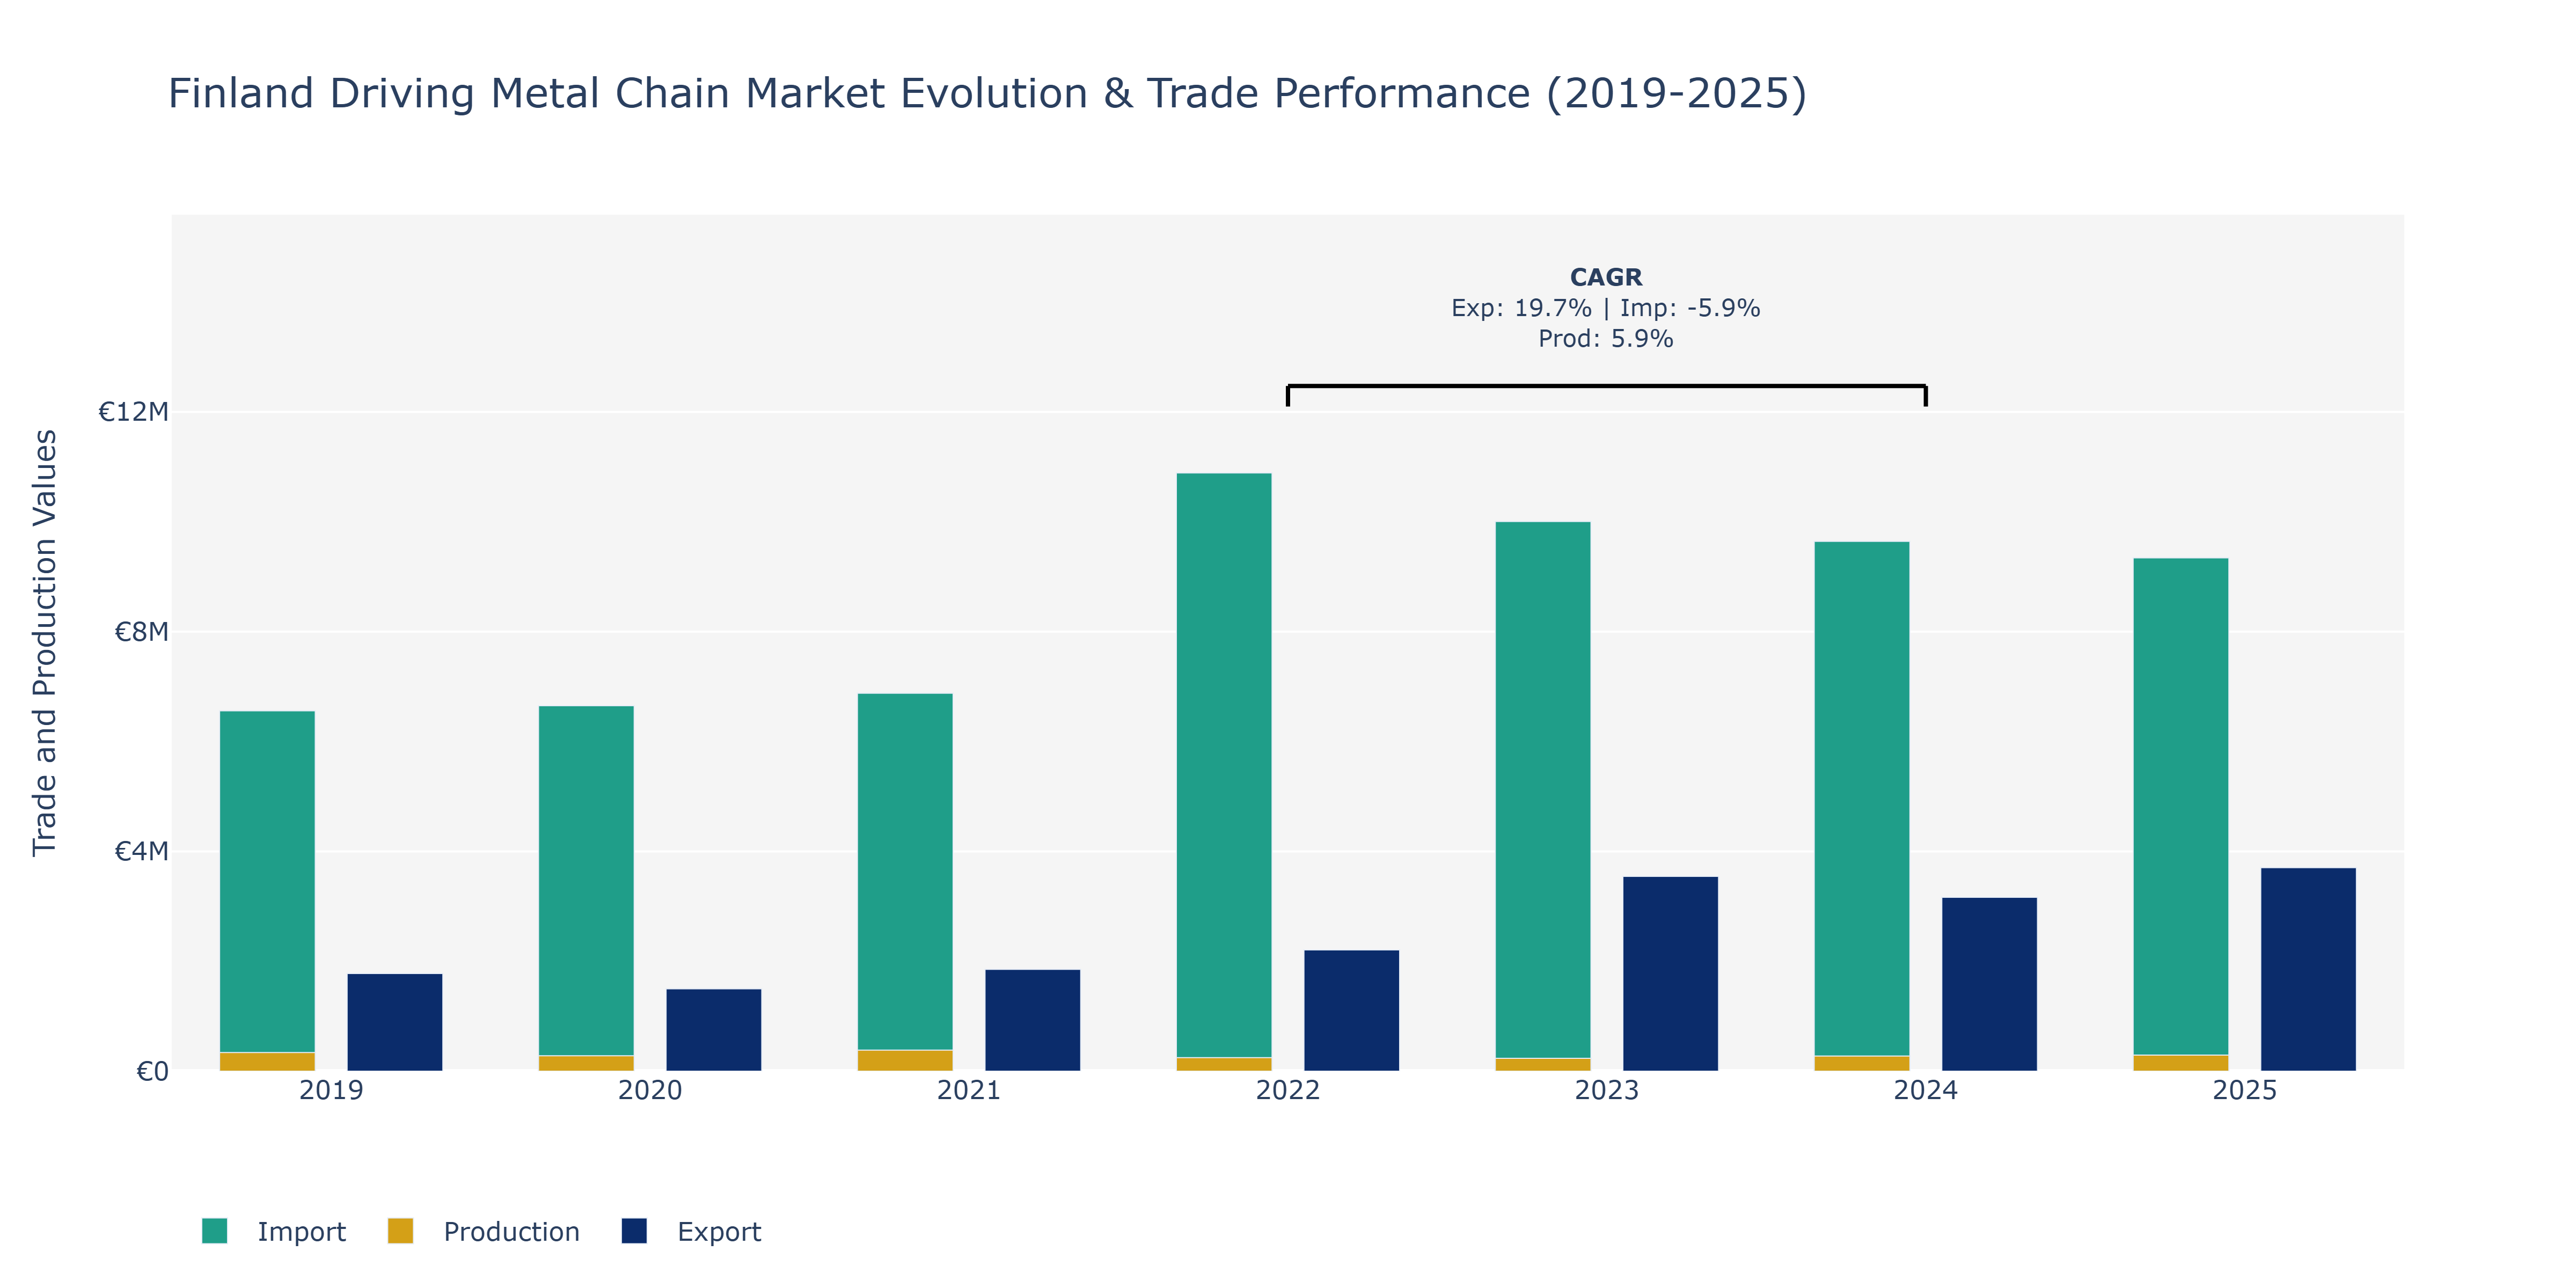
In the Finland Driving Metal Chain Market, exports experienced fluctuations over the years, starting at €1.78 million in 2019, declining to €1.5 million in 2020 before reaching a peak of €3.55 million in 2023 and then stabilizing at €3.7 million in 2025. This growth can be attributed to the market's strategic focus on product innovation and quality improvement, leading to increased international demand. Conversely, imports followed a more erratic pattern, decreasing from €6.56 million in 2019 to €6.65 million in 2020, and then peaking at €10.89 million in 2022 before slightly decreasing to €9.34 million in 2025. The fluctuations in imports could be linked to global economic conditions impacting the demand for raw materials and components. Production volumes showed a steady increase from €340 million in 2019 to €383 million in 2021, before experiencing a slight decrease to €234 million in 2023, and then rising again to €293 million in 2025. This fluctuation in production aligns with market dynamics, where shifts in consumer preferences and technological advancements influence manufacturing output levels.
Key Highlights of the Report:
- Finland Driving Metal Chain Market Outlook
- Market Size of Finland Driving Metal Chain Market, 2024
- Forecast of Finland Driving Metal Chain Market, 2031
- Historical Data and Forecast of Finland Driving Metal Chain Revenues & Volume for the Period 2021-2031
- Finland Driving Metal Chain Market Trend Evolution
- Finland Driving Metal Chain Market Drivers and Challenges
- Finland Driving Metal Chain Price Trends
- Finland Driving Metal Chain Porter`s Five Forces
- Finland Driving Metal Chain Industry Life Cycle
- Historical Data and Forecast of Finland Driving Metal Chain Market Revenues & Volume By Type for the Period 2021-2031
- Historical Data and Forecast of Finland Driving Metal Chain Market Revenues & Volume By Stainless Steel Chain for the Period 2021-2031
- Historical Data and Forecast of Finland Driving Metal Chain Market Revenues & Volume By Carbon Steel Chain for the Period 2021-2031
- Historical Data and Forecast of Finland Driving Metal Chain Market Revenues & Volume By Alloy Chain for the Period 2021-2031
- Historical Data and Forecast of Finland Driving Metal Chain Market Revenues & Volume By Copper Chain for the Period 2021-2031
- Historical Data and Forecast of Finland Driving Metal Chain Market Revenues & Volume By Others for the Period 2021-2031
- Historical Data and Forecast of Finland Driving Metal Chain Market Revenues & Volume By Application for the Period 2021-2031
- Historical Data and Forecast of Finland Driving Metal Chain Market Revenues & Volume By Automobile for the Period 2021-2031
- Historical Data and Forecast of Finland Driving Metal Chain Market Revenues & Volume By Agricultural for the Period 2021-2031
- Historical Data and Forecast of Finland Driving Metal Chain Market Revenues & Volume By Construction for the Period 2021-2031
- Historical Data and Forecast of Finland Driving Metal Chain Market Revenues & Volume By Others for the Period 2021-2031
- Finland Driving Metal Chain Import Export Trade Statistics
- Market Opportunity Assessment By Type
- Market Opportunity Assessment By Application
- Finland Driving Metal Chain Top Companies Market Share
- Finland Driving Metal Chain Competitive Benchmarking By Technical and Operational Parameters
- Finland Driving Metal Chain Company Profiles
- Finland Driving Metal Chain Key Strategic Recommendations
Frequently Asked Questions About the Market Study (FAQs):
6Wresearch actively monitors the Finland Driving Metal Chain Market and publishes its comprehensive annual report, highlighting emerging trends, growth drivers, revenue analysis, and forecast outlook. Our insights help businesses to make data-backed strategic decisions with ongoing market dynamics. Our analysts track relevent industries related to the Finland Driving Metal Chain Market, allowing our clients with actionable intelligence and reliable forecasts tailored to emerging regional needs.
Yes, we provide customisation as per your requirements. To learn more, feel free to contact us on sales@6wresearch.com
1 Executive Summary |
2 Introduction |
2.1 Key Highlights of the Report |
2.2 Report Description |
2.3 Market Scope & Segmentation |
2.4 Research Methodology |
2.5 Assumptions |
3 Finland Driving Metal Chain Market Overview |
3.1 Finland Country Macro Economic Indicators |
3.2 Finland Driving Metal Chain Market Revenues & Volume, 2021 & 2031F |
3.3 Finland Driving Metal Chain Market - Industry Life Cycle |
3.4 Finland Driving Metal Chain Market - Porter's Five Forces |
3.5 Finland Driving Metal Chain Market Revenues & Volume Share, By Type, 2021 & 2031F |
3.6 Finland Driving Metal Chain Market Revenues & Volume Share, By Application, 2021 & 2031F |
4 Finland Driving Metal Chain Market Dynamics |
4.1 Impact Analysis |
4.2 Market Drivers |
4.2.1 Increasing demand for high-quality and durable metal chains in the automotive and industrial sectors |
4.2.2 Growth in the construction industry leading to higher demand for metal chains for lifting and securing purposes |
4.2.3 Technological advancements in the manufacturing process of metal chains, resulting in improved strength and performance |
4.3 Market Restraints |
4.3.1 Fluctuations in raw material prices impacting the production cost of metal chains |
4.3.2 Competition from alternative materials such as synthetic ropes and cables affecting the market share of metal chains |
4.3.3 Stringent regulations related to environmental sustainability and worker safety increasing compliance costs for metal chain manufacturers |
5 Finland Driving Metal Chain Market Trends |
6 Finland Driving Metal Chain Market Segmentations |
6.1 Finland Driving Metal Chain Market, By Type |
6.1.1 Overview and Analysis |
6.1.2 Finland Driving Metal Chain Market Revenues & Volume, By Stainless Steel Chain, 2021-2031F |
6.1.3 Finland Driving Metal Chain Market Revenues & Volume, By Carbon Steel Chain, 2021-2031F |
6.1.4 Finland Driving Metal Chain Market Revenues & Volume, By Alloy Chain, 2021-2031F |
6.1.5 Finland Driving Metal Chain Market Revenues & Volume, By Copper Chain, 2021-2031F |
6.1.6 Finland Driving Metal Chain Market Revenues & Volume, By Others, 2021-2031F |
6.2 Finland Driving Metal Chain Market, By Application |
6.2.1 Overview and Analysis |
6.2.2 Finland Driving Metal Chain Market Revenues & Volume, By Automobile, 2021-2031F |
6.2.3 Finland Driving Metal Chain Market Revenues & Volume, By Agricultural, 2021-2031F |
6.2.4 Finland Driving Metal Chain Market Revenues & Volume, By Construction, 2021-2031F |
6.2.5 Finland Driving Metal Chain Market Revenues & Volume, By Others, 2021-2031F |
7 Finland Driving Metal Chain Market Import-Export Trade Statistics |
7.1 Finland Driving Metal Chain Market Export to Major Countries |
7.2 Finland Driving Metal Chain Market Imports from Major Countries |
8 Finland Driving Metal Chain Market Key Performance Indicators |
8.1 Average order value per customer in the metal chain market |
8.2 Percentage of repeat customers indicating customer satisfaction and loyalty |
8.3 Number of new product innovations and patents reflecting the level of technological advancement in the metal chain industry |
9 Finland Driving Metal Chain Market - Opportunity Assessment |
9.1 Finland Driving Metal Chain Market Opportunity Assessment, By Type, 2021 & 2031F |
9.2 Finland Driving Metal Chain Market Opportunity Assessment, By Application, 2021 & 2031F |
10 Finland Driving Metal Chain Market - Competitive Landscape |
10.1 Finland Driving Metal Chain Market Revenue Share, By Companies, 2024 |
10.2 Finland Driving Metal Chain Market Competitive Benchmarking, By Operating and Technical Parameters |
11 Company Profiles |
12 Recommendations | 13 Disclaimer |
Global Go To Market Strategy - 2030
Export potential enables firms to identify high-growth global markets with greater confidence by combining advanced trade intelligence with a structured quantitative methodology. The framework analyzes emerging demand trends and country-level import patterns while integrating macroeconomic and trade datasets such as GDP and population forecasts, bilateral import–export flows, tariff structures, elasticity differentials between developed and developing economies, geographic distance, and import demand projections. Using weighted trade values from 2020–2024 as the base period to project country-to-country export potential for 2030, these inputs are operationalized through calculated drivers such as gravity model parameters, tariff impact factors, and projected GDP per-capita growth. Through an analysis of hidden potentials, demand hotspots, and market conditions that are most favorable to success, this method enables firms to focus on target countries, maximize returns, and global expansion with data, backed by accuracy.
By factoring in the projected importer demand gap that is currently unmet and could be potential opportunity, it identifies the potential for the Exporter (Country) among 190 countries, against the general trade analysis, which identifies the biggest importer or exporter.
To discover high-growth global markets and optimize your business strategy:
Click Here
Pricing
- Single User License$ 1,995
- Department License$ 2,400
- Site License$ 3,120
- Global License$ 3,795

Leadership Perspectives from Industry Events
Search
Thought Leadership and Analyst Meet


Our Clients
6WResearch In News
- India Air Conditioner Market Set for Strong Rebound in 2026 After Weather-Led Correction and GST-Driven Recovery: 6Wresearch
- ADAS in India: How Automatic Emergency Braking, Blind Spot Detection & Driver Monitoring are Transforming Road Safety
- Doha a strategic location for EV manufacturing hub: IPA Qatar
- Demand for luxury TVs surging in the GCC, says Samsung
- Empowering Growth: The Thriving Journey of Bangladesh’s Cable Industry
- Demand for luxury TVs surging in the GCC, says Samsung
Latest Reports
- Nicaragua RPG Gaming Market (2026-2032)
- New Zealand RPG Gaming Market (2026-2032)
- Netherlands RPG Gaming Market (2026-2032)
- Nauru RPG Gaming Market (2026-2032)
- Namibia RPG Gaming Market (2026-2032)
- Mozambique RPG Gaming Market (2026-2032)
- Montenegro RPG Gaming Market (2026-2032)
- Mongolia RPG Gaming Market (2026-2032)
- Monaco RPG Gaming Market (2026-2032)
- Micronesia RPG Gaming Market (2026-2032)
Industry Events and Analyst Meet

EV India Expo 2026

HIMTEX 2026

India Refining Summit 2026

India EV Show 2026

EV tech India Expo 2026
Whitepaper
- Middle East & Africa Commercial Security Market Click here to view more.
- Middle East & Africa Fire Safety Systems & Equipment Market Click here to view more.
- GCC Drone Market Click here to view more.
- Middle East Lighting Fixture Market Click here to view more.
- GCC Physical & Perimeter Security Market Click here to view more.