Finland LNG Bunkering Market (2025-2031) | Companies, Forecast, Analysis, Size, Value, Trends, Share, Revenue, Outlook, Segmentation, Growth & Industry
Market Forecast By Product Type (Truck-to-Ship, Port-to-Ship, Ship-to-Ship, Portable Tanks), By Application (Container Fleet, Tanker Fleet, Cargo Fleet, Ferries, Inland Vessels, Others) And Competitive Landscape
| Product Code: ETC4823812 | Publication Date: Nov 2023 | Updated Date: Nov 2025 | Product Type: Market Research Report | |
| Publisher: 6Wresearch | Author: Sachin Kumar Rai | No. of Pages: 60 | No. of Figures: 30 | No. of Tables: 5 |
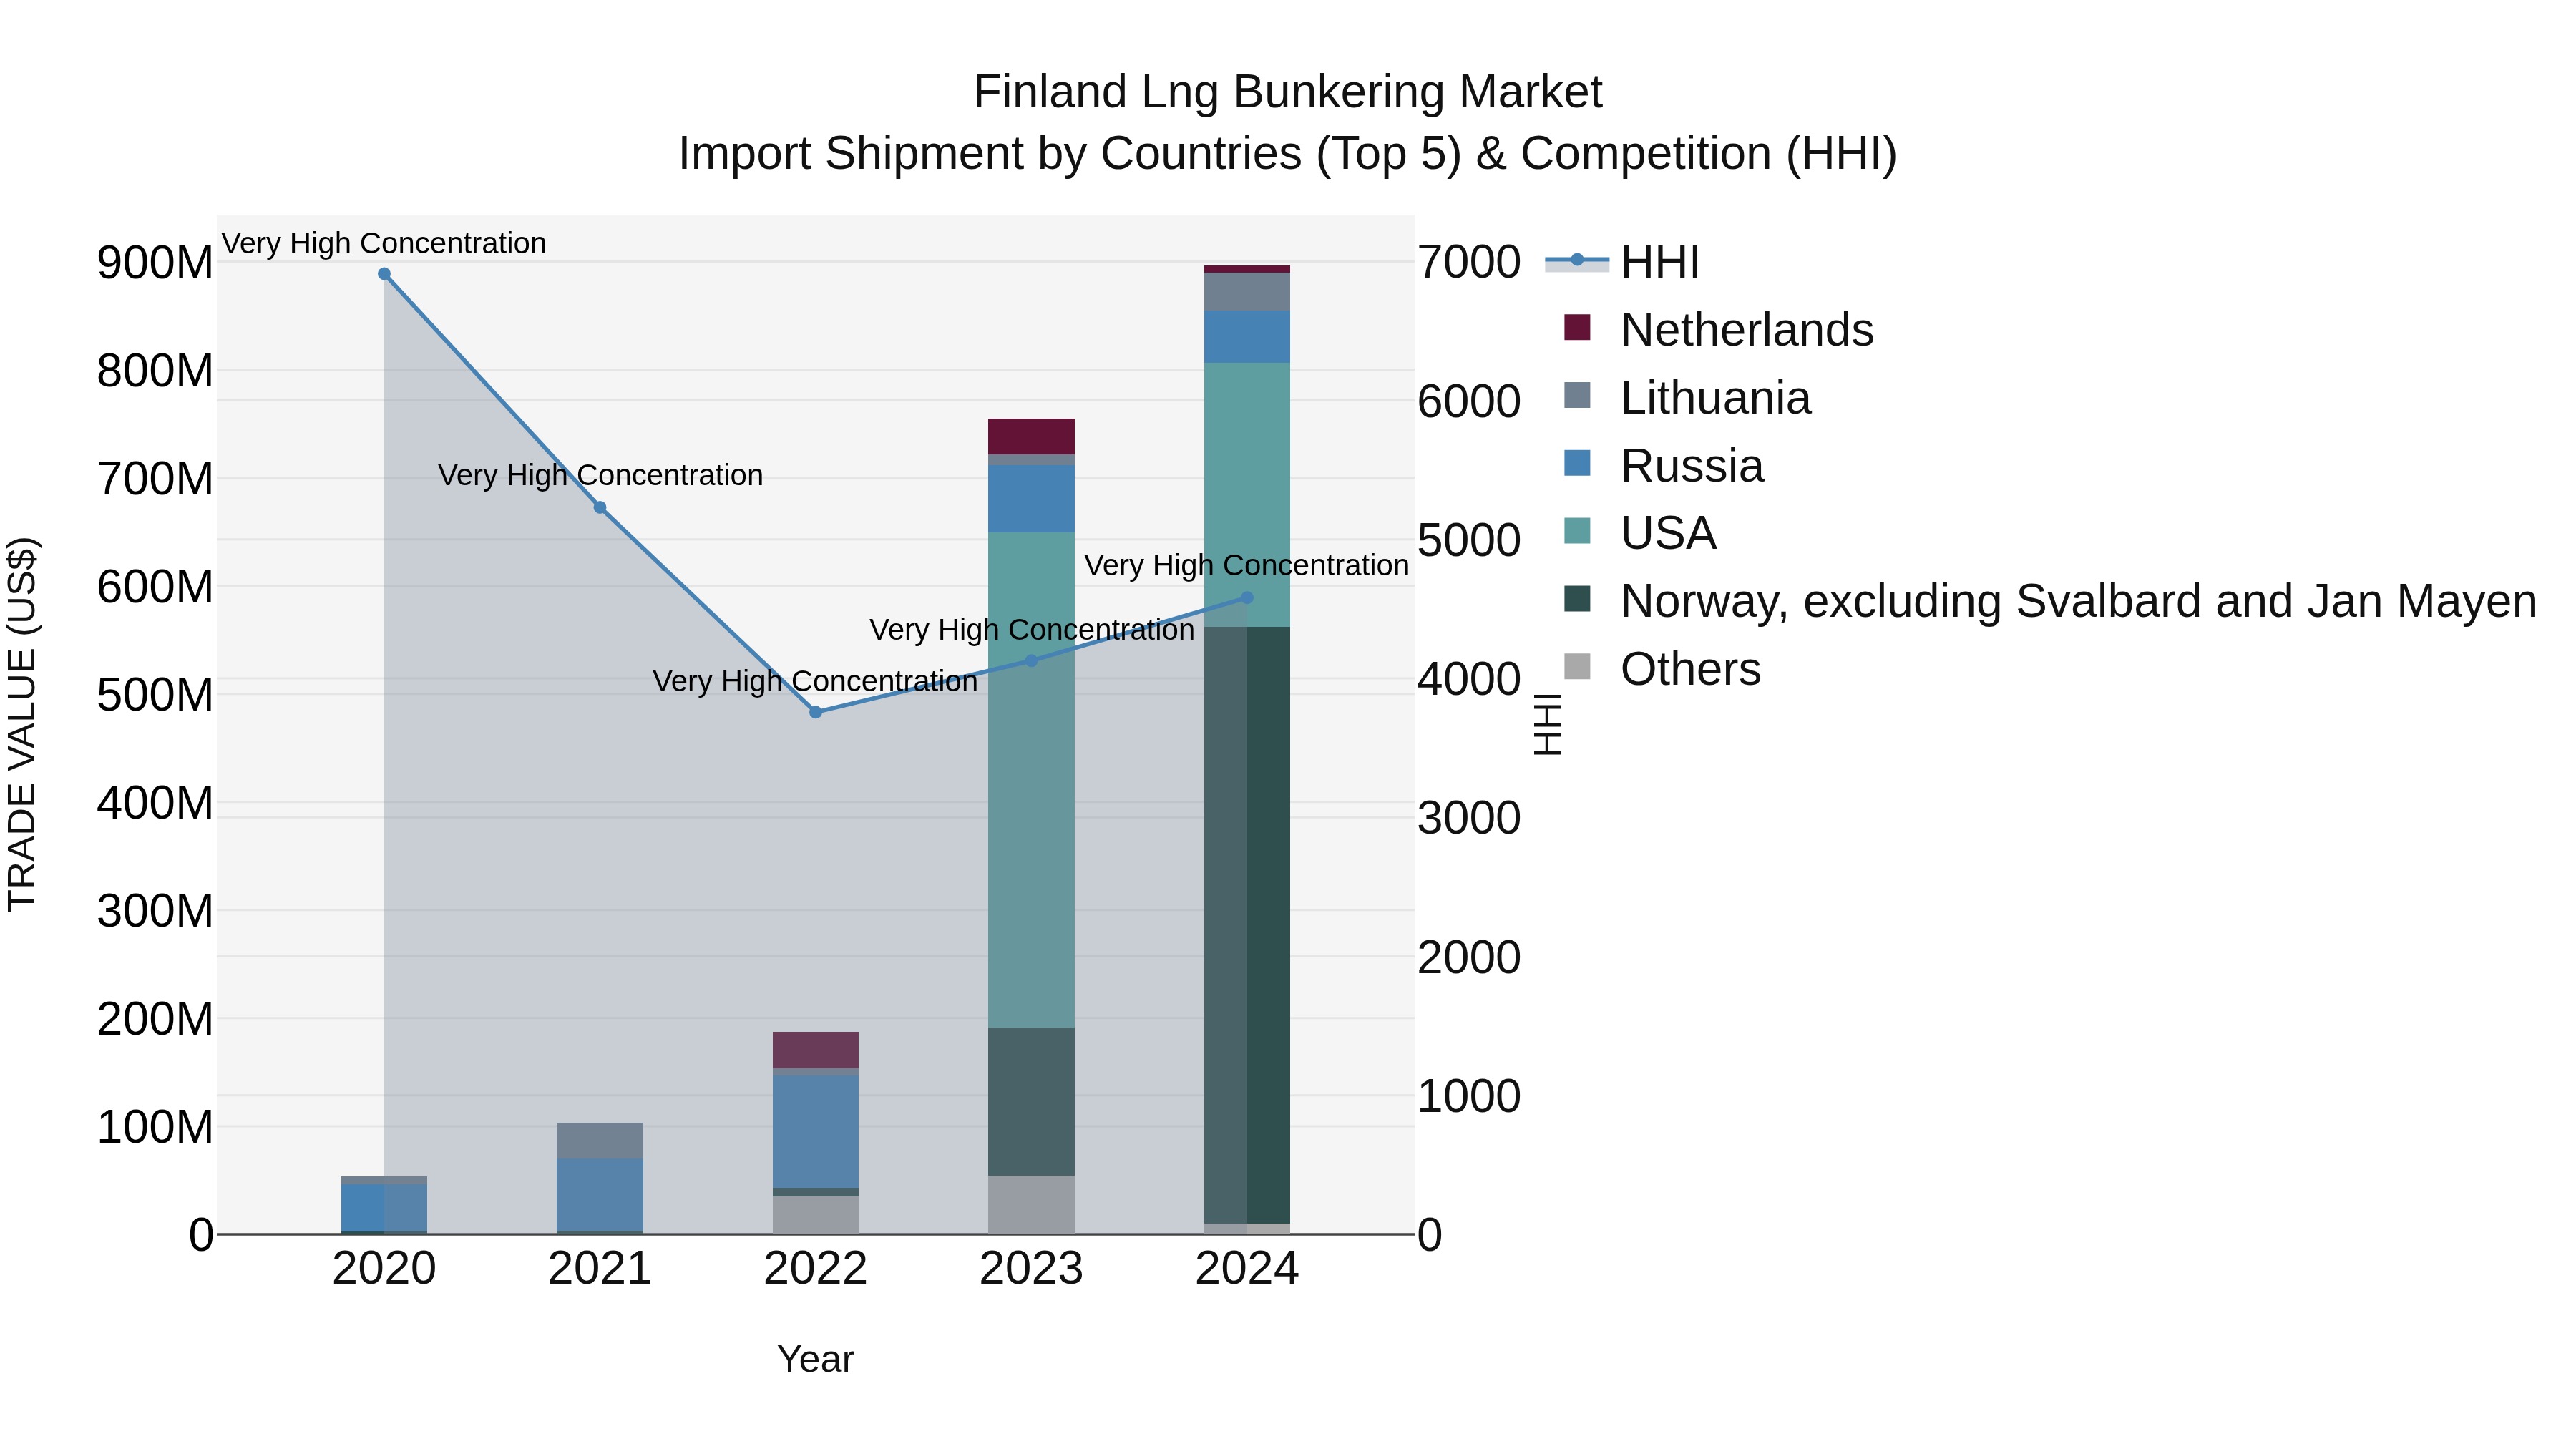
Finland Lng Bunkering Market Top 5 Importing Countries and Market Competition (HHI) Analysis
In 2024, Finland`s LNG bunkering import shipments continued to be dominated by Norway, USA, Russia, Lithuania, and Belgium. The high concentration of the Herfindahl-Hirschman Index (HHI) indicates a competitive market landscape. With a remarkable compound annual growth rate (CAGR) of 102.22% from 2020 to 2024, the industry is experiencing rapid expansion. The impressive growth rate of 18.8% from 2023 to 2024 highlights the increasing demand for LNG bunkering in Finland, signaling opportunities for market players to capitalize on this upward trend.
Finland LNG Bunkering Market Overview
The LNG bunkering market in Finland is growing due to the increasing adoption of liquefied natural gas (LNG) as a cleaner alternative to traditional marine fuels. Finland`s strategic location along major shipping routes in the Baltic Sea has positioned it as a key player in the European LNG bunkering market. As the shipping industry looks to reduce its carbon footprint and comply with international emissions regulations, the demand for LNG bunkering services in Finland is expected to rise, with investments in LNG fueling infrastructure and technology to support this shift.
Drivers of the market
The LNG bunkering market in Finland is experiencing growth due to the rising demand for cleaner alternatives to conventional marine fuels. As part of Finlands commitment to reducing carbon emissions and adhering to environmental regulations, LNG is gaining popularity as a marine fuel. The increasing number of LNG-powered vessels and the development of LNG infrastructure in Finland are further driving market growth.
Challenges of the market
The LNG bunkering market in Finland faces challenges related to the high infrastructure investment needed for LNG terminals and storage facilities. Furthermore, fluctuations in global natural gas prices and the transition to alternative fuels in the shipping industry are contributing to uncertainty within the LNG market.
Government Policy of the market
The LNG Bunkering market in Finland is shaped by policies aimed at reducing greenhouse gas emissions in the maritime sector. Finland supports the transition to LNG as a cleaner alternative to traditional marine fuels and has established infrastructure for LNG bunkering to promote sustainable shipping practices. Government incentives and regulations on reducing sulfur content and CO2 emissions in maritime transport further boost the demand for LNG bunkering solutions.
Key Highlights of the Report:
- Finland LNG Bunkering Market Outlook
- Market Size of Finland LNG Bunkering Market, 2024
- Forecast of Finland LNG Bunkering Market, 2031
- Historical Data and Forecast of Finland LNG Bunkering Revenues & Volume for the Period 2021-2031
- Finland LNG Bunkering Market Trend Evolution
- Finland LNG Bunkering Market Drivers and Challenges
- Finland LNG Bunkering Price Trends
- Finland LNG Bunkering Porter`s Five Forces
- Finland LNG Bunkering Industry Life Cycle
- Historical Data and Forecast of Finland LNG Bunkering Market Revenues & Volume By Product Type for the Period 2021-2031
- Historical Data and Forecast of Finland LNG Bunkering Market Revenues & Volume By Truck-to-Ship for the Period 2021-2031
- Historical Data and Forecast of Finland LNG Bunkering Market Revenues & Volume By Port-to-Ship for the Period 2021-2031
- Historical Data and Forecast of Finland LNG Bunkering Market Revenues & Volume By Ship-to-Ship for the Period 2021-2031
- Historical Data and Forecast of Finland LNG Bunkering Market Revenues & Volume By Portable Tanks for the Period 2021-2031
- Historical Data and Forecast of Finland LNG Bunkering Market Revenues & Volume By Application for the Period 2021-2031
- Historical Data and Forecast of Finland LNG Bunkering Market Revenues & Volume By Container Fleet for the Period 2021-2031
- Historical Data and Forecast of Finland LNG Bunkering Market Revenues & Volume By Tanker Fleet for the Period 2021-2031
- Historical Data and Forecast of Finland LNG Bunkering Market Revenues & Volume By Cargo Fleet for the Period 2021-2031
- Historical Data and Forecast of Finland LNG Bunkering Market Revenues & Volume By Ferries for the Period 2021-2031
- Historical Data and Forecast of Finland LNG Bunkering Market Revenues & Volume By Inland Vessels for the Period 2021-2031
- Historical Data and Forecast of Finland LNG Bunkering Market Revenues & Volume By Others for the Period 2021-2031
- Finland LNG Bunkering Import Export Trade Statistics
- Market Opportunity Assessment By Product Type
- Market Opportunity Assessment By Application
- Finland LNG Bunkering Top Companies Market Share
- Finland LNG Bunkering Competitive Benchmarking By Technical and Operational Parameters
- Finland LNG Bunkering Company Profiles
- Finland LNG Bunkering Key Strategic Recommendations
Frequently Asked Questions About the Market Study (FAQs):
6Wresearch actively monitors the Finland LNG Bunkering Market and publishes its comprehensive annual report, highlighting emerging trends, growth drivers, revenue analysis, and forecast outlook. Our insights help businesses to make data-backed strategic decisions with ongoing market dynamics. Our analysts track relevent industries related to the Finland LNG Bunkering Market, allowing our clients with actionable intelligence and reliable forecasts tailored to emerging regional needs.
Yes, we provide customisation as per your requirements. To learn more, feel free to contact us on sales@6wresearch.com
1 Executive Summary |
2 Introduction |
2.1 Key Highlights of the Report |
2.2 Report Description |
2.3 Market Scope & Segmentation |
2.4 Research Methodology |
2.5 Assumptions |
3 Finland LNG Bunkering Market Overview |
3.1 Finland Country Macro Economic Indicators |
3.2 Finland LNG Bunkering Market Revenues & Volume, 2021 & 2031F |
3.3 Finland LNG Bunkering Market - Industry Life Cycle |
3.4 Finland LNG Bunkering Market - Porter's Five Forces |
3.5 Finland LNG Bunkering Market Revenues & Volume Share, By Product Type, 2021 & 2031F |
3.6 Finland LNG Bunkering Market Revenues & Volume Share, By Application, 2021 & 2031F |
4 Finland LNG Bunkering Market Dynamics |
4.1 Impact Analysis |
4.2 Market Drivers |
4.2.1 Increasing environmental regulations promoting the use of cleaner fuels in the maritime industry |
4.2.2 Growing demand for LNG as a marine fuel due to its lower emissions compared to traditional bunkers |
4.2.3 Government incentives and initiatives to promote LNG bunkering infrastructure development in Finland |
4.3 Market Restraints |
4.3.1 High initial investment costs associated with building LNG bunkering infrastructure |
4.3.2 Limited availability and accessibility of LNG bunkering infrastructure in Finland |
4.3.3 Uncertainty surrounding the future regulatory landscape for LNG as a marine fuel |
5 Finland LNG Bunkering Market Trends |
6 Finland LNG Bunkering Market Segmentations |
6.1 Finland LNG Bunkering Market, By Product Type |
6.1.1 Overview and Analysis |
6.1.2 Finland LNG Bunkering Market Revenues & Volume, By Truck-to-Ship, 2021-2031F |
6.1.3 Finland LNG Bunkering Market Revenues & Volume, By Port-to-Ship, 2021-2031F |
6.1.4 Finland LNG Bunkering Market Revenues & Volume, By Ship-to-Ship, 2021-2031F | 6.1.6 Finland LNG Bunkering Market Revenues & Volume, By Portable Tanks, 2021-2031F |
6.2 Finland LNG Bunkering Market, By Application |
6.2.1 Overview and Analysis |
6.2.2 Finland LNG Bunkering Market Revenues & Volume, By Container Fleet, 2021-2031F |
6.2.3 Finland LNG Bunkering Market Revenues & Volume, By Tanker Fleet, 2021-2031F |
6.2.4 Finland LNG Bunkering Market Revenues & Volume, By Cargo Fleet, 2021-2031F |
6.2.5 Finland LNG Bunkering Market Revenues & Volume, By Ferries, 2021-2031F |
6.2.6 Finland LNG Bunkering Market Revenues & Volume, By Inland Vessels, 2021-2031F |
6.2.7 Finland LNG Bunkering Market Revenues & Volume, By Others, 2021-2031F |
7 Finland LNG Bunkering Market Import-Export Trade Statistics |
7.1 Finland LNG Bunkering Market Export to Major Countries |
7.2 Finland LNG Bunkering Market Imports from Major Countries |
8 Finland LNG Bunkering Market Key Performance Indicators |
8.1 Number of new LNG bunkering infrastructure projects initiated in Finland |
8.2 Percentage increase in LNG bunkering capacity at Finnish ports |
8.3 Growth in the number of LNG-powered vessels calling at Finnish ports |
8.4 Average turnaround time for LNG bunkering operations in Finland |
8.5 Percentage reduction in greenhouse gas emissions from vessels using LNG as fuel in Finnish waters |
9 Finland LNG Bunkering Market - Opportunity Assessment |
9.1 Finland LNG Bunkering Market Opportunity Assessment, By Product Type, 2021 & 2031F |
9.2 Finland LNG Bunkering Market Opportunity Assessment, By Application, 2021 & 2031F |
10 Finland LNG Bunkering Market - Competitive Landscape |
10.1 Finland LNG Bunkering Market Revenue Share, By Companies, 2024 |
10.2 Finland LNG Bunkering Market Competitive Benchmarking, By Operating and Technical Parameters |
11 Company Profiles |
12 Recommendations | 13 Disclaimer |
Export potential assessment - trade Analytics for 2030
Export potential enables firms to identify high-growth global markets with greater confidence by combining advanced trade intelligence with a structured quantitative methodology. The framework analyzes emerging demand trends and country-level import patterns while integrating macroeconomic and trade datasets such as GDP and population forecasts, bilateral import–export flows, tariff structures, elasticity differentials between developed and developing economies, geographic distance, and import demand projections. Using weighted trade values from 2020–2024 as the base period to project country-to-country export potential for 2030, these inputs are operationalized through calculated drivers such as gravity model parameters, tariff impact factors, and projected GDP per-capita growth. Through an analysis of hidden potentials, demand hotspots, and market conditions that are most favorable to success, this method enables firms to focus on target countries, maximize returns, and global expansion with data, backed by accuracy.
By factoring in the projected importer demand gap that is currently unmet and could be potential opportunity, it identifies the potential for the Exporter (Country) among 190 countries, against the general trade analysis, which identifies the biggest importer or exporter.
To discover high-growth global markets and optimize your business strategy:
Click Here
Pricing
- Single User License$ 1,995
- Department License$ 2,400
- Site License$ 3,120
- Global License$ 3,795

Search
Thought Leadership and Analyst Meet


Our Clients
Related Reports
- India Switchgear Market Outlook (2026 - 2032) | Size, Share, Trends, Growth, Revenue, Forecast, Analysis, Value, Outlook
- Pakistan Contraceptive Implants Market (2025-2031) | Demand, Growth, Size, Share, Industry, Pricing Analysis, Competitive, Strategic Insights, Strategy, Consumer Insights, Analysis, Investment Trends, Opportunities, Revenue, Segments, Value, Segmentation, Supply, Forecast, Restraints, Outlook, Competition, Drivers, Trends, Companies, Challenges
- Sri Lanka Packaging Market (2026-2032) | Outlook, Competition, Drivers, Trends, Demand, Pricing Analysis, Competitive, Strategic Insights, Companies, Challenges, Strategy, Consumer Insights, Analysis, Investment Trends, Opportunities, Growth, Size, Share, Industry, Revenue, Segments, Value, Segmentation, Supply, Forecast, Restraints
- India Kids Watches Market (2026-2032) | Strategy, Consumer Insights, Analysis, Investment Trends, Opportunities, Growth, Size, Share, Industry, Revenue, Segments, Value, Segmentation, Supply, Forecast, Restraints, Outlook, Competition, Drivers, Trends, Demand, Pricing Analysis, Competitive, Strategic Insights, Companies, Challenges
- Saudi Arabia Core Assurance Service Market (2025-2031) | Strategy, Consumer Insights, Analysis, Investment Trends, Opportunities, Growth, Size, Share, Industry, Revenue, Segments, Value, Segmentation, Supply, Forecast, Restraints, Outlook, Competition, Drivers, Trends, Demand, Pricing Analysis, Competitive, Strategic Insights, Companies, Challenges
- Romania Uninterruptible Power Supply (UPS) Market (2026-2032) | Industry, Analysis, Revenue, Size, Forecast, Outlook, Value, Trends, Share, Growth & Companies
- Saudi Arabia Car Window Tinting Film, Paint Protection Film (PPF), and Ceramic Coating Market (2025-2031) | Strategy, Consumer Insights, Analysis, Investment Trends, Opportunities, Growth, Size, Share, Industry, Revenue, Segments, Value, Segmentation, Supply, Forecast, Restraints, Outlook, Competition, Drivers, Trends, Demand, Pricing Analysis, Competitive, Strategic Insights, Companies, Challenges
- South Africa Stationery Market (2025-2031) | Share, Size, Industry, Value, Growth, Revenue, Analysis, Trends, Segmentation & Outlook
- Afghanistan Rocking Chairs And Adirondack Chairs Market (2026-2032) | Size & Revenue, Competitive Landscape, Share, Segmentation, Industry, Value, Outlook, Analysis, Trends, Growth, Forecast, Companies
- Afghanistan Apparel Market (2026-2032) | Growth, Outlook, Industry, Segmentation, Forecast, Size, Companies, Trends, Value, Share, Analysis & Revenue
Industry Events and Analyst Meet

India EV Show 2026

EV tech India Expo 2026

Auto Tech Asia 2026

Battery Tech India 2026

Smart Production Solutions Guangzhou 2026
Whitepaper
- Middle East & Africa Commercial Security Market Click here to view more.
- Middle East & Africa Fire Safety Systems & Equipment Market Click here to view more.
- GCC Drone Market Click here to view more.
- Middle East Lighting Fixture Market Click here to view more.
- GCC Physical & Perimeter Security Market Click here to view more.
6WResearch In News
- Doha a strategic location for EV manufacturing hub: IPA Qatar
- Demand for luxury TVs surging in the GCC, says Samsung
- Empowering Growth: The Thriving Journey of Bangladesh’s Cable Industry
- Demand for luxury TVs surging in the GCC, says Samsung
- Video call with a traditional healer? Once unthinkable, it’s now common in South Africa
- Intelligent Buildings To Smooth GCC’s Path To Net Zero