Finland Noble Gases Market (2026-2032) | Size, Segmentation, Opportunities, Analysis, Segments, Strategic Insights, Outlook, Companies, Share, Industry, Value, Pricing Analysis, Competitive, Drivers, Investment Trends, Challenges, Forecast, Revenue, Supply, Demand, Trends, Growth, Consumer Insights, Strategy, Restraints, Competition
Market Forecast By Type (Helium, Neon, Argon, Krypton), By Application (Cryogenics, Lighting, Welding, Insulation), By End User (Healthcare, Electronics, Metal Industry, Construction) And Competitive Landscape
| Product Code: ETC12753762 | Publication Date: Apr 2025 | Updated Date: Apr 2026 | Product Type: Market Research Report | |
| Publisher: 6Wresearch | Author: Sachin Kumar Rai | No. of Pages: 65 | No. of Figures: 34 | No. of Tables: 19 |
Finland Noble Gases Market Size (2020-2030)
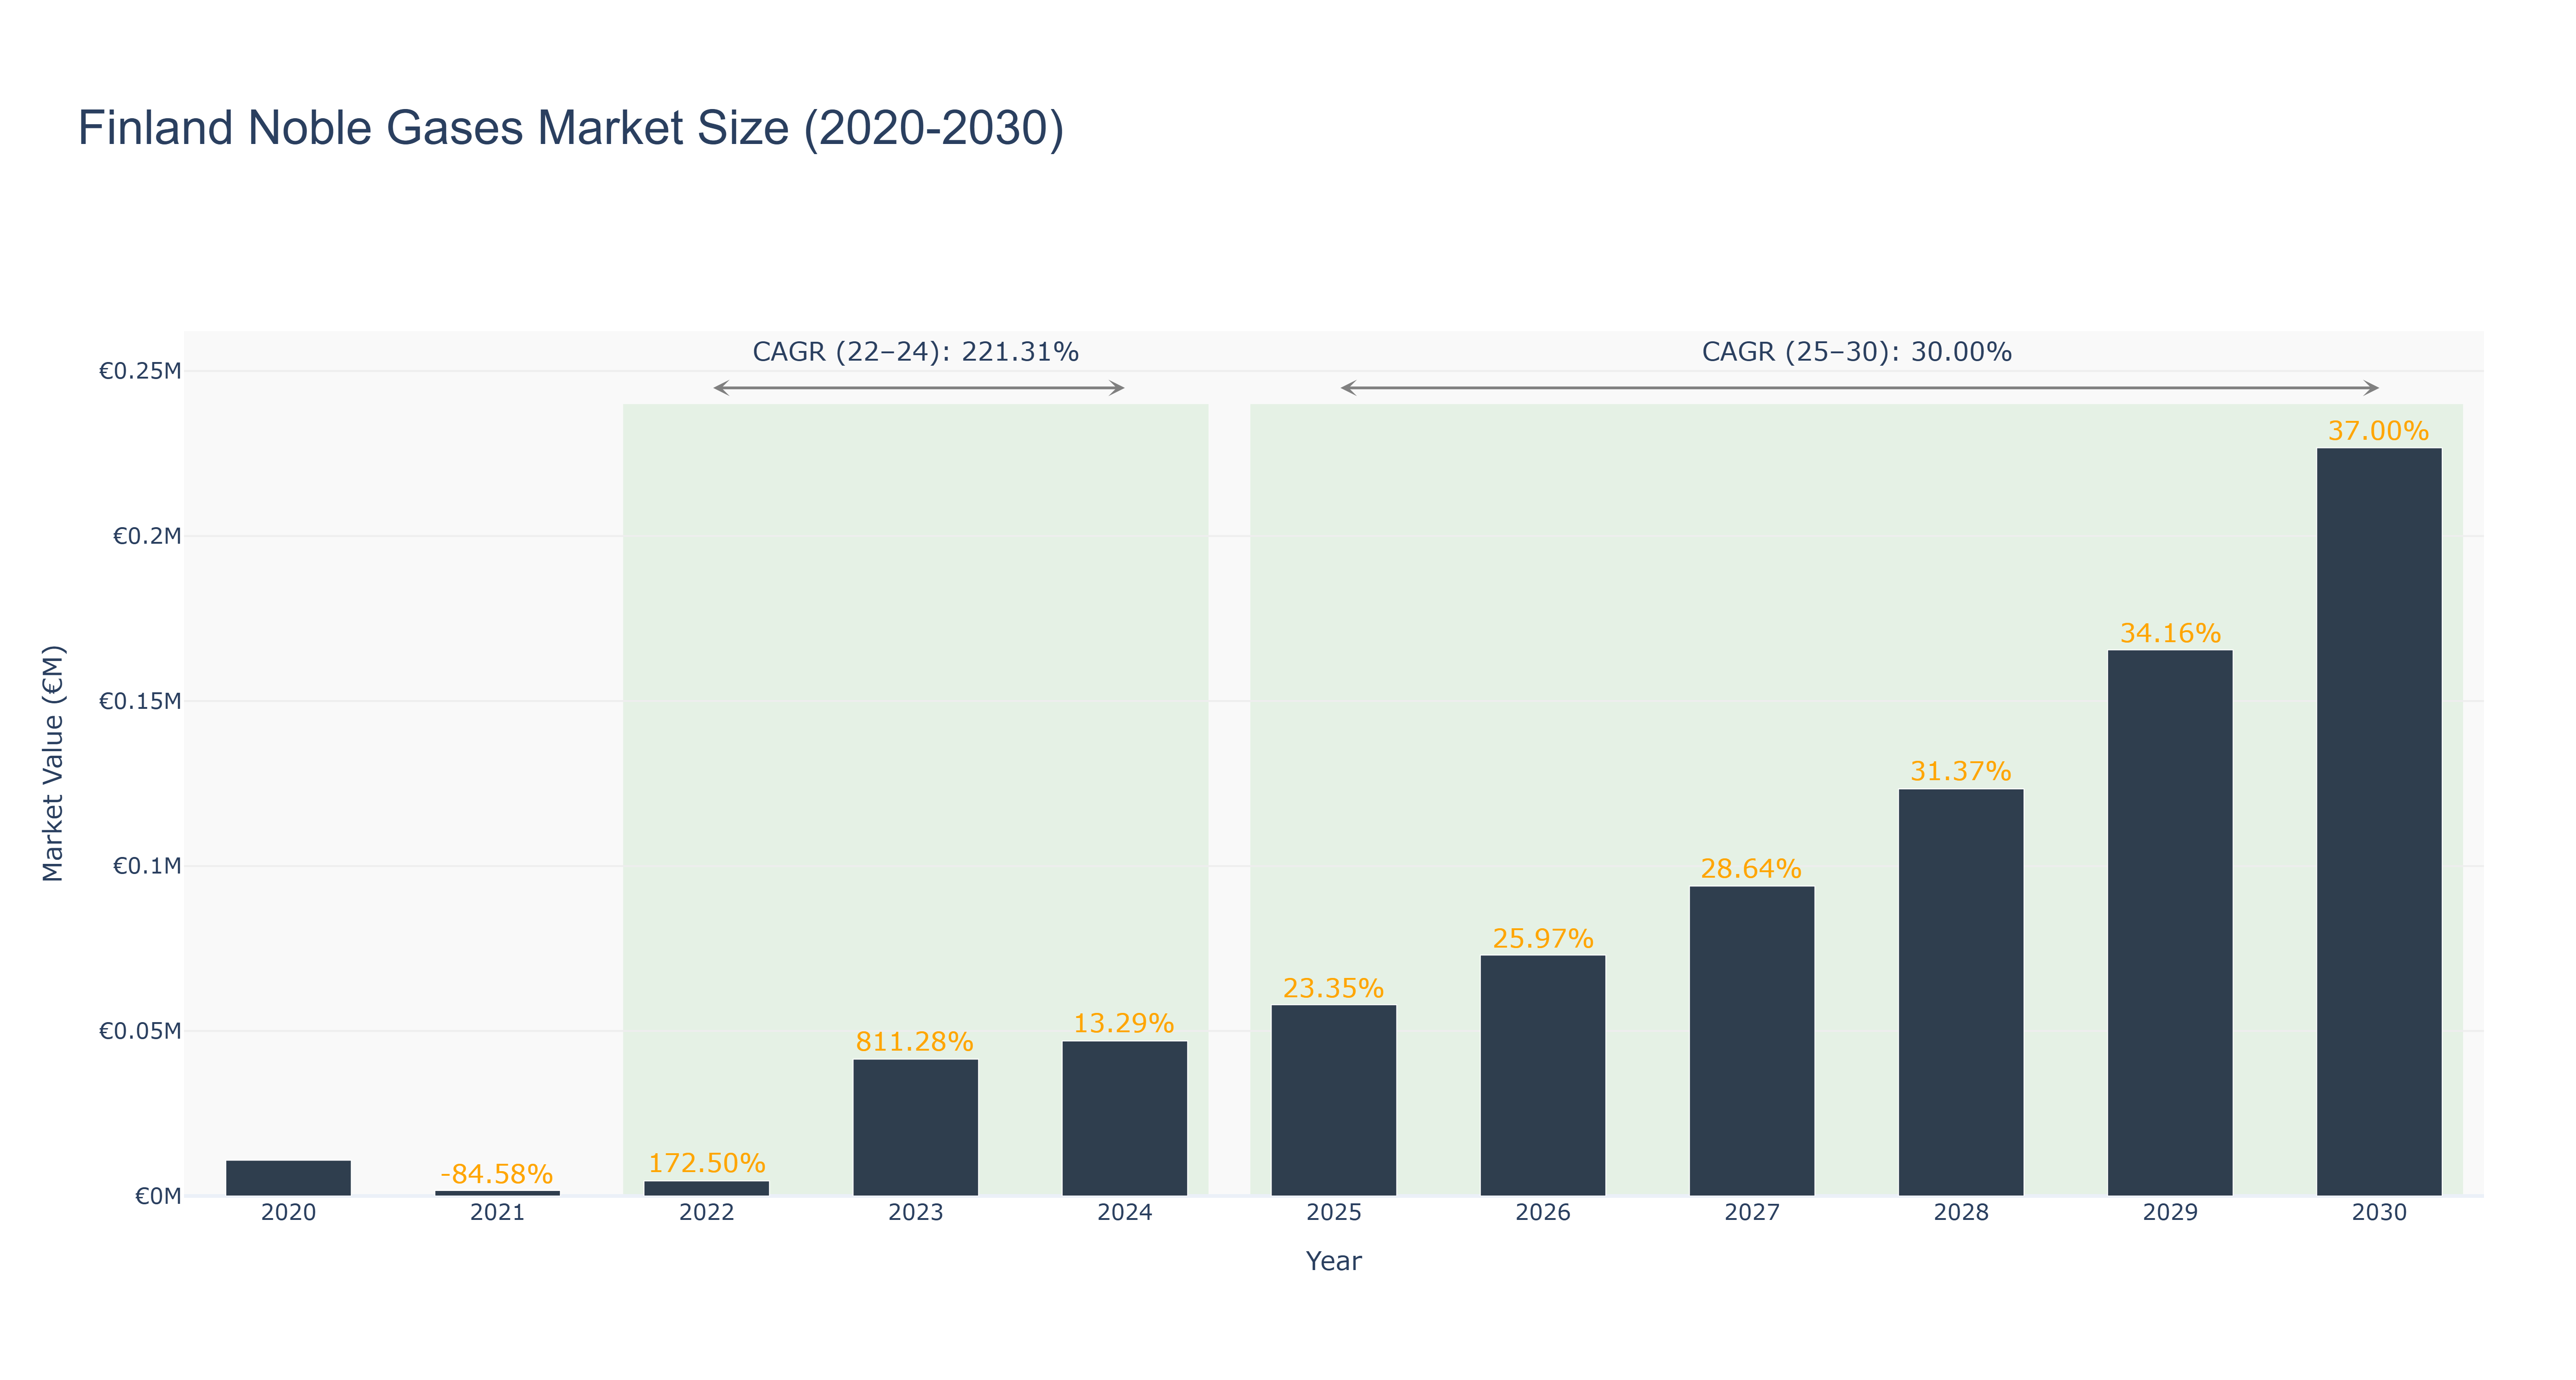
The Finland Noble Gases Market has shown remarkable growth over the years. The market size has steadily increased from €0.01 million in 2020 to €0.23 million in 2030, with a notable spike in 2023 due to an 811.28% growth rate. The peak market size was reached in 2030. The CAGR for the period 2022-2024 was an impressive 221.31%, while the CAGR for 2025-2030 is forecasted at 30.0%. The market's growth can be attributed to increasing demand for noble gases in various industries such as healthcare, electronics, and manufacturing. Looking ahead, Finland is set to invest in renewable energy projects that will drive further demand for noble gases in the country, ensuring sustained market growth in the coming years.
Finland Noble Gases Market: Production & Trade Performance (2019-2025)
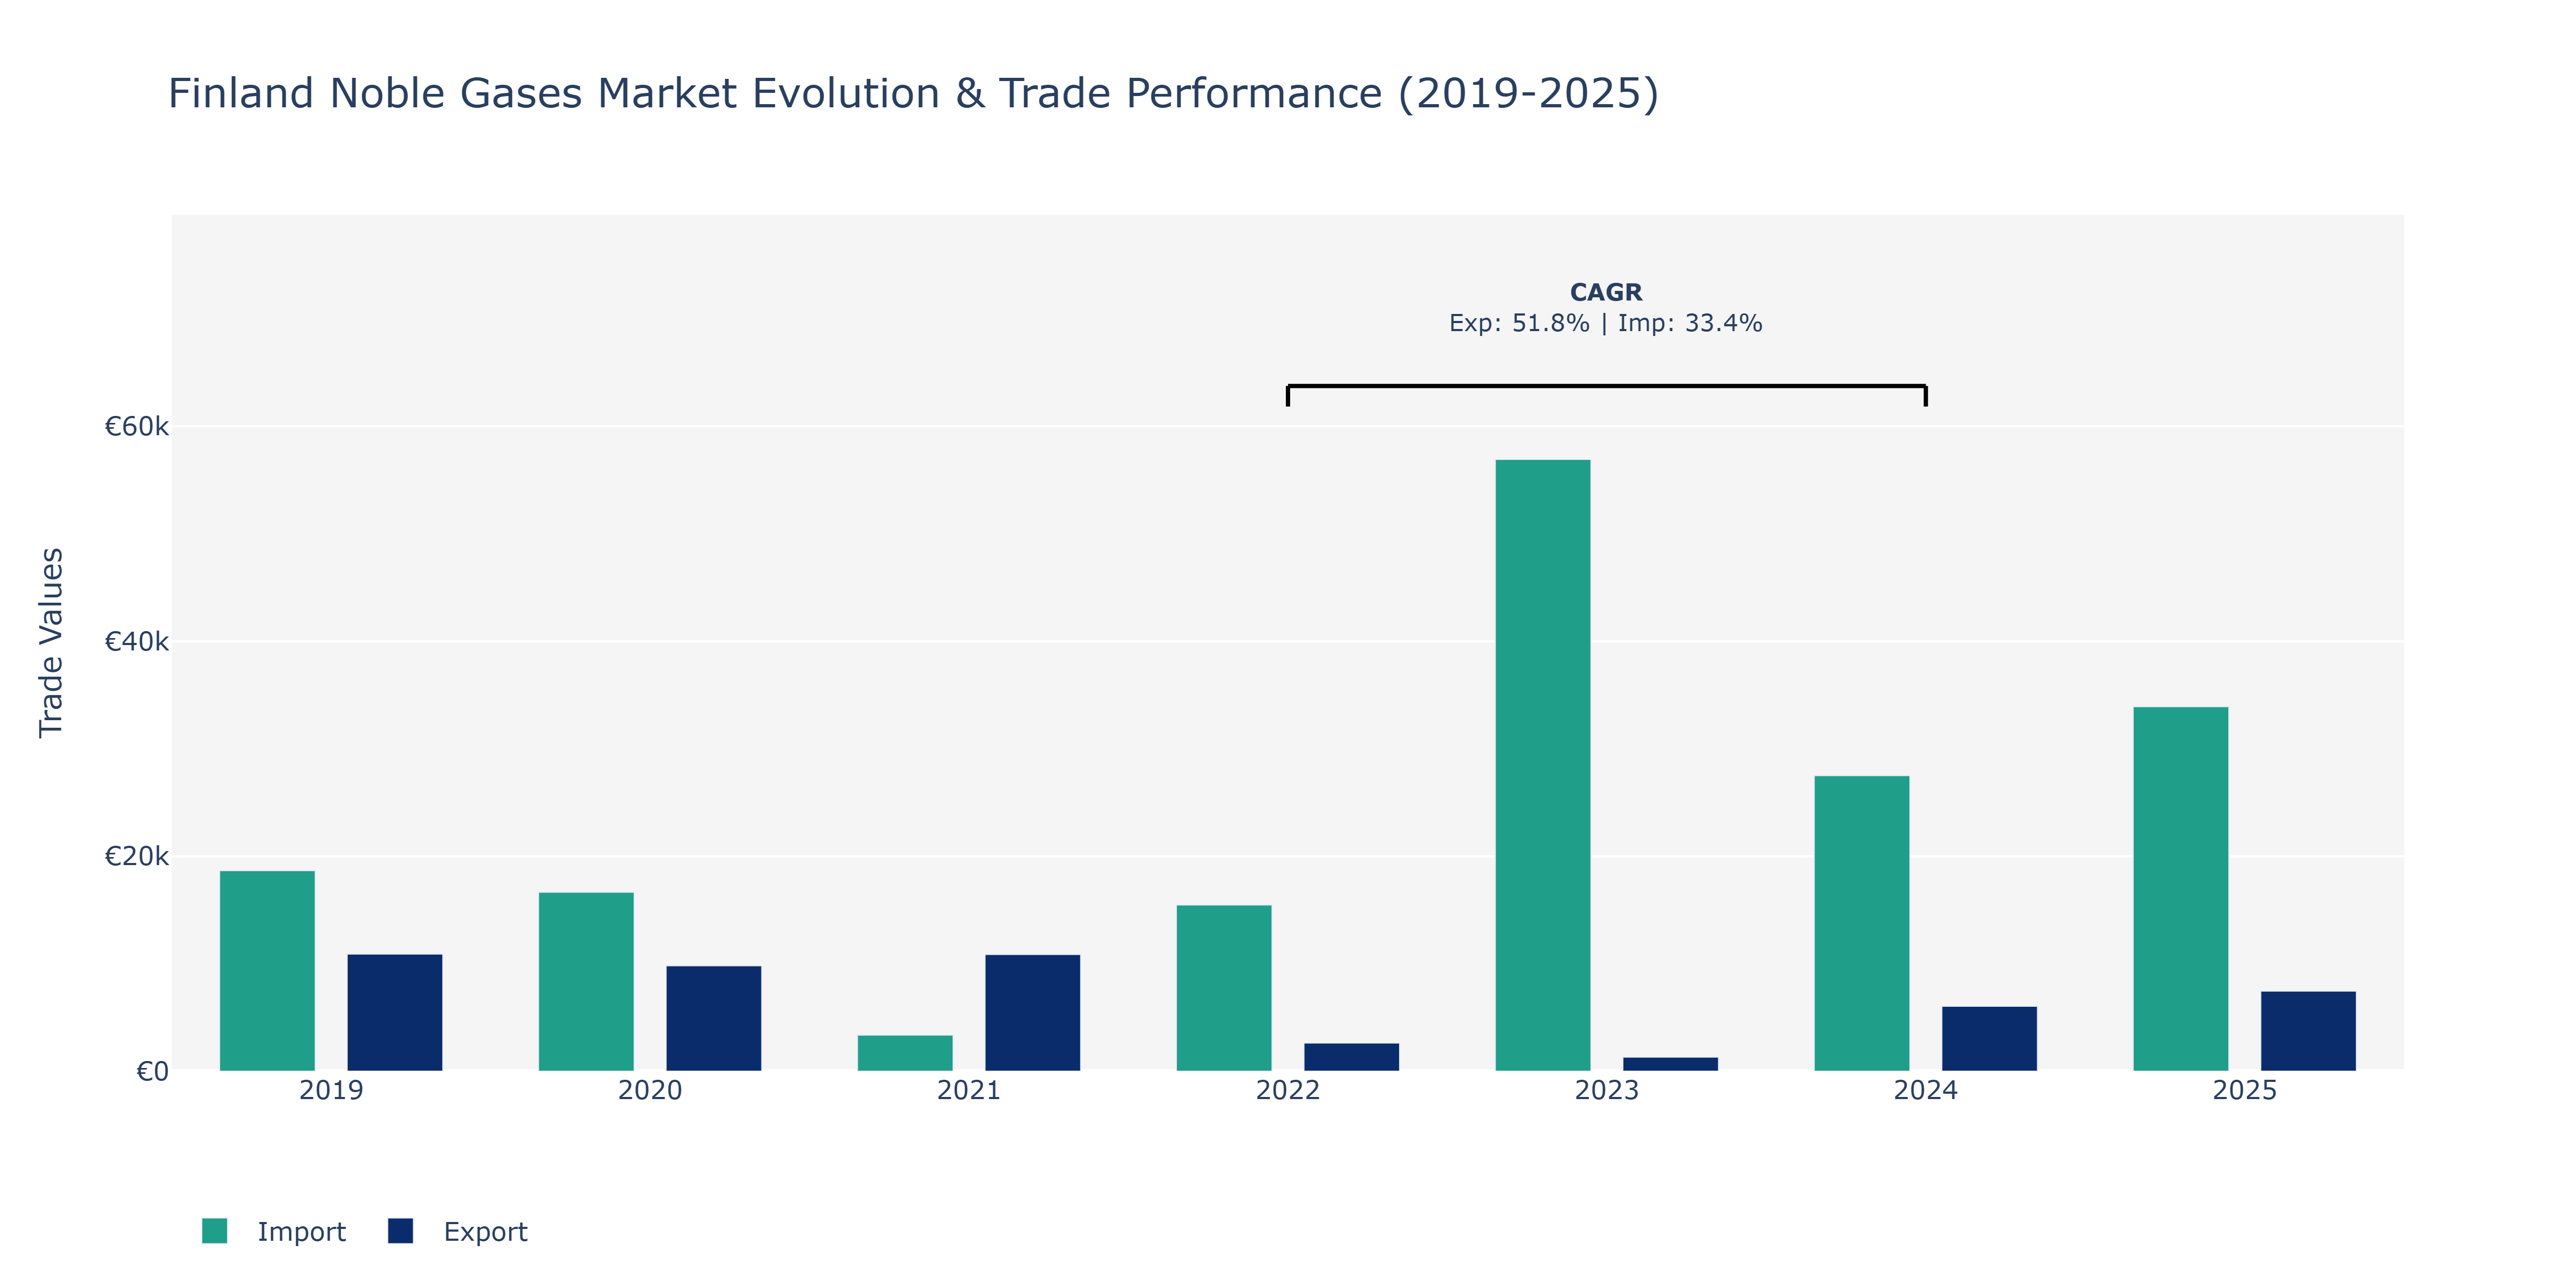
In the Finland Noble Gases Market, from 2019 to 2025, Exports exhibited fluctuations, starting at €10.9 thousand in 2019, declining to €2.6 thousand in 2022, then increasing to €7.5 thousand in 2025. Imports, on the other hand, started at €18.66 thousand in 2019, dropped to €3.36 thousand in 2021, before gradually rising to €33.92 thousand in 2025. Notably, a substantial decline in exports in 2022 could be attributed to market dynamics or regulatory changes impacting the industry. The surge in imports post-2021 suggests a growing demand for noble gases in Finland, potentially driven by industrial expansions or technological advancements requiring these gases. The significant increase in exports and imports over the years indicates a maturing market with evolving needs and competitive landscapes, signaling opportunities for market players to capitalize on the growing demand for noble gases in various sectors.
Key Highlights of the Report:
- Finland Noble Gases Market Outlook
- Market Size of Finland Noble Gases Market, 2025
- Forecast of Finland Noble Gases Market, 2032
- Historical Data and Forecast of Finland Noble Gases Revenues & Volume for the Period 2022 - 2032F
- Finland Noble Gases Market Trend Evolution
- Finland Noble Gases Market Drivers and Challenges
- Finland Noble Gases Price Trends
- Finland Noble Gases Porter's Five Forces
- Finland Noble Gases Industry Life Cycle
- Historical Data and Forecast of Finland Noble Gases Market Revenues & Volume By Type for the Period 2022 - 2032F
- Historical Data and Forecast of Finland Noble Gases Market Revenues & Volume By Helium for the Period 2022 - 2032F
- Historical Data and Forecast of Finland Noble Gases Market Revenues & Volume By Neon for the Period 2022 - 2032F
- Historical Data and Forecast of Finland Noble Gases Market Revenues & Volume By Argon for the Period 2022 - 2032F
- Historical Data and Forecast of Finland Noble Gases Market Revenues & Volume By Krypton for the Period 2022 - 2032F
- Historical Data and Forecast of Finland Noble Gases Market Revenues & Volume By Application for the Period 2022 - 2032F
- Historical Data and Forecast of Finland Noble Gases Market Revenues & Volume By Cryogenics for the Period 2022 - 2032F
- Historical Data and Forecast of Finland Noble Gases Market Revenues & Volume By Lighting for the Period 2022 - 2032F
- Historical Data and Forecast of Finland Noble Gases Market Revenues & Volume By Welding for the Period 2022 - 2032F
- Historical Data and Forecast of Finland Noble Gases Market Revenues & Volume By Insulation for the Period 2022 - 2032F
- Historical Data and Forecast of Finland Noble Gases Market Revenues & Volume By End User for the Period 2022 - 2032F
- Historical Data and Forecast of Finland Noble Gases Market Revenues & Volume By Healthcare for the Period 2022 - 2032F
- Historical Data and Forecast of Finland Noble Gases Market Revenues & Volume By Electronics for the Period 2022 - 2032F
- Historical Data and Forecast of Finland Noble Gases Market Revenues & Volume By Metal Industry for the Period 2022 - 2032F
- Historical Data and Forecast of Finland Noble Gases Market Revenues & Volume By Construction for the Period 2022 - 2032F
- Finland Noble Gases Import Export Trade Statistics
- Market Opportunity Assessment By Type
- Market Opportunity Assessment By Application
- Market Opportunity Assessment By End User
- Finland Noble Gases Top Companies Market Share
- Finland Noble Gases Competitive Benchmarking By Technical and Operational Parameters
- Finland Noble Gases Company Profiles
- Finland Noble Gases Key Strategic Recommendations
Frequently Asked Questions About the Market Study (FAQs):
6Wresearch actively monitors the Finland Noble Gases Market and publishes its comprehensive annual report, highlighting emerging trends, growth drivers, revenue analysis, and forecast outlook. Our insights help businesses to make data-backed strategic decisions with ongoing market dynamics. Our analysts track relevent industries related to the Finland Noble Gases Market, allowing our clients with actionable intelligence and reliable forecasts tailored to emerging regional needs.
Yes, we provide customisation as per your requirements. To learn more, feel free to contact us on sales@6wresearch.com
1 Executive Summary |
2 Introduction |
2.1 Key Highlights of the Report |
2.2 Report Description |
2.3 Market Scope & Segmentation |
2.4 Research Methodology |
2.5 Assumptions |
3 Finland Noble Gases Market Overview |
3.1 Finland Country Macro Economic Indicators |
3.2 Finland Noble Gases Market Revenues & Volume, 2022 & 2032F |
3.3 Finland Noble Gases Market - Industry Life Cycle |
3.4 Finland Noble Gases Market - Porter's Five Forces |
3.5 Finland Noble Gases Market Revenues & Volume Share, By Type, 2022 & 2032F |
3.6 Finland Noble Gases Market Revenues & Volume Share, By Application, 2022 & 2032F |
3.7 Finland Noble Gases Market Revenues & Volume Share, By End User, 2022 & 2032F |
4 Finland Noble Gases Market Dynamics |
4.1 Impact Analysis |
4.2 Market Drivers |
4.2.1 Growing demand for noble gases in various industries such as healthcare, electronics, and manufacturing due to their unique properties. |
4.2.2 Increasing use of noble gases in lighting, welding, and analytical instruments, driving market growth. |
4.2.3 Technological advancements leading to new applications of noble gases, expanding the market. |
4.3 Market Restraints |
4.3.1 High cost associated with the production and handling of noble gases limiting market expansion. |
4.3.2 Limited availability of raw materials used in the production of noble gases could impact market growth. |
4.3.3 Stringent regulations regarding the use and disposal of noble gases posing challenges for market players. |
5 Finland Noble Gases Market Trends |
6 Finland Noble Gases Market, By Types |
6.1 Finland Noble Gases Market, By Type |
6.1.1 Overview and Analysis |
6.1.2 Finland Noble Gases Market Revenues & Volume, By Type, 2022 - 2032F |
6.1.3 Finland Noble Gases Market Revenues & Volume, By Helium, 2022 - 2032F |
6.1.4 Finland Noble Gases Market Revenues & Volume, By Neon, 2022 - 2032F |
6.1.5 Finland Noble Gases Market Revenues & Volume, By Argon, 2022 - 2032F |
6.1.6 Finland Noble Gases Market Revenues & Volume, By Krypton, 2022 - 2032F |
6.2 Finland Noble Gases Market, By Application |
6.2.1 Overview and Analysis |
6.2.2 Finland Noble Gases Market Revenues & Volume, By Cryogenics, 2022 - 2032F |
6.2.3 Finland Noble Gases Market Revenues & Volume, By Lighting, 2022 - 2032F |
6.2.4 Finland Noble Gases Market Revenues & Volume, By Welding, 2022 - 2032F |
6.2.5 Finland Noble Gases Market Revenues & Volume, By Insulation, 2022 - 2032F |
6.3 Finland Noble Gases Market, By End User |
6.3.1 Overview and Analysis |
6.3.2 Finland Noble Gases Market Revenues & Volume, By Healthcare, 2022 - 2032F |
6.3.3 Finland Noble Gases Market Revenues & Volume, By Electronics, 2022 - 2032F |
6.3.4 Finland Noble Gases Market Revenues & Volume, By Metal Industry, 2022 - 2032F |
6.3.5 Finland Noble Gases Market Revenues & Volume, By Construction, 2022 - 2032F |
7 Finland Noble Gases Market Import-Export Trade Statistics |
7.1 Finland Noble Gases Market Export to Major Countries |
7.2 Finland Noble Gases Market Imports from Major Countries |
8 Finland Noble Gases Market Key Performance Indicators |
8.1 Research and development investment in innovative applications of noble gases. |
8.2 Adoption rate of noble gases in emerging industries. |
8.3 Rate of technological advancements in noble gas production and purification methods. |
9 Finland Noble Gases Market - Opportunity Assessment |
9.1 Finland Noble Gases Market Opportunity Assessment, By Type, 2022 & 2032F |
9.2 Finland Noble Gases Market Opportunity Assessment, By Application, 2022 & 2032F |
9.3 Finland Noble Gases Market Opportunity Assessment, By End User, 2022 & 2032F |
10 Finland Noble Gases Market - Competitive Landscape |
10.1 Finland Noble Gases Market Revenue Share, By Companies, 2025 |
10.2 Finland Noble Gases Market Competitive Benchmarking, By Operating and Technical Parameters |
11 Company Profiles |
12 Recommendations |
13 Disclaimer |
Export potential assessment - trade Analytics for 2030
Export potential enables firms to identify high-growth global markets with greater confidence by combining advanced trade intelligence with a structured quantitative methodology. The framework analyzes emerging demand trends and country-level import patterns while integrating macroeconomic and trade datasets such as GDP and population forecasts, bilateral import–export flows, tariff structures, elasticity differentials between developed and developing economies, geographic distance, and import demand projections. Using weighted trade values from 2020–2024 as the base period to project country-to-country export potential for 2030, these inputs are operationalized through calculated drivers such as gravity model parameters, tariff impact factors, and projected GDP per-capita growth. Through an analysis of hidden potentials, demand hotspots, and market conditions that are most favorable to success, this method enables firms to focus on target countries, maximize returns, and global expansion with data, backed by accuracy.
By factoring in the projected importer demand gap that is currently unmet and could be potential opportunity, it identifies the potential for the Exporter (Country) among 190 countries, against the general trade analysis, which identifies the biggest importer or exporter.
To discover high-growth global markets and optimize your business strategy:
Click Here
Pricing
- Single User License$ 1,995
- Department License$ 2,400
- Site License$ 3,120
- Global License$ 3,795

Search
Thought Leadership and Analyst Meet


Our Clients
Latest Reports
- Philippines Polyhydroxybutyrate-co-Hydroxyvalerate Market (2026-2032) | Trends, Insights, Challenges, Restraints, Competition, Size, Value, Forecast, Pricing, Share, Outlook, Revenue, Investment Opportunities, Strategy, Drivers, Demand, Growth, segmentation, Analysis, Companies
- Peru Polyhydroxybutyrate-co-Hydroxyvalerate Market (2026-2032) | Growth, Demand, Challenges, Share, Trends, Analysis, Pricing, Investment Opportunities, Drivers, Value, Forecast, Competition, Size, Companies, Insights, Outlook, Restraints, segmentation, Revenue, Strategy
- Pakistan Polyhydroxybutyrate-co-Hydroxyvalerate Market (2026-2032) | Restraints, segmentation, Pricing, Forecast, Share, Strategy, Competition, Trends, Insights, Drivers, Challenges, Growth, Revenue, Outlook, Value, Investment Opportunities, Companies, Size, Analysis, Demand
- Oman Polyhydroxybutyrate-co-Hydroxyvalerate Market (2026-2032) | Drivers, segmentation, Insights, Competition, Pricing, Outlook, Size, Revenue, Challenges, Forecast, Analysis, Growth, Value, Share, Trends, Investment Opportunities, Strategy, Restraints, Companies, Demand
- Nigeria Polyhydroxybutyrate-co-Hydroxyvalerate Market (2026-2032) | Value, Investment Opportunities, Analysis, Revenue, Restraints, Pricing, Outlook, Competition, Demand, Growth, Forecast, Companies, Trends, Challenges, segmentation, Drivers, Insights, Share, Size, Strategy
- Nepal Polyhydroxybutyrate-co-Hydroxyvalerate Market (2026-2032) | Insights, Analysis, Drivers, Share, Revenue, Demand, segmentation, Investment Opportunities, Competition, Forecast, Growth, Pricing, Companies, Strategy, Trends, Restraints, Challenges, Outlook, Size, Value
- Myanmar Polyhydroxybutyrate-co-Hydroxyvalerate Market (2026-2032) | Outlook, Revenue, Strategy, Restraints, Drivers, segmentation, Share, Forecast, Competition, Insights, Growth, Pricing, Size, Demand, Value, Companies, Trends, Challenges, Investment Opportunities, Analysis
- Morocco Polyhydroxybutyrate-co-Hydroxyvalerate Market (2026-2032) | Outlook, Investment Opportunities, Restraints, Strategy, Forecast, Challenges, Drivers, Growth, Companies, segmentation, Trends, Size, Competition, Revenue, Demand, Insights, Share, Analysis, Value, Pricing
- Mexico Polyhydroxybutyrate-co-Hydroxyvalerate Market (2026-2032) | Size, Drivers, Outlook, Share, Strategy, Growth, Pricing, Challenges, Companies, Demand, Value, Investment Opportunities, Restraints, Trends, Forecast, segmentation, Analysis, Insights, Competition, Revenue
- Malaysia Polyhydroxybutyrate-co-Hydroxyvalerate Market (2026-2032) | Share, segmentation, Size, Companies, Analysis, Insights, Forecast, Value, Revenue, Drivers, Restraints, Challenges, Investment Opportunities, Trends, Competition, Strategy, Demand, Growth, Outlook, Pricing
Industry Events and Analyst Meet

HIMTEX 2026

India Refining Summit 2026

India EV Show 2026

EV tech India Expo 2026

Auto Tech Asia 2026
Whitepaper
- Middle East & Africa Commercial Security Market Click here to view more.
- Middle East & Africa Fire Safety Systems & Equipment Market Click here to view more.
- GCC Drone Market Click here to view more.
- Middle East Lighting Fixture Market Click here to view more.
- GCC Physical & Perimeter Security Market Click here to view more.
6WResearch In News
- Doha a strategic location for EV manufacturing hub: IPA Qatar
- Demand for luxury TVs surging in the GCC, says Samsung
- Empowering Growth: The Thriving Journey of Bangladesh’s Cable Industry
- Demand for luxury TVs surging in the GCC, says Samsung
- Video call with a traditional healer? Once unthinkable, it’s now common in South Africa
- Intelligent Buildings To Smooth GCC’s Path To Net Zero