Finland Ready-to-Drink Tea & Coffee Market (2026-2032) | Segmentation, Competitive, Segments, Industry, Revenue, Restraints, Opportunities, Size, Demand, Companies, Trends, Value, Strategy, Investment Trends, Analysis, Growth, Outlook, Supply, Strategic Insights, Challenges, Drivers, Forecast, Share, Consumer Insights, Competition, Pricing Analysis
Market Forecast By Type (Coffee-Based, Tea-Based, Energy-Boosting, Herbal-Infused, Sugar-Free), By Flavor (Mocha, Green Tea, Black Tea, Chamomile, Unsweetened), By Packaging Type (Bottles, Cans, Tetra Packs, Pouches, Cartons), By Distribution Channel (Supermarkets/Hypermarkets, Online Retail, Convenience Stores, Specialty Stores, Cafs & Restaurants), By End User (Office Workers, Students, Travelers, Health Conscious, Diabetic Consumers) And Competitive Landscape
| Product Code: ETC10273890 | Publication Date: Apr 2025 | Updated Date: Apr 2026 | Product Type: Market Research Report | |
| Publisher: 6Wresearch | No. of Pages: 65 | No. of Figures: 34 | No. of Tables: 19 | |
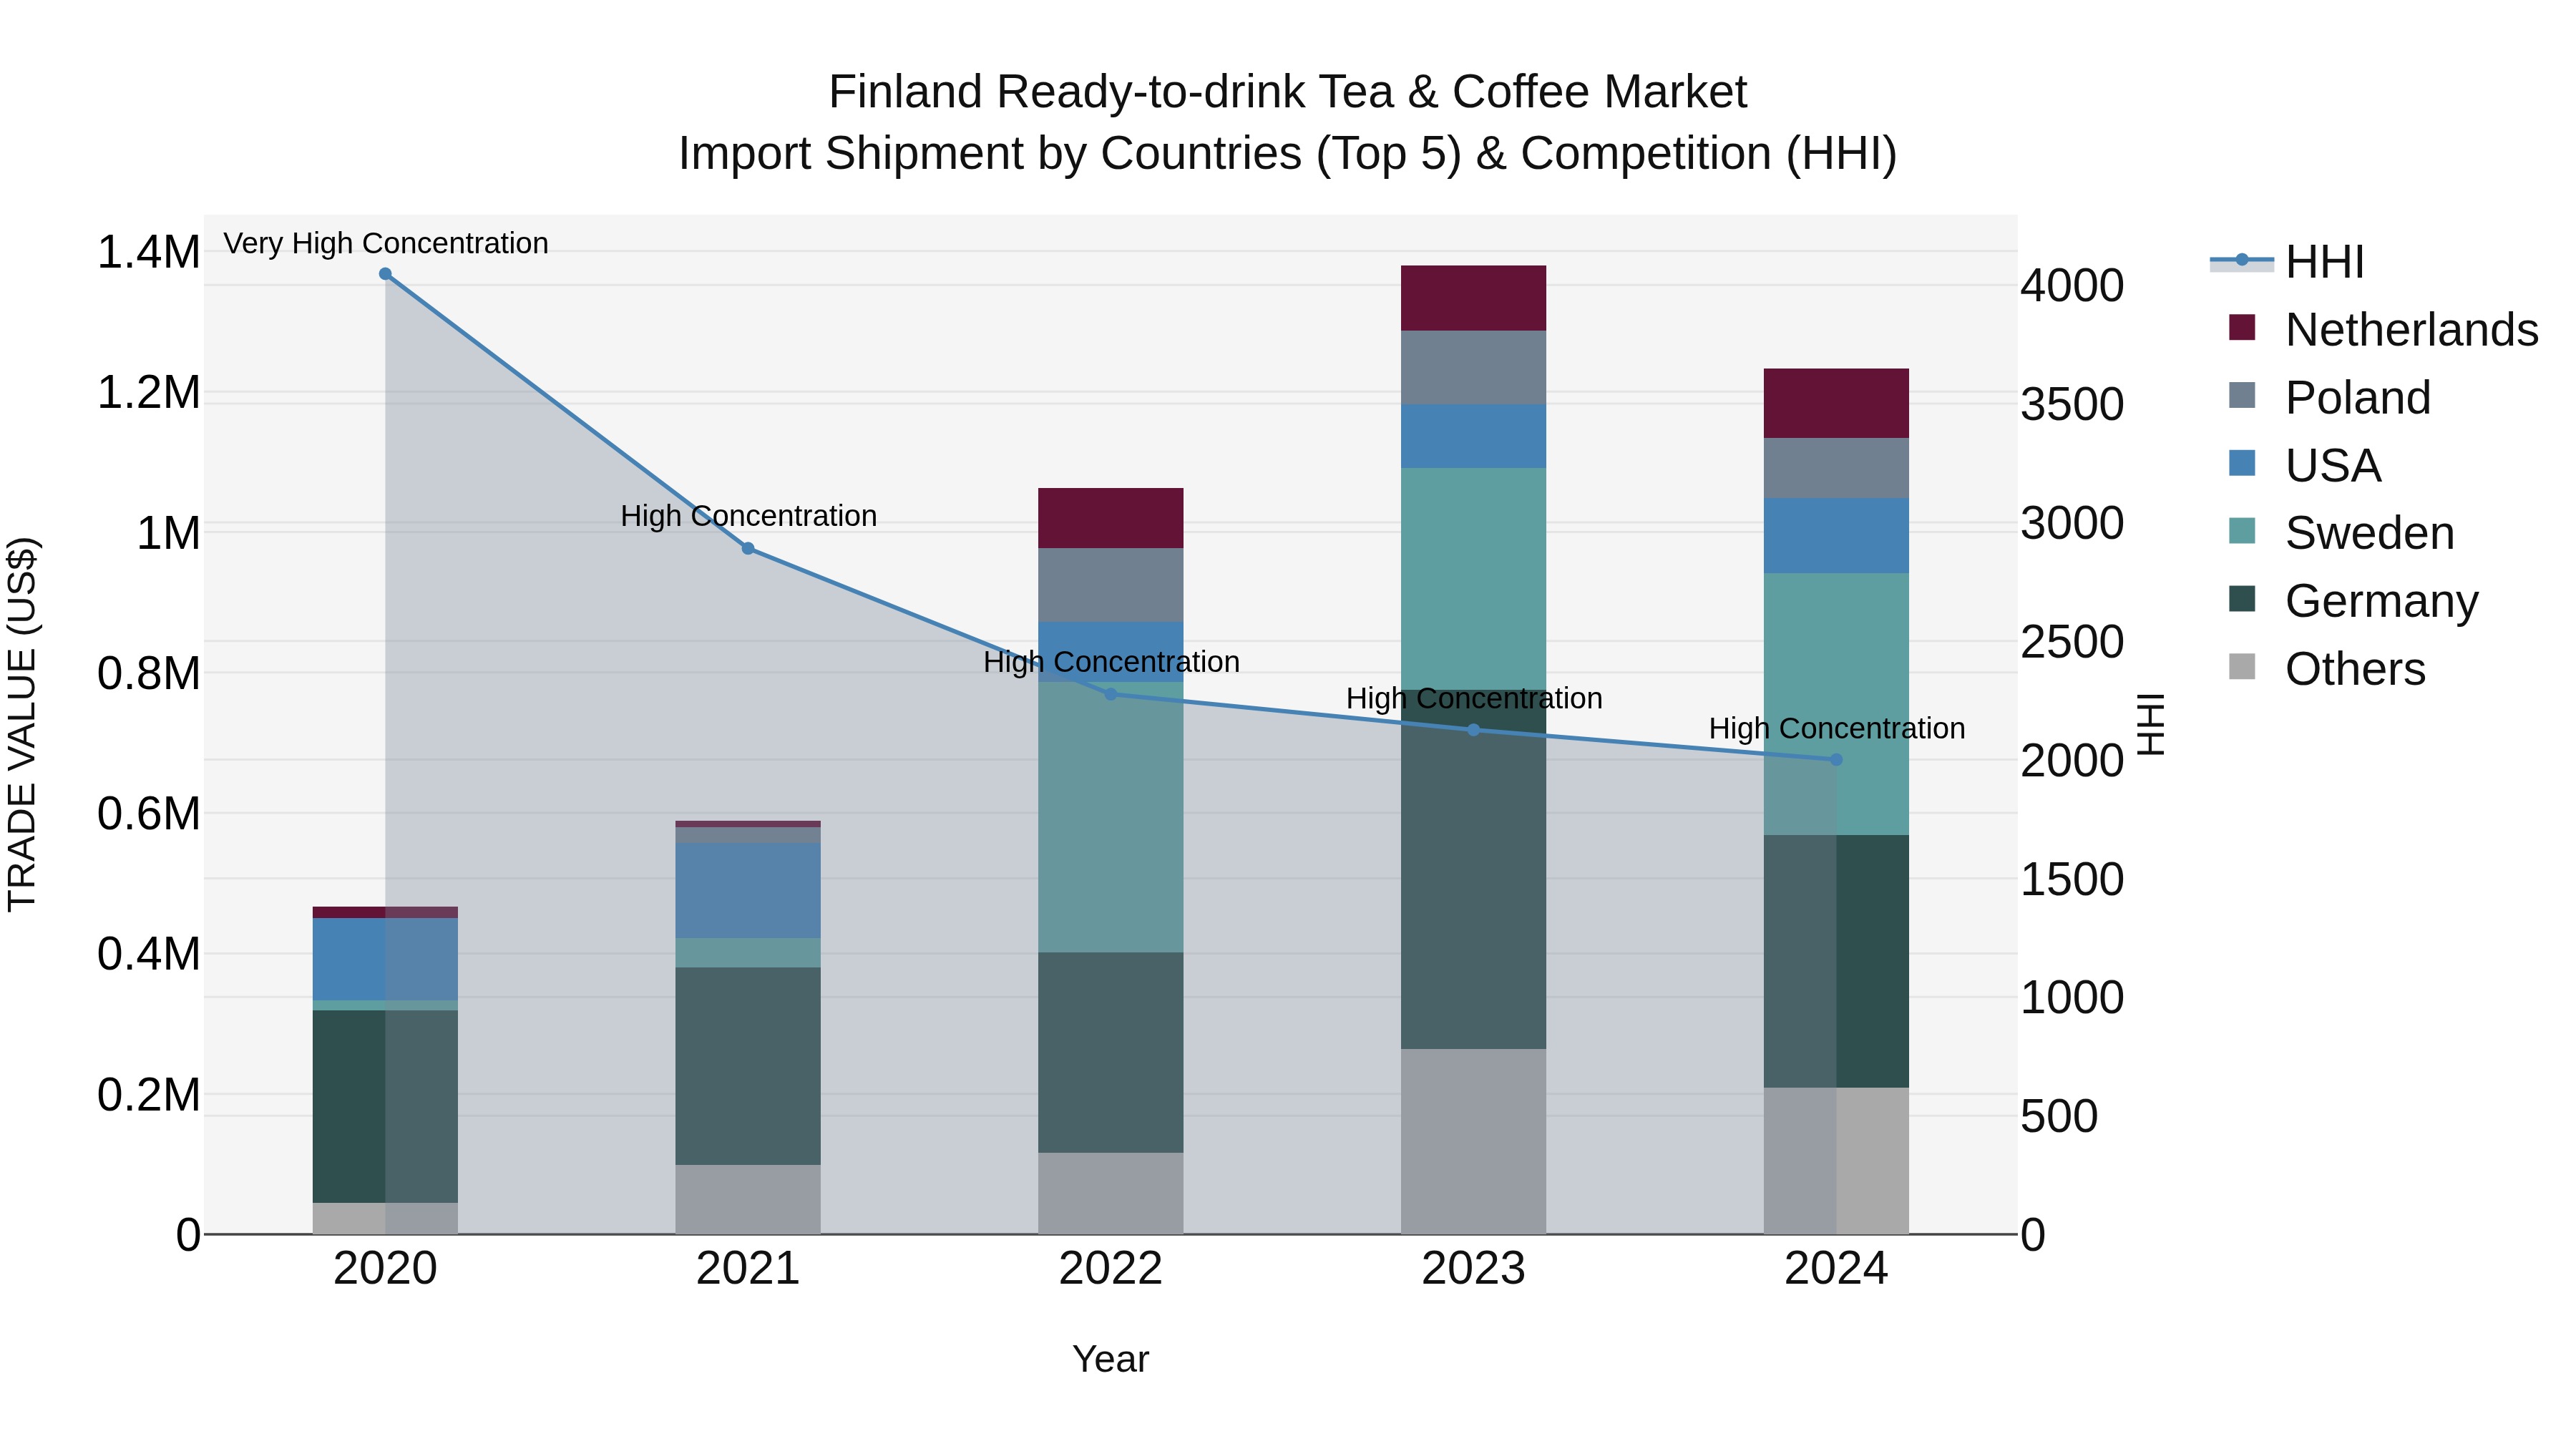
Finland Ready-to-drink Tea & Coffee Market Top 5 Importing Countries and Market Competition (HHI) Analysis
The ready-to-drink tea and coffee import market in Finland witnessed strong growth with a high Herfindahl-Hirschman Index (HHI) indicating market concentration in 2024. Despite a slight decline in growth rate from 2023 to 2024, the cumulative annual growth rate (CAGR) from 2020 to 2024 was impressive at 27.49%. Key exporting countries to Finland included Sweden, Germany, USA, Netherlands, and Poland, showcasing a diverse source of supply for the market. This data suggests a thriving market for ready-to-drink tea and coffee imports in Finland with continued opportunities for expansion and competition.
Key Highlights of the Report:
- Finland Ready-to-Drink Tea & Coffee Market Outlook
- Market Size of Finland Ready-to-Drink Tea & Coffee Market, 2025
- Forecast of Finland Ready-to-Drink Tea & Coffee Market, 2032
- Historical Data and Forecast of Finland Ready-to-Drink Tea & Coffee Revenues & Volume for the Period 2022 - 2032F
- Finland Ready-to-Drink Tea & Coffee Market Trend Evolution
- Finland Ready-to-Drink Tea & Coffee Market Drivers and Challenges
- Finland Ready-to-Drink Tea & Coffee Price Trends
- Finland Ready-to-Drink Tea & Coffee Porter's Five Forces
- Finland Ready-to-Drink Tea & Coffee Industry Life Cycle
- Historical Data and Forecast of Finland Ready-to-Drink Tea & Coffee Market Revenues & Volume By Type for the Period 2022 - 2032F
- Historical Data and Forecast of Finland Ready-to-Drink Tea & Coffee Market Revenues & Volume By Coffee-Based for the Period 2022 - 2032F
- Historical Data and Forecast of Finland Ready-to-Drink Tea & Coffee Market Revenues & Volume By Tea-Based for the Period 2022 - 2032F
- Historical Data and Forecast of Finland Ready-to-Drink Tea & Coffee Market Revenues & Volume By Energy-Boosting for the Period 2022 - 2032F
- Historical Data and Forecast of Finland Ready-to-Drink Tea & Coffee Market Revenues & Volume By Herbal-Infused for the Period 2022 - 2032F
- Historical Data and Forecast of Finland Ready-to-Drink Tea & Coffee Market Revenues & Volume By Sugar-Free for the Period 2022 - 2032F
- Historical Data and Forecast of Finland Ready-to-Drink Tea & Coffee Market Revenues & Volume By Flavor for the Period 2022 - 2032F
- Historical Data and Forecast of Finland Ready-to-Drink Tea & Coffee Market Revenues & Volume By Mocha for the Period 2022 - 2032F
- Historical Data and Forecast of Finland Ready-to-Drink Tea & Coffee Market Revenues & Volume By Green Tea for the Period 2022 - 2032F
- Historical Data and Forecast of Finland Ready-to-Drink Tea & Coffee Market Revenues & Volume By Black Tea for the Period 2022 - 2032F
- Historical Data and Forecast of Finland Ready-to-Drink Tea & Coffee Market Revenues & Volume By Chamomile for the Period 2022 - 2032F
- Historical Data and Forecast of Finland Ready-to-Drink Tea & Coffee Market Revenues & Volume By Unsweetened for the Period 2022 - 2032F
- Historical Data and Forecast of Finland Ready-to-Drink Tea & Coffee Market Revenues & Volume By Packaging Type for the Period 2022 - 2032F
- Historical Data and Forecast of Finland Ready-to-Drink Tea & Coffee Market Revenues & Volume By Bottles for the Period 2022 - 2032F
- Historical Data and Forecast of Finland Ready-to-Drink Tea & Coffee Market Revenues & Volume By Cans for the Period 2022 - 2032F
- Historical Data and Forecast of Finland Ready-to-Drink Tea & Coffee Market Revenues & Volume By Tetra Packs for the Period 2022 - 2032F
- Historical Data and Forecast of Finland Ready-to-Drink Tea & Coffee Market Revenues & Volume By Pouches for the Period 2022 - 2032F
- Historical Data and Forecast of Finland Ready-to-Drink Tea & Coffee Market Revenues & Volume By Cartons for the Period 2022 - 2032F
- Historical Data and Forecast of Finland Ready-to-Drink Tea & Coffee Market Revenues & Volume By Distribution Channel for the Period 2022 - 2032F
- Historical Data and Forecast of Finland Ready-to-Drink Tea & Coffee Market Revenues & Volume By Supermarkets/Hypermarkets for the Period 2022 - 2032F
- Historical Data and Forecast of Finland Ready-to-Drink Tea & Coffee Market Revenues & Volume By Online Retail for the Period 2022 - 2032F
- Historical Data and Forecast of Finland Ready-to-Drink Tea & Coffee Market Revenues & Volume By Convenience Stores for the Period 2022 - 2032F
- Historical Data and Forecast of Finland Ready-to-Drink Tea & Coffee Market Revenues & Volume By Specialty Stores for the Period 2022 - 2032F
- Historical Data and Forecast of Finland Ready-to-Drink Tea & Coffee Market Revenues & Volume By Cafs & Restaurants for the Period 2022 - 2032F
- Historical Data and Forecast of Finland Ready-to-Drink Tea & Coffee Market Revenues & Volume By End User for the Period 2022 - 2032F
- Historical Data and Forecast of Finland Ready-to-Drink Tea & Coffee Market Revenues & Volume By Office Workers for the Period 2022 - 2032F
- Historical Data and Forecast of Finland Ready-to-Drink Tea & Coffee Market Revenues & Volume By Students for the Period 2022 - 2032F
- Historical Data and Forecast of Finland Ready-to-Drink Tea & Coffee Market Revenues & Volume By Travelers for the Period 2022 - 2032F
- Historical Data and Forecast of Finland Ready-to-Drink Tea & Coffee Market Revenues & Volume By Health Conscious for the Period 2022 - 2032F
- Historical Data and Forecast of Finland Ready-to-Drink Tea & Coffee Market Revenues & Volume By Diabetic Consumers for the Period 2022 - 2032F
- Finland Ready-to-Drink Tea & Coffee Import Export Trade Statistics
- Market Opportunity Assessment By Type
- Market Opportunity Assessment By Flavor
- Market Opportunity Assessment By Packaging Type
- Market Opportunity Assessment By Distribution Channel
- Market Opportunity Assessment By End User
- Finland Ready-to-Drink Tea & Coffee Top Companies Market Share
- Finland Ready-to-Drink Tea & Coffee Competitive Benchmarking By Technical and Operational Parameters
- Finland Ready-to-Drink Tea & Coffee Company Profiles
- Finland Ready-to-Drink Tea & Coffee Key Strategic Recommendations
Frequently Asked Questions About the Market Study (FAQs):
6Wresearch actively monitors the Finland Ready-to-Drink Tea & Coffee Market and publishes its comprehensive annual report, highlighting emerging trends, growth drivers, revenue analysis, and forecast outlook. Our insights help businesses to make data-backed strategic decisions with ongoing market dynamics. Our analysts track relevent industries related to the Finland Ready-to-Drink Tea & Coffee Market, allowing our clients with actionable intelligence and reliable forecasts tailored to emerging regional needs.
Yes, we provide customisation as per your requirements. To learn more, feel free to contact us on sales@6wresearch.com
1 Executive Summary |
2 Introduction |
2.1 Key Highlights of the Report |
2.2 Report Description |
2.3 Market Scope & Segmentation |
2.4 Research Methodology |
2.5 Assumptions |
3 Finland Ready-to-Drink Tea & Coffee Market Overview |
3.1 Finland Country Macro Economic Indicators |
3.2 Finland Ready-to-Drink Tea & Coffee Market Revenues & Volume, 2022 & 2032F |
3.3 Finland Ready-to-Drink Tea & Coffee Market - Industry Life Cycle |
3.4 Finland Ready-to-Drink Tea & Coffee Market - Porter's Five Forces |
3.5 Finland Ready-to-Drink Tea & Coffee Market Revenues & Volume Share, By Type, 2022 & 2032F |
3.6 Finland Ready-to-Drink Tea & Coffee Market Revenues & Volume Share, By Flavor, 2022 & 2032F |
3.7 Finland Ready-to-Drink Tea & Coffee Market Revenues & Volume Share, By Packaging Type, 2022 & 2032F |
3.8 Finland Ready-to-Drink Tea & Coffee Market Revenues & Volume Share, By Distribution Channel, 2022 & 2032F |
3.9 Finland Ready-to-Drink Tea & Coffee Market Revenues & Volume Share, By End User, 2022 & 2032F |
4 Finland Ready-to-Drink Tea & Coffee Market Dynamics |
4.1 Impact Analysis |
4.2 Market Drivers |
4.2.1 Increasing consumer demand for convenient and on-the-go beverage options |
4.2.2 Growing health consciousness leading to a preference for natural and low-calorie beverages |
4.2.3 Innovation in flavors and packaging to attract a wider consumer base |
4.3 Market Restraints |
4.3.1 Price sensitivity of consumers impacting purchasing decisions |
4.3.2 Competition from other beverage categories like energy drinks and fruit juices |
4.3.3 Seasonality affecting consumption patterns, with higher demand in warmer months |
5 Finland Ready-to-Drink Tea & Coffee Market Trends |
6 Finland Ready-to-Drink Tea & Coffee Market, By Types |
6.1 Finland Ready-to-Drink Tea & Coffee Market, By Type |
6.1.1 Overview and Analysis |
6.1.2 Finland Ready-to-Drink Tea & Coffee Market Revenues & Volume, By Type, 2022 - 2032F |
6.1.3 Finland Ready-to-Drink Tea & Coffee Market Revenues & Volume, By Coffee-Based, 2022 - 2032F |
6.1.4 Finland Ready-to-Drink Tea & Coffee Market Revenues & Volume, By Tea-Based, 2022 - 2032F |
6.1.5 Finland Ready-to-Drink Tea & Coffee Market Revenues & Volume, By Energy-Boosting, 2022 - 2032F |
6.1.6 Finland Ready-to-Drink Tea & Coffee Market Revenues & Volume, By Herbal-Infused, 2022 - 2032F |
6.1.7 Finland Ready-to-Drink Tea & Coffee Market Revenues & Volume, By Sugar-Free, 2022 - 2032F |
6.2 Finland Ready-to-Drink Tea & Coffee Market, By Flavor |
6.2.1 Overview and Analysis |
6.2.2 Finland Ready-to-Drink Tea & Coffee Market Revenues & Volume, By Mocha, 2022 - 2032F |
6.2.3 Finland Ready-to-Drink Tea & Coffee Market Revenues & Volume, By Green Tea, 2022 - 2032F |
6.2.4 Finland Ready-to-Drink Tea & Coffee Market Revenues & Volume, By Black Tea, 2022 - 2032F |
6.2.5 Finland Ready-to-Drink Tea & Coffee Market Revenues & Volume, By Chamomile, 2022 - 2032F |
6.2.6 Finland Ready-to-Drink Tea & Coffee Market Revenues & Volume, By Unsweetened, 2022 - 2032F |
6.3 Finland Ready-to-Drink Tea & Coffee Market, By Packaging Type |
6.3.1 Overview and Analysis |
6.3.2 Finland Ready-to-Drink Tea & Coffee Market Revenues & Volume, By Bottles, 2022 - 2032F |
6.3.3 Finland Ready-to-Drink Tea & Coffee Market Revenues & Volume, By Cans, 2022 - 2032F |
6.3.4 Finland Ready-to-Drink Tea & Coffee Market Revenues & Volume, By Tetra Packs, 2022 - 2032F |
6.3.5 Finland Ready-to-Drink Tea & Coffee Market Revenues & Volume, By Pouches, 2022 - 2032F |
6.3.6 Finland Ready-to-Drink Tea & Coffee Market Revenues & Volume, By Cartons, 2022 - 2032F |
6.4 Finland Ready-to-Drink Tea & Coffee Market, By Distribution Channel |
6.4.1 Overview and Analysis |
6.4.2 Finland Ready-to-Drink Tea & Coffee Market Revenues & Volume, By Supermarkets/Hypermarkets, 2022 - 2032F |
6.4.3 Finland Ready-to-Drink Tea & Coffee Market Revenues & Volume, By Online Retail, 2022 - 2032F |
6.4.4 Finland Ready-to-Drink Tea & Coffee Market Revenues & Volume, By Convenience Stores, 2022 - 2032F |
6.4.5 Finland Ready-to-Drink Tea & Coffee Market Revenues & Volume, By Specialty Stores, 2022 - 2032F |
6.4.6 Finland Ready-to-Drink Tea & Coffee Market Revenues & Volume, By Caf s & Restaurants, 2022 - 2032F |
6.5 Finland Ready-to-Drink Tea & Coffee Market, By End User |
6.5.1 Overview and Analysis |
6.5.2 Finland Ready-to-Drink Tea & Coffee Market Revenues & Volume, By Office Workers, 2022 - 2032F |
6.5.3 Finland Ready-to-Drink Tea & Coffee Market Revenues & Volume, By Students, 2022 - 2032F |
6.5.4 Finland Ready-to-Drink Tea & Coffee Market Revenues & Volume, By Travelers, 2022 - 2032F |
6.5.5 Finland Ready-to-Drink Tea & Coffee Market Revenues & Volume, By Health Conscious, 2022 - 2032F |
6.5.6 Finland Ready-to-Drink Tea & Coffee Market Revenues & Volume, By Diabetic Consumers, 2022 - 2032F |
7 Finland Ready-to-Drink Tea & Coffee Market Import-Export Trade Statistics |
7.1 Finland Ready-to-Drink Tea & Coffee Market Export to Major Countries |
7.2 Finland Ready-to-Drink Tea & Coffee Market Imports from Major Countries |
8 Finland Ready-to-Drink Tea & Coffee Market Key Performance Indicators |
8.1 Consumer engagement on social media platforms for ready-to-drink tea coffee brands |
8.2 Rate of new product launches and innovations in the market |
8.3 Percentage of repeat purchases by consumers |
8.4 Sustainability initiatives adopted by companies in the market |
8.5 Distribution network expansion and increase in availability of products in various retail channels |
9 Finland Ready-to-Drink Tea & Coffee Market - Opportunity Assessment |
9.1 Finland Ready-to-Drink Tea & Coffee Market Opportunity Assessment, By Type, 2022 & 2032F |
9.2 Finland Ready-to-Drink Tea & Coffee Market Opportunity Assessment, By Flavor, 2022 & 2032F |
9.3 Finland Ready-to-Drink Tea & Coffee Market Opportunity Assessment, By Packaging Type, 2022 & 2032F |
9.4 Finland Ready-to-Drink Tea & Coffee Market Opportunity Assessment, By Distribution Channel, 2022 & 2032F |
9.5 Finland Ready-to-Drink Tea & Coffee Market Opportunity Assessment, By End User, 2022 & 2032F |
10 Finland Ready-to-Drink Tea & Coffee Market - Competitive Landscape |
10.1 Finland Ready-to-Drink Tea & Coffee Market Revenue Share, By Companies, 2025 |
10.2 Finland Ready-to-Drink Tea & Coffee Market Competitive Benchmarking, By Operating and Technical Parameters |
11 Company Profiles |
12 Recommendations |
13 Disclaimer |
Export potential assessment - trade Analytics for 2030
Export potential enables firms to identify high-growth global markets with greater confidence by combining advanced trade intelligence with a structured quantitative methodology. The framework analyzes emerging demand trends and country-level import patterns while integrating macroeconomic and trade datasets such as GDP and population forecasts, bilateral import–export flows, tariff structures, elasticity differentials between developed and developing economies, geographic distance, and import demand projections. Using weighted trade values from 2020–2024 as the base period to project country-to-country export potential for 2030, these inputs are operationalized through calculated drivers such as gravity model parameters, tariff impact factors, and projected GDP per-capita growth. Through an analysis of hidden potentials, demand hotspots, and market conditions that are most favorable to success, this method enables firms to focus on target countries, maximize returns, and global expansion with data, backed by accuracy.
By factoring in the projected importer demand gap that is currently unmet and could be potential opportunity, it identifies the potential for the Exporter (Country) among 190 countries, against the general trade analysis, which identifies the biggest importer or exporter.
To discover high-growth global markets and optimize your business strategy:
Click Here
Pricing
- Single User License$ 1,995
- Department License$ 2,400
- Site License$ 3,120
- Global License$ 3,795

Search
Thought Leadership and Analyst Meet


Our Clients
Latest Reports
- China Electric Appliance Rental Market (2026-2032) | Trends, Revenue, Growth, Challenges, Size, Value, Outlook, Pricing, Strategy, Insights, Restraints, segmentation, Companies, Investment Opportunities, Analysis, Demand, Drivers, Competition, Forecast, Share
- Chile Electric Appliance Rental Market (2026-2032) | Outlook, Competition, Drivers, Strategy, Revenue, Analysis, Value, Pricing, Restraints, Size, Demand, Share, Growth, Forecast, Challenges, Insights, Investment Opportunities, Companies, Trends, segmentation
- Cambodia Electric Appliance Rental Market (2026-2032) | Companies, Analysis, Restraints, Pricing, Insights, Challenges, Outlook, Strategy, Forecast, Trends, Competition, Value, Revenue, Investment Opportunities, segmentation, Drivers, Size, Demand, Growth, Share
- Brazil Electric Appliance Rental Market (2026-2032) | Revenue, Strategy, Forecast, Companies, segmentation, Competition, Size, Investment Opportunities, Pricing, Restraints, Outlook, Challenges, Analysis, Drivers, Value, Demand, Insights, Trends, Growth, Share
- Bangladesh Electric Appliance Rental Market (2026-2032) | Drivers, Forecast, Investment Opportunities, Strategy, Insights, Demand, Challenges, Outlook, Trends, Competition, Value, Revenue, Size, Pricing, Analysis, Companies, Restraints, segmentation, Share, Growth
- Bahrain Electric Appliance Rental Market (2026-2032) | Outlook, Size, Competition, Restraints, Drivers, Value, Trends, Investment Opportunities, Insights, Forecast, Revenue, Strategy, Growth, Share, Demand, Analysis, Challenges, Companies, segmentation, Pricing
- Azerbaijan Electric Appliance Rental Market (2026-2032) | Trends, Investment Opportunities, Restraints, Insights, Strategy, Competition, Value, Growth, Demand, Drivers, Analysis, Forecast, Size, Share, Outlook, segmentation, Pricing, Challenges, Revenue, Companies
- Australia Electric Appliance Rental Market (2026-2032) | Challenges, Restraints, Forecast, Demand, Size, Competition, Pricing, Investment Opportunities, Revenue, Trends, Drivers, Growth, Outlook, Analysis, Strategy, Value, segmentation, Insights, Companies, Share
- Argentina Electric Appliance Rental Market (2026-2032) | Growth, Trends, Insights, Outlook, Forecast, Size, Drivers, Analysis, Restraints, Challenges, Share, Revenue, Investment Opportunities, Strategy, Demand, Value, Companies, segmentation, Competition, Pricing
- Algeria Electric Appliance Rental Market (2026-2032) | Share, Size, Value, Strategy, Competition, Outlook, Challenges, Companies, Trends, Pricing, Insights, Forecast, Investment Opportunities, Revenue, Growth, Restraints, segmentation, Analysis, Demand, Drivers
Industry Events and Analyst Meet

HIMTEX 2026

India Refining Summit 2026

India EV Show 2026

EV tech India Expo 2026

Auto Tech Asia 2026
Whitepaper
- Middle East & Africa Commercial Security Market Click here to view more.
- Middle East & Africa Fire Safety Systems & Equipment Market Click here to view more.
- GCC Drone Market Click here to view more.
- Middle East Lighting Fixture Market Click here to view more.
- GCC Physical & Perimeter Security Market Click here to view more.
6WResearch In News
- Doha a strategic location for EV manufacturing hub: IPA Qatar
- Demand for luxury TVs surging in the GCC, says Samsung
- Empowering Growth: The Thriving Journey of Bangladesh’s Cable Industry
- Demand for luxury TVs surging in the GCC, says Samsung
- Video call with a traditional healer? Once unthinkable, it’s now common in South Africa
- Intelligent Buildings To Smooth GCC’s Path To Net Zero