Finland Rennet Market (2025-2031) | Size, Revenue, Segmentation, Analysis, Share, Companies, Industry, Outlook, Value, Forecast, Growth & Trends
Market Forecast By Type (Animal-derived Rennet, Microbial Rennet, Fermentation Produced Chymosin Rennet, Vegetable Rennet), By Form (Liquid, Powder, Paste), By End-Users (Food & Beverages, Pharmaceuticals, Industrial, Chemicals, Others), By Sales Channel (Online, Offline) And Competitive Landscape
| Product Code: ETC5046321 | Publication Date: Nov 2023 | Updated Date: Nov 2025 | Product Type: Market Research Report | |
| Publisher: 6Wresearch | Author: Sachin Kumar Rai | No. of Pages: 60 | No. of Figures: 30 | No. of Tables: 5 |
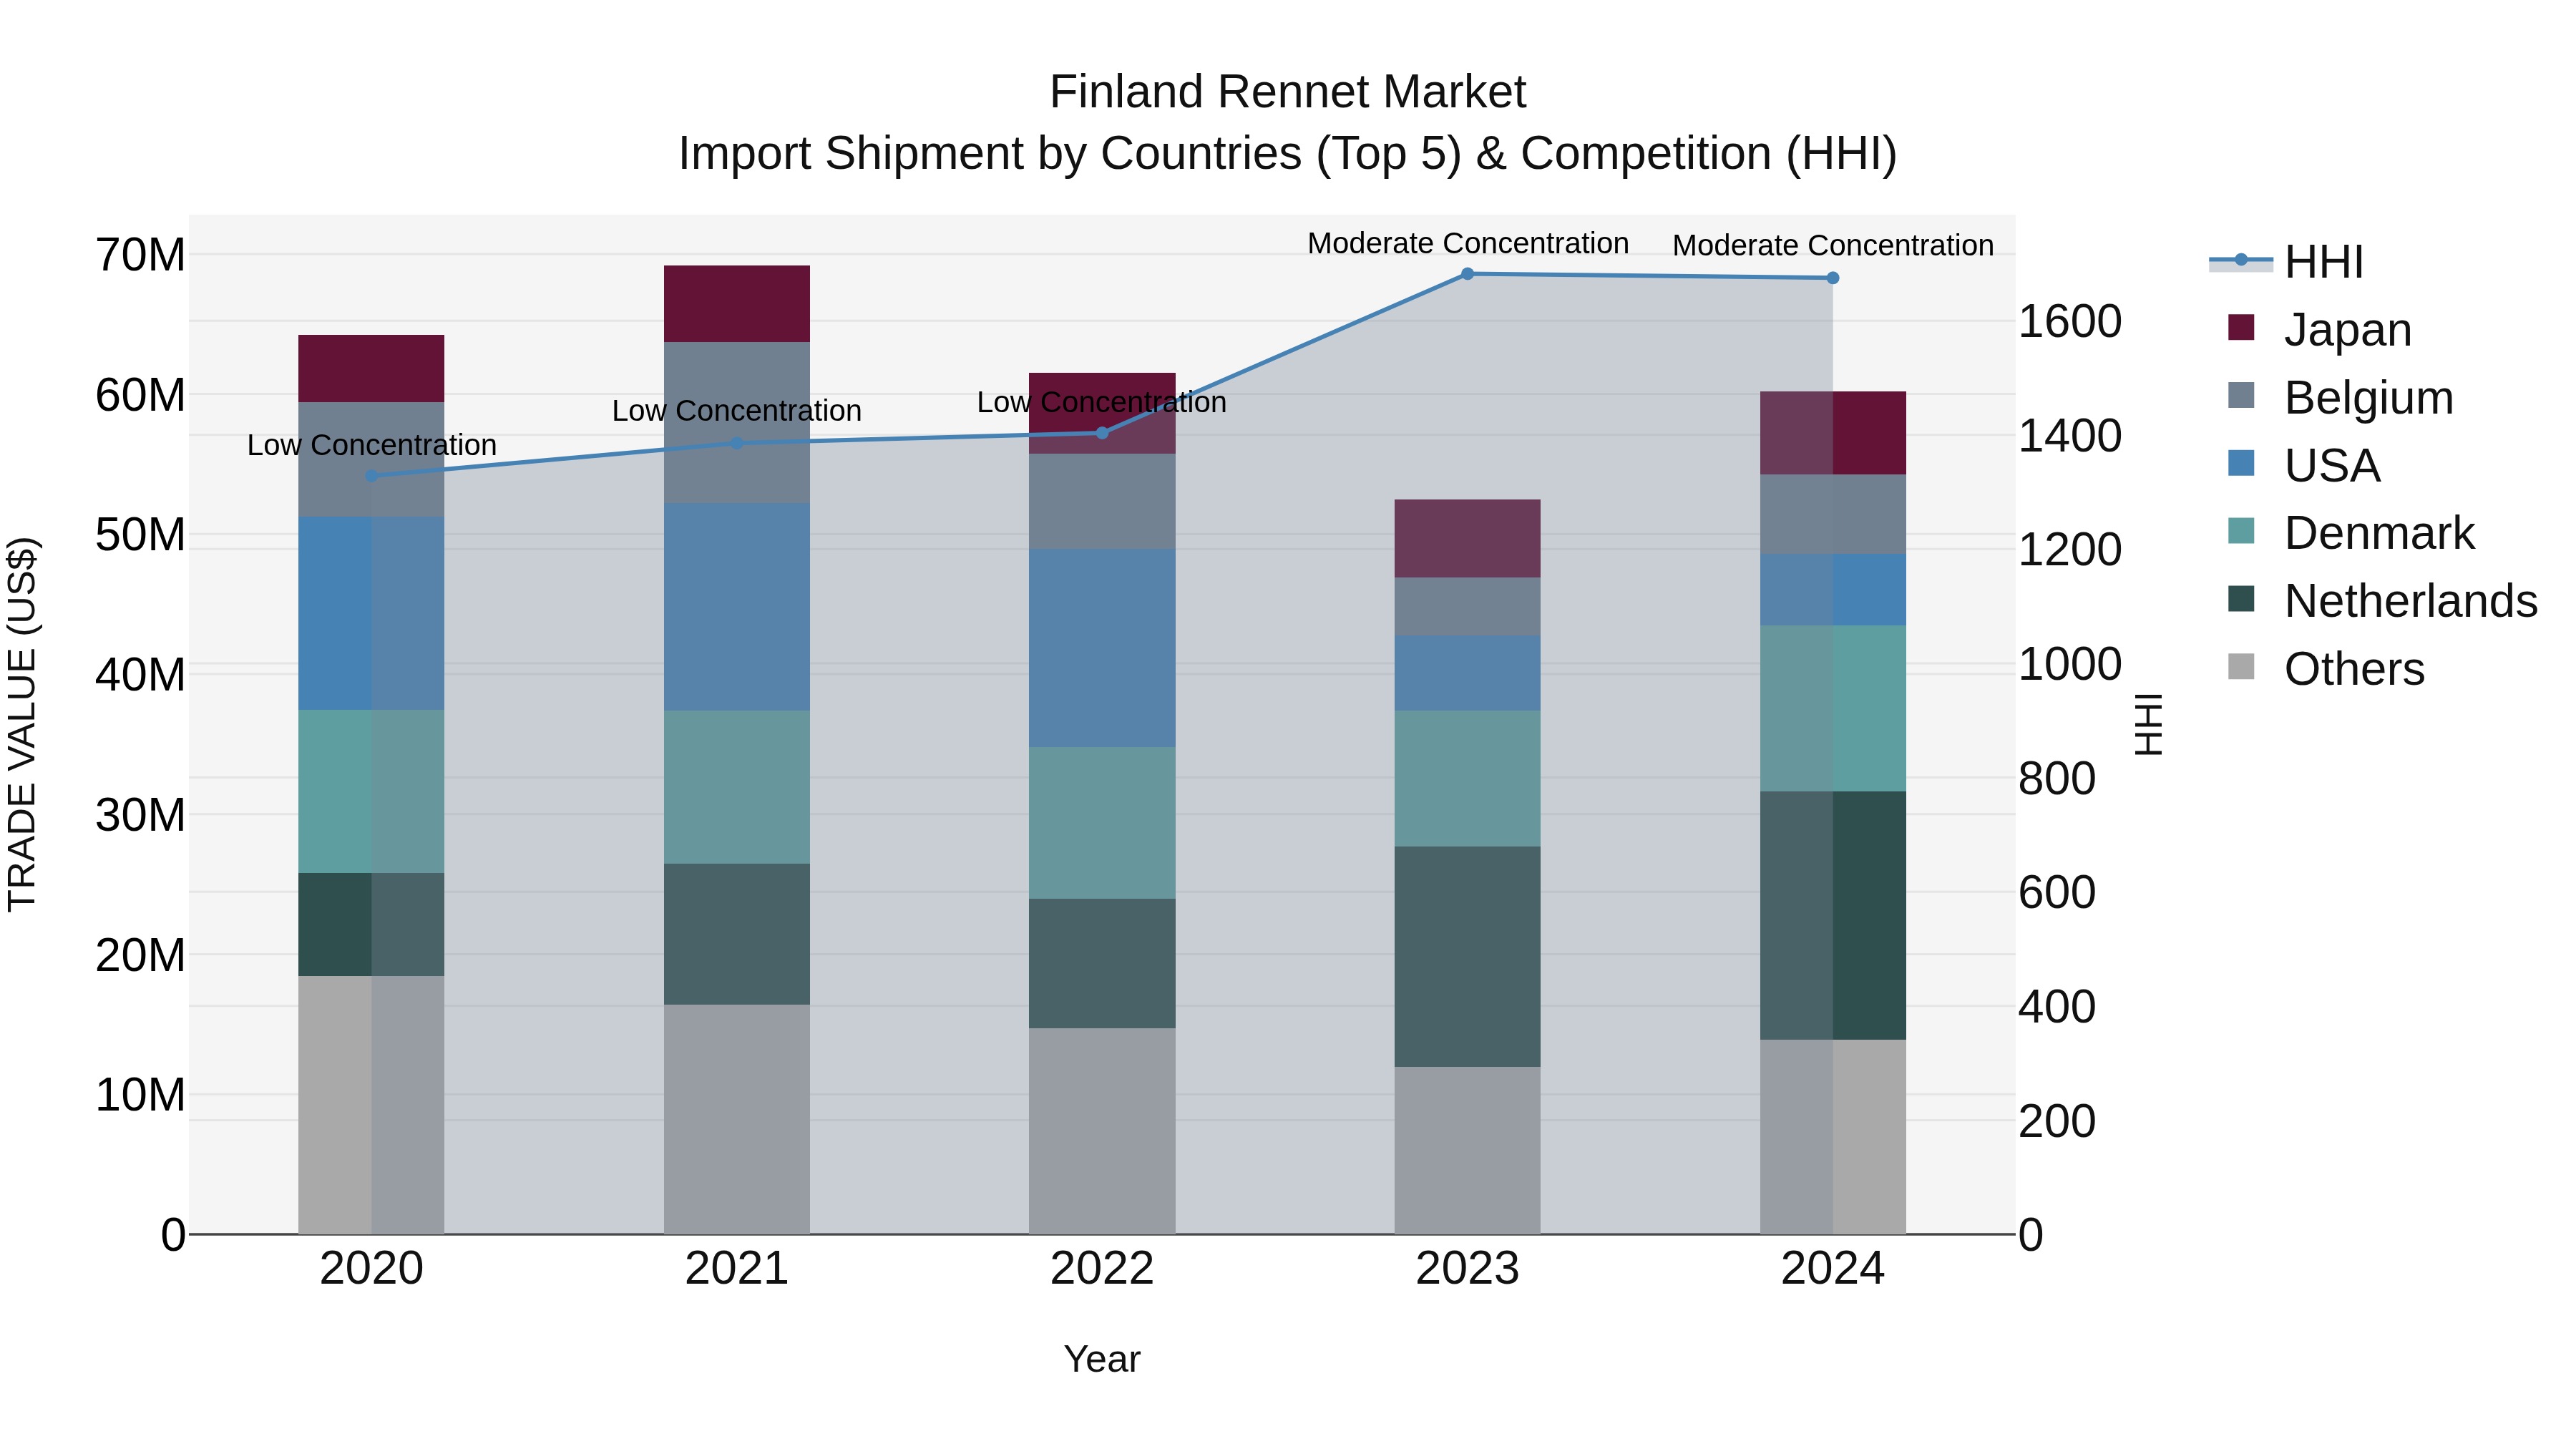
Finland Rennet Market Top 5 Importing Countries and Market Competition (HHI) Analysis
In 2024, Finland saw steady import shipments of rennet, with top exporting countries including Netherlands, Denmark, Metropolitan France, Japan, and Belgium. The market exhibited moderate concentration, as indicated by the Herfindahl-Hirschman Index (HHI). Despite a slight decline in the compound annual growth rate (CAGR) from 2020-2024, there was a notable growth spurt in 2024 with a 14.69% increase from the previous year. This suggests that the Finnish rennet import market remains dynamic and responsive to changing trends and demands.
Finland Rennet Market Overview
The rennet market in Finland is driven by the cheese-making industry, which requires rennet for curdling milk. Traditional and microbial rennet options cater to a diverse consumer base, including vegetarians. Increasing demand for specialty cheeses boosts market prospects.
Drivers of the market
The Finland rennet market is supported by the growing cheese production industry and rising demand for specialty dairy products. The trend toward natural and enzyme-based solutions enhances market prospects.
Challenges of the market
The rennet market in Finland faces challenges from the growing demand for plant-based and microbial alternatives due to the rise in vegan and vegetarian diets. Fluctuating prices of raw materials, such as calf stomach linings for traditional rennet, impact production costs. Regulatory compliance in the food industry adds to the complexity.
Government Policy of the market
The Finnish government supports the rennet market by regulating food safety and promoting sustainable enzyme production for dairy processing.
Key Highlights of the Report:
- Finland Rennet Market Outlook
- Market Size of Finland Rennet Market, 2024
- Forecast of Finland Rennet Market, 2031
- Historical Data and Forecast of Finland Rennet Revenues & Volume for the Period 2021-2031
- Finland Rennet Market Trend Evolution
- Finland Rennet Market Drivers and Challenges
- Finland Rennet Price Trends
- Finland Rennet Porter`s Five Forces
- Finland Rennet Industry Life Cycle
- Historical Data and Forecast of Finland Rennet Market Revenues & Volume By Type for the Period 2021-2031
- Historical Data and Forecast of Finland Rennet Market Revenues & Volume By Animal-derived Rennet for the Period 2021-2031
- Historical Data and Forecast of Finland Rennet Market Revenues & Volume By Microbial Rennet for the Period 2021-2031
- Historical Data and Forecast of Finland Rennet Market Revenues & Volume By Fermentation Produced Chymosin Rennet for the Period 2021-2031
- Historical Data and Forecast of Finland Rennet Market Revenues & Volume By Vegetable Rennet for the Period 2021-2031
- Historical Data and Forecast of Finland Rennet Market Revenues & Volume By Form for the Period 2021-2031
- Historical Data and Forecast of Finland Rennet Market Revenues & Volume By Liquid for the Period 2021-2031
- Historical Data and Forecast of Finland Rennet Market Revenues & Volume By Powder for the Period 2021-2031
- Historical Data and Forecast of Finland Rennet Market Revenues & Volume By Paste for the Period 2021-2031
- Historical Data and Forecast of Finland Rennet Market Revenues & Volume By End-Users for the Period 2021-2031
- Historical Data and Forecast of Finland Rennet Market Revenues & Volume By Food & Beverages for the Period 2021-2031
- Historical Data and Forecast of Finland Rennet Market Revenues & Volume By Pharmaceuticals for the Period 2021-2031
- Historical Data and Forecast of Finland Rennet Market Revenues & Volume By Industrial for the Period 2021-2031
- Historical Data and Forecast of Finland Rennet Market Revenues & Volume By Chemicals for the Period 2021-2031
- Historical Data and Forecast of Finland Rennet Market Revenues & Volume By Others for the Period 2021-2031
- Historical Data and Forecast of Finland Rennet Market Revenues & Volume By Sales Channel for the Period 2021-2031
- Historical Data and Forecast of Finland Rennet Market Revenues & Volume By Online for the Period 2021-2031
- Historical Data and Forecast of Finland Rennet Market Revenues & Volume By Offline for the Period 2021-2031
- Finland Rennet Import Export Trade Statistics
- Market Opportunity Assessment By Type
- Market Opportunity Assessment By Form
- Market Opportunity Assessment By End-Users
- Market Opportunity Assessment By Sales Channel
- Finland Rennet Top Companies Market Share
- Finland Rennet Competitive Benchmarking By Technical and Operational Parameters
- Finland Rennet Company Profiles
- Finland Rennet Key Strategic Recommendations
Frequently Asked Questions About the Market Study (FAQs):
6Wresearch actively monitors the Finland Rennet Market and publishes its comprehensive annual report, highlighting emerging trends, growth drivers, revenue analysis, and forecast outlook. Our insights help businesses to make data-backed strategic decisions with ongoing market dynamics. Our analysts track relevent industries related to the Finland Rennet Market, allowing our clients with actionable intelligence and reliable forecasts tailored to emerging regional needs.
Yes, we provide customisation as per your requirements. To learn more, feel free to contact us on sales@6wresearch.com
1 Executive Summary |
2 Introduction |
2.1 Key Highlights of the Report |
2.2 Report Description |
2.3 Market Scope & Segmentation |
2.4 Research Methodology |
2.5 Assumptions |
3 Finland Rennet Market Overview |
3.1 Finland Country Macro Economic Indicators |
3.2 Finland Rennet Market Revenues & Volume, 2021 & 2031F |
3.3 Finland Rennet Market - Industry Life Cycle |
3.4 Finland Rennet Market - Porter's Five Forces |
3.5 Finland Rennet Market Revenues & Volume Share, By Type, 2021 & 2031F |
3.6 Finland Rennet Market Revenues & Volume Share, By Form, 2021 & 2031F |
3.7 Finland Rennet Market Revenues & Volume Share, By End-Users, 2021 & 2031F |
3.8 Finland Rennet Market Revenues & Volume Share, By Sales Channel, 2021 & 2031F |
4 Finland Rennet Market Dynamics |
4.1 Impact Analysis |
4.2 Market Drivers |
4.2.1 Growing demand for specialty cheeses in Finland |
4.2.2 Increasing health consciousness leading to higher consumption of dairy products |
4.2.3 Rise in the number of artisanal and boutique cheese producers in Finland |
4.3 Market Restraints |
4.3.1 Fluctuations in milk prices affecting production costs |
4.3.2 Regulatory challenges related to food safety and quality standards |
4.3.3 Limited availability of skilled labor in the dairy industry |
5 Finland Rennet Market Trends |
6 Finland Rennet Market Segmentations |
6.1 Finland Rennet Market, By Type |
6.1.1 Overview and Analysis |
6.1.2 Finland Rennet Market Revenues & Volume, By Animal-derived Rennet, 2021-2031F |
6.1.3 Finland Rennet Market Revenues & Volume, By Microbial Rennet, 2021-2031F |
6.1.4 Finland Rennet Market Revenues & Volume, By Fermentation Produced Chymosin Rennet, 2021-2031F | 6.1.6 Finland Rennet Market Revenues & Volume, By Vegetable Rennet, 2021-2031F |
6.2 Finland Rennet Market, By Form |
6.2.1 Overview and Analysis |
6.2.2 Finland Rennet Market Revenues & Volume, By Liquid, 2021-2031F |
6.2.3 Finland Rennet Market Revenues & Volume, By Powder, 2021-2031F |
6.2.4 Finland Rennet Market Revenues & Volume, By Paste, 2021-2031F |
6.3 Finland Rennet Market, By End-Users |
6.3.1 Overview and Analysis |
6.3.2 Finland Rennet Market Revenues & Volume, By Food & Beverages, 2021-2031F |
6.3.3 Finland Rennet Market Revenues & Volume, By Pharmaceuticals, 2021-2031F |
6.3.4 Finland Rennet Market Revenues & Volume, By Industrial, 2021-2031F |
6.3.5 Finland Rennet Market Revenues & Volume, By Chemicals, 2021-2031F |
6.3.6 Finland Rennet Market Revenues & Volume, By Others, 2021-2031F |
6.4 Finland Rennet Market, By Sales Channel |
6.4.1 Overview and Analysis |
6.4.2 Finland Rennet Market Revenues & Volume, By Online, 2021-2031F |
6.4.3 Finland Rennet Market Revenues & Volume, By Offline, 2021-2031F |
7 Finland Rennet Market Import-Export Trade Statistics |
7.1 Finland Rennet Market Export to Major Countries |
7.2 Finland Rennet Market Imports from Major Countries |
8 Finland Rennet Market Key Performance Indicators |
8.1 Average selling price of specialty cheeses in Finland |
8.2 Number of new product launches in the rennet market |
8.3 Percentage of dairy farms using rennet from sustainable and ethical sources |
9 Finland Rennet Market - Opportunity Assessment |
9.1 Finland Rennet Market Opportunity Assessment, By Type, 2021 & 2031F |
9.2 Finland Rennet Market Opportunity Assessment, By Form, 2021 & 2031F |
9.3 Finland Rennet Market Opportunity Assessment, By End-Users, 2021 & 2031F |
9.4 Finland Rennet Market Opportunity Assessment, By Sales Channel, 2021 & 2031F |
10 Finland Rennet Market - Competitive Landscape |
10.1 Finland Rennet Market Revenue Share, By Companies, 2024 |
10.2 Finland Rennet Market Competitive Benchmarking, By Operating and Technical Parameters |
11 Company Profiles |
12 Recommendations | 13 Disclaimer |
Export potential assessment - trade Analytics for 2030
Export potential enables firms to identify high-growth global markets with greater confidence by combining advanced trade intelligence with a structured quantitative methodology. The framework analyzes emerging demand trends and country-level import patterns while integrating macroeconomic and trade datasets such as GDP and population forecasts, bilateral import–export flows, tariff structures, elasticity differentials between developed and developing economies, geographic distance, and import demand projections. Using weighted trade values from 2020–2024 as the base period to project country-to-country export potential for 2030, these inputs are operationalized through calculated drivers such as gravity model parameters, tariff impact factors, and projected GDP per-capita growth. Through an analysis of hidden potentials, demand hotspots, and market conditions that are most favorable to success, this method enables firms to focus on target countries, maximize returns, and global expansion with data, backed by accuracy.
By factoring in the projected importer demand gap that is currently unmet and could be potential opportunity, it identifies the potential for the Exporter (Country) among 190 countries, against the general trade analysis, which identifies the biggest importer or exporter.
To discover high-growth global markets and optimize your business strategy:
Click Here
Pricing
- Single User License$ 1,995
- Department License$ 2,400
- Site License$ 3,120
- Global License$ 3,795

Thought Leadership
Search
Thought Leadership and Analyst Meet


Our Clients
Latest Reports
- New Zealand Aseptic Manufacturing Market (2026-2032)
- Netherlands Aseptic Manufacturing Market (2026-2032)
- Nauru Aseptic Manufacturing Market (2026-2032)
- Namibia Aseptic Manufacturing Market (2026-2032)
- Mozambique Aseptic Manufacturing Market (2026-2032)
- Montenegro Aseptic Manufacturing Market (2026-2032)
- Mongolia Aseptic Manufacturing Market (2026-2032)
- Monaco Aseptic Manufacturing Market (2026-2032)
- Micronesia Aseptic Manufacturing Market (2026-2032)
- Mauritius Aseptic Manufacturing Market (2026-2032)
Industry Events and Analyst Meet

HIMTEX 2026

India Refining Summit 2026

India EV Show 2026

EV tech India Expo 2026

Auto Tech Asia 2026
Whitepaper
- Middle East & Africa Commercial Security Market Click here to view more.
- Middle East & Africa Fire Safety Systems & Equipment Market Click here to view more.
- GCC Drone Market Click here to view more.
- Middle East Lighting Fixture Market Click here to view more.
- GCC Physical & Perimeter Security Market Click here to view more.
6WResearch In News
- Doha a strategic location for EV manufacturing hub: IPA Qatar
- Demand for luxury TVs surging in the GCC, says Samsung
- Empowering Growth: The Thriving Journey of Bangladesh’s Cable Industry
- Demand for luxury TVs surging in the GCC, says Samsung
- Video call with a traditional healer? Once unthinkable, it’s now common in South Africa
- Intelligent Buildings To Smooth GCC’s Path To Net Zero