Finland Syrup Market (2026-2032) | Analysis, Size, Trends, Value, Forecast, Companies, Outlook, Segmentation, Revenue, Share, Industry & Growth
Market Forecast By Type (Chocolate syrup, Maple syrup, High fructose corn syrup, Malt syrup, Tapioca syrup, Honey, Fruit syrup, Others), By Distribution Channel (Supermarket and Hypermarket, Convenience Store, Online Retail Stores, Other Distribution Channels) And Competitive Landscape
| Product Code: ETC4723663 | Publication Date: Nov 2023 | Updated Date: Apr 2026 | Product Type: Market Research Report | |
| Publisher: 6Wresearch | Author: Shubham Padhi | No. of Pages: 60 | No. of Figures: 30 | No. of Tables: 5 |
Finland Syrup Market Size (2020-2030)
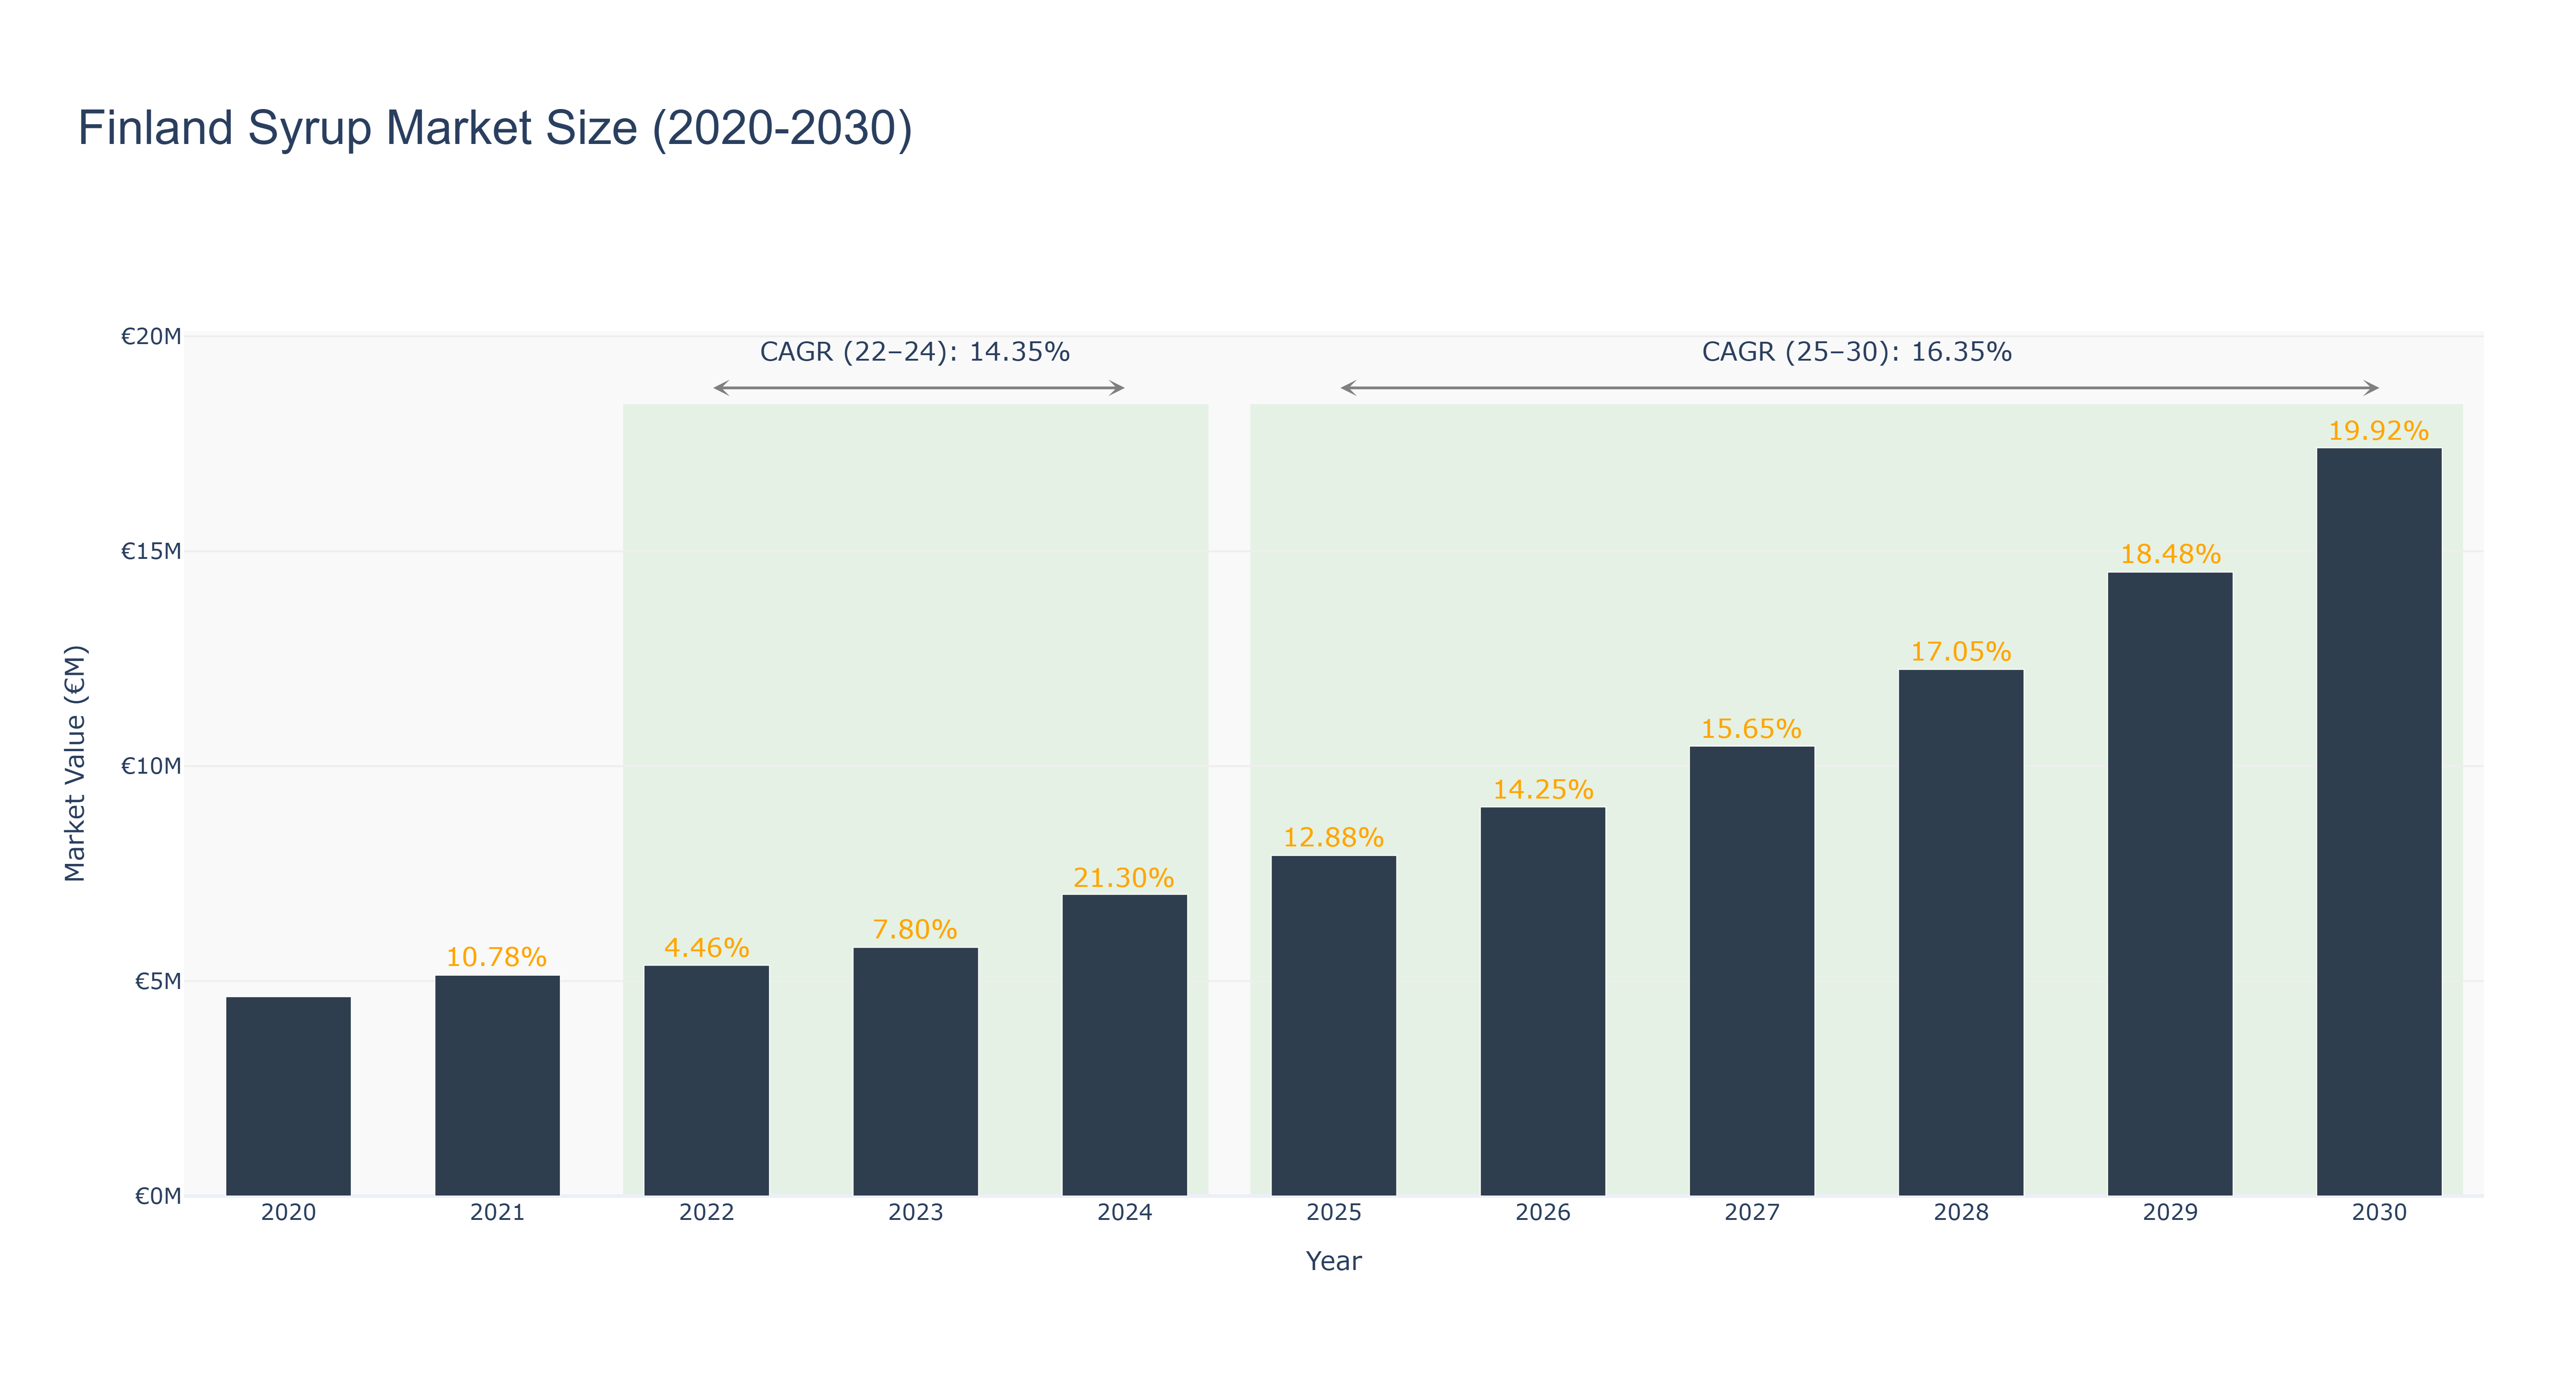
Finland Syrup Market has shown a consistent growth trajectory over the years. The market size peaked at €17.41 million in 2030, with a notable increase in size from €4.64 million in 2020. The CAGR from 2022 to 2024 stood at 14.35%, while the CAGR from 2025 to 2030 is projected at 16.35%. The market witnessed significant growth due to increased consumer demand for natural and flavored syrups, as well as the introduction of innovative product variations. Looking ahead, the Finland Syrup Market is expected to continue its upward trend, driven by evolving consumer preferences and expanding distribution channels. Recent developments indicate a focus on sustainable packaging and the introduction of new organic syrup variants, aligning with the market's growing emphasis on health and environmental sustainability.
Finland Syrup Market: Production & Trade Performance (2019-2025)
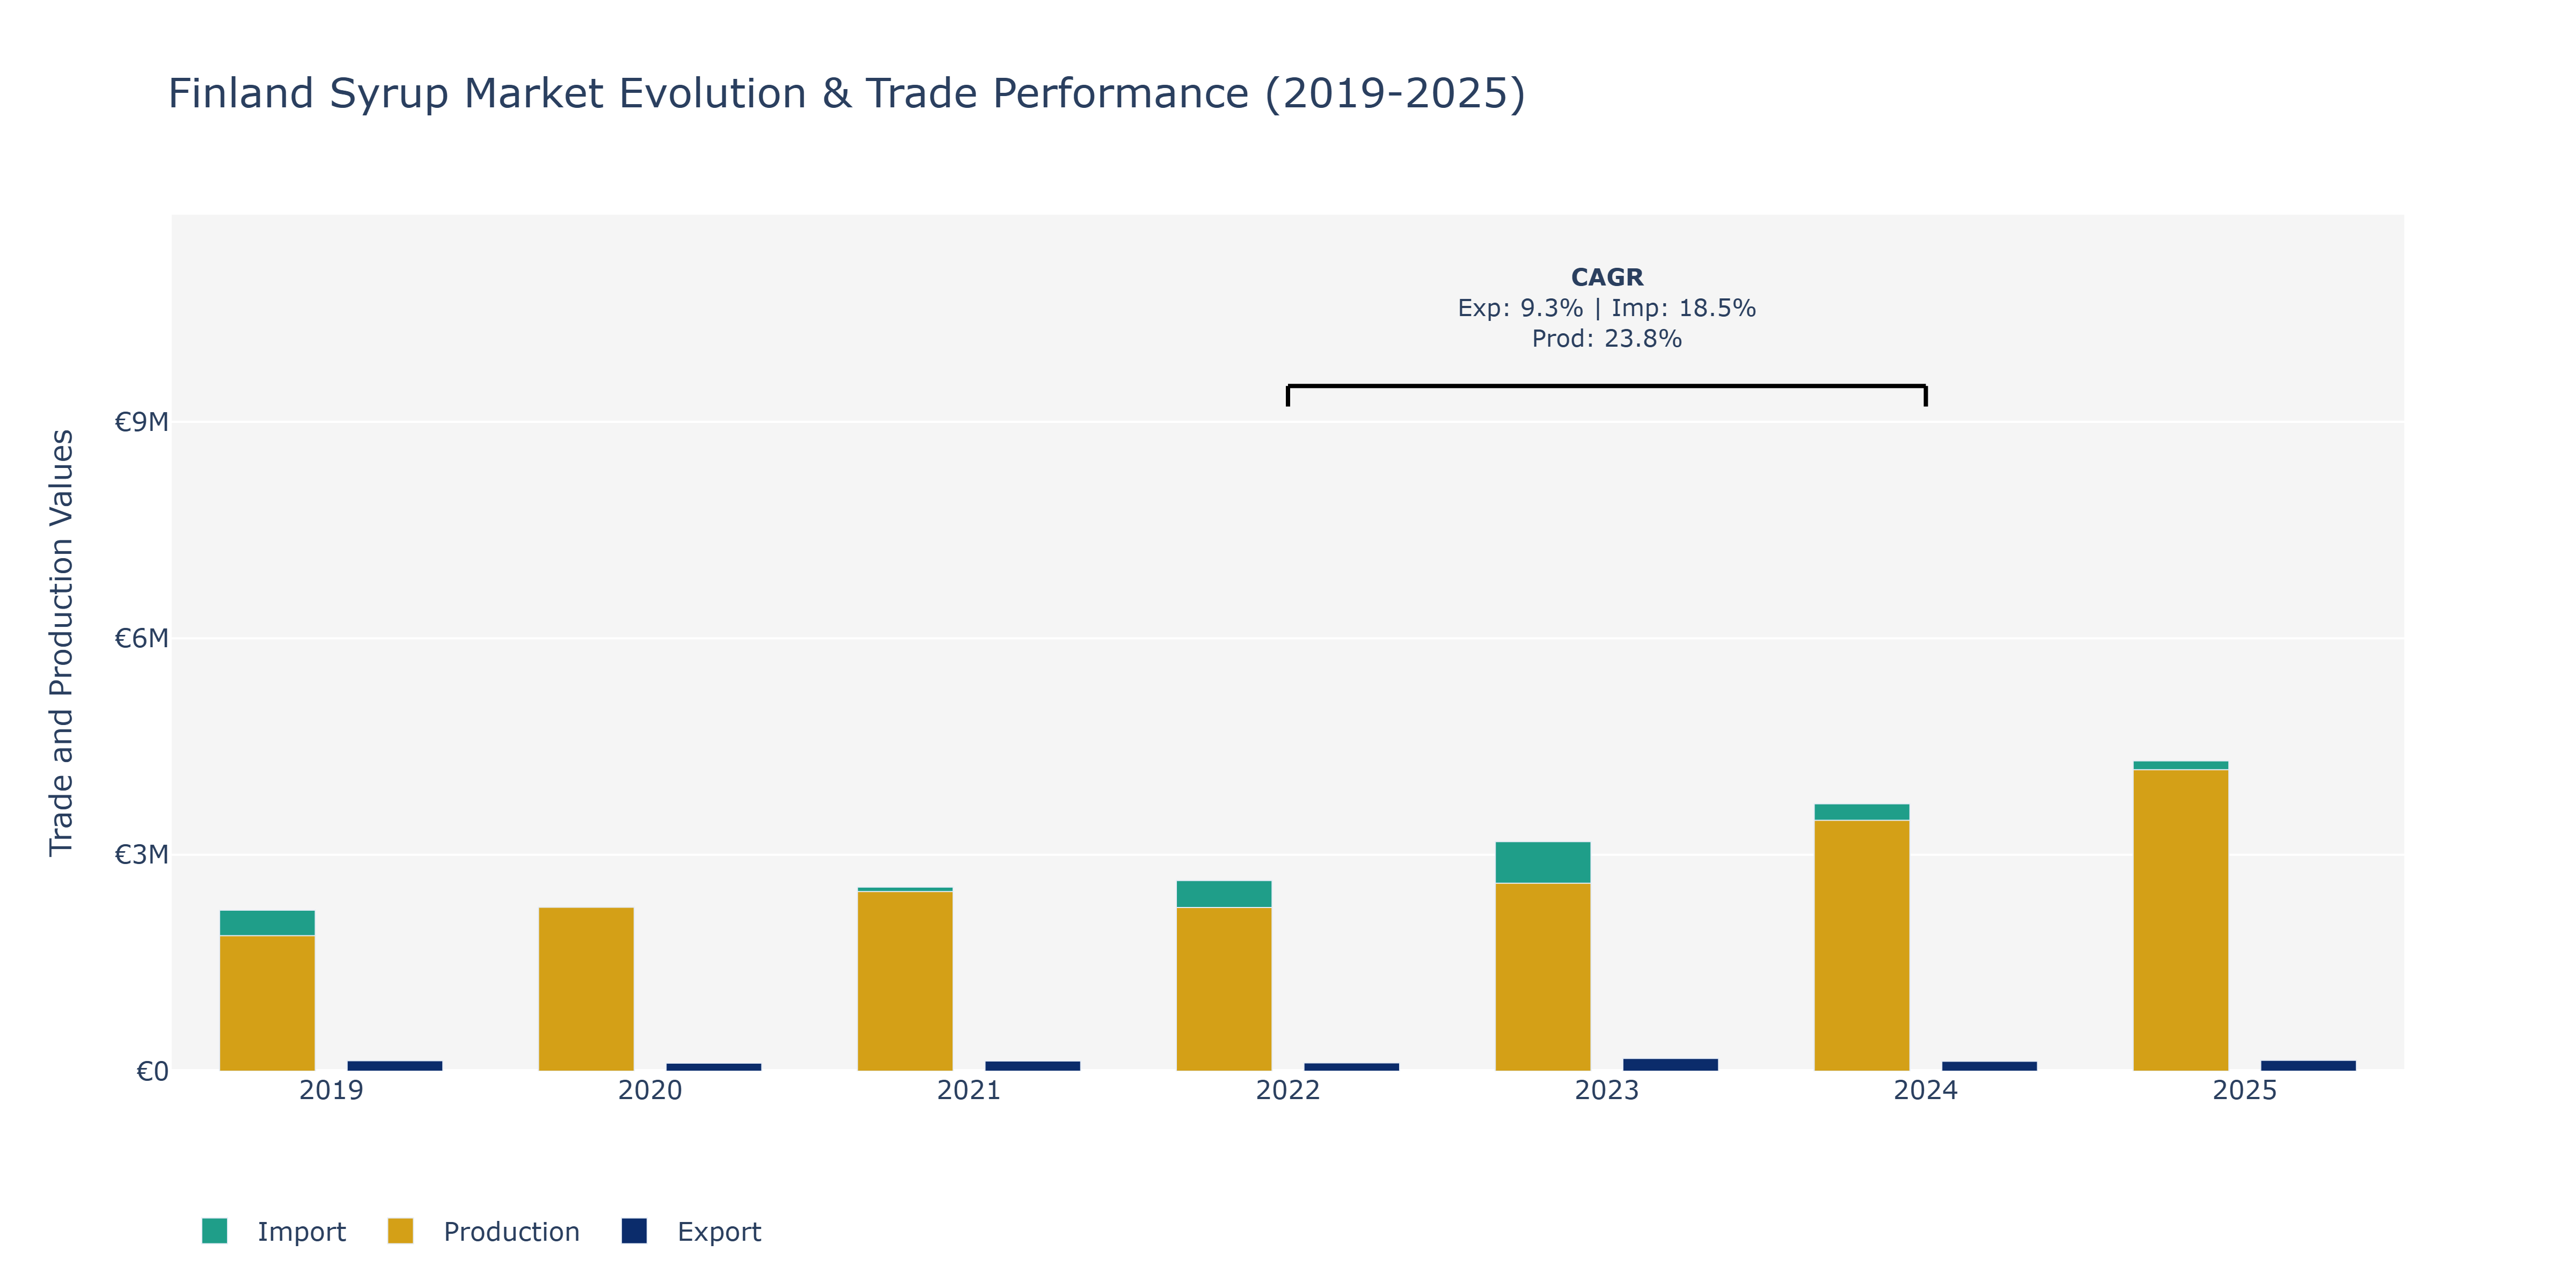
In the Finland Syrup Market, from 2019 to 2025, both exports and production showcased fluctuating trends. Exports started at €145.34 thousand in 2019, decreased to €112.43 thousand in 2020, then peaked at €175.81 thousand in 2023 before stabilizing at €149.98 thousand in 2025. Meanwhile, Production value rose steadily from €1.88 billion in 2019 to €4.18 billion in 2025, demonstrating a consistent upward trajectory. Imports, on the other hand, displayed a continuous growth pattern, increasing from €2.23 million in 2019 to €4.3 million in 2025. The fluctuations in exports could be attributed to variations in demand, consumer preferences, and global economic conditions impacting trade flows. The steady increase in production may indicate industry expansion, technological advancements, or increased efficiency in manufacturing processes. The growth in imports suggests a growing market with a demand for a wider variety of syrup products, possibly influenced by changing consumer tastes and preferences or an expanding foodservice industry in Finland. These trends align with the evolving consumer behavior towards healthier and more diverse food and beverage options, emphasizing the importance of product innovation and market competitiveness in the syrup industry.
Key Highlights of the Report:
- Finland Syrup Market Outlook
- Market Size of Finland Syrup Market, 2025
- Forecast of Finland Syrup Market, 2032
- Historical Data and Forecast of Finland Syrup Revenues & Volume for the Period 2022 - 2032F
- Finland Syrup Market Trend Evolution
- Finland Syrup Market Drivers and Challenges
- Finland Syrup Price Trends
- Finland Syrup Porter`s Five Forces
- Finland Syrup Industry Life Cycle
- Historical Data and Forecast of Finland Syrup Market Revenues & Volume By Type for the Period 2022 - 2032F
- Historical Data and Forecast of Finland Syrup Market Revenues & Volume By Chocolate syrup for the Period 2022 - 2032F
- Historical Data and Forecast of Finland Syrup Market Revenues & Volume By Maple syrup for the Period 2022 - 2032F
- Historical Data and Forecast of Finland Syrup Market Revenues & Volume By High fructose corn syrup for the Period 2022 - 2032F
- Historical Data and Forecast of Finland Syrup Market Revenues & Volume By Malt syrup for the Period 2022 - 2032F
- Historical Data and Forecast of Finland Syrup Market Revenues & Volume By Tapioca syrup for the Period 2022 - 2032F
- Historical Data and Forecast of Finland Syrup Market Revenues & Volume By Honey for the Period 2022 - 2032F
- Historical Data and Forecast of Finland Syrup Market Revenues & Volume By Fruit syrup for the Period 2022 - 2032F
- Historical Data and Forecast of Finland Chocolate syrup Syrup Market Revenues & Volume By Others for the Period 2022 - 2032F
- Historical Data and Forecast of Finland Syrup Market Revenues & Volume By Distribution Channel for the Period 2022 - 2032F
- Historical Data and Forecast of Finland Syrup Market Revenues & Volume By Supermarket and Hypermarket for the Period 2022 - 2032F
- Historical Data and Forecast of Finland Syrup Market Revenues & Volume By Convenience Store for the Period 2022 - 2032F
- Historical Data and Forecast of Finland Syrup Market Revenues & Volume By Online Retail Stores for the Period 2022 - 2032F
- Historical Data and Forecast of Finland Syrup Market Revenues & Volume By Other Distribution Channels for the Period 2022 - 2032F
- Finland Syrup Import Export Trade Statistics
- Market Opportunity Assessment By Type
- Market Opportunity Assessment By Distribution Channel
- Finland Syrup Top Companies Market Share
- Finland Syrup Competitive Benchmarking By Technical and Operational Parameters
- Finland Syrup Company Profiles
- Finland Syrup Key Strategic Recommendations
Frequently Asked Questions About the Market Study (FAQs):
6Wresearch actively monitors the Finland Syrup Market and publishes its comprehensive annual report, highlighting emerging trends, growth drivers, revenue analysis, and forecast outlook. Our insights help businesses to make data-backed strategic decisions with ongoing market dynamics. Our analysts track relevent industries related to the Finland Syrup Market, allowing our clients with actionable intelligence and reliable forecasts tailored to emerging regional needs.
Yes, we provide customisation as per your requirements. To learn more, feel free to contact us on sales@6wresearch.com
1 Executive Summary |
2 Introduction |
2.1 Key Highlights of the Report |
2.2 Report Description |
2.3 Market Scope & Segmentation |
2.4 Research Methodology |
2.5 Assumptions |
3 Finland Syrup Market Overview |
3.1 Finland Country Macro Economic Indicators |
3.2 Finland Syrup Market Revenues & Volume, 2022 & 2032F |
3.3 Finland Syrup Market - Industry Life Cycle |
3.4 Finland Syrup Market - Porter's Five Forces |
3.5 Finland Syrup Market Revenues & Volume Share, By Type, 2022 & 2032F |
3.6 Finland Syrup Market Revenues & Volume Share, By Distribution Channel, 2022 & 2032F |
4 Finland Syrup Market Dynamics |
4.1 Impact Analysis |
4.2 Market Drivers |
4.2.1 Increasing consumer awareness about health benefits of natural sweeteners |
4.2.2 Growing demand for flavored syrups in food and beverage industry |
4.2.3 Rising trend of using syrups in cocktails and mocktails |
4.3 Market Restraints |
4.3.1 Fluctuating prices of raw materials such as sugar and fruits |
4.3.2 Stringent regulations on food additives and sweeteners |
4.3.3 Competition from alternative sweeteners like stevia and monk fruit |
5 Finland Syrup Market Trends |
6 Finland Syrup Market Segmentations |
6.1 Finland Syrup Market, By Type |
6.1.1 Overview and Analysis |
6.1.2 Finland Syrup Market Revenues & Volume, By Chocolate syrup, 2022 - 2032F |
6.1.3 Finland Syrup Market Revenues & Volume, By Maple syrup, 2022 - 2032F |
6.1.4 Finland Syrup Market Revenues & Volume, By High fructose corn syrup, 2022 - 2032F |
6.1.5 Finland Syrup Market Revenues & Volume, By Malt syrup, 2022 - 2032F |
6.1.6 Finland Syrup Market Revenues & Volume, By Tapioca syrup, 2022 - 2032F |
6.1.7 Finland Syrup Market Revenues & Volume, By Honey, 2022 - 2032F |
6.1.9 Finland Syrup Market Revenues & Volume, By Others, 2022 - 2032F |
6.1.10 Finland Syrup Market Revenues & Volume, By Others, 2022 - 2032F |
6.2 Finland Syrup Market, By Distribution Channel |
6.2.1 Overview and Analysis |
6.2.2 Finland Syrup Market Revenues & Volume, By Supermarket and Hypermarket, 2022 - 2032F |
6.2.3 Finland Syrup Market Revenues & Volume, By Convenience Store, 2022 - 2032F |
6.2.4 Finland Syrup Market Revenues & Volume, By Online Retail Stores, 2022 - 2032F |
6.2.5 Finland Syrup Market Revenues & Volume, By Other Distribution Channels, 2022 - 2032F |
7 Finland Syrup Market Import-Export Trade Statistics |
7.1 Finland Syrup Market Export to Major Countries |
7.2 Finland Syrup Market Imports from Major Countries |
8 Finland Syrup Market Key Performance Indicators |
8.1 Consumer engagement on social media platforms promoting syrup recipes |
8.2 Number of new product launches in the syrup market |
8.3 Growth in the number of specialty stores and cafes offering syrup-based beverages |
8.4 Increase in online searches for syrup-related recipes and cocktails |
8.5 Adoption rate of syrups in home cooking and baking trends |
9 Finland Syrup Market - Opportunity Assessment |
9.1 Finland Syrup Market Opportunity Assessment, By Type, 2022 & 2032F |
9.2 Finland Syrup Market Opportunity Assessment, By Distribution Channel, 2022 & 2032F |
10 Finland Syrup Market - Competitive Landscape |
10.1 Finland Syrup Market Revenue Share, By Companies, 2025 |
10.2 Finland Syrup Market Competitive Benchmarking, By Operating and Technical Parameters |
11 Company Profiles |
12 Recommendations | 13 Disclaimer |
Global Go To Market Strategy - 2030
Export potential enables firms to identify high-growth global markets with greater confidence by combining advanced trade intelligence with a structured quantitative methodology. The framework analyzes emerging demand trends and country-level import patterns while integrating macroeconomic and trade datasets such as GDP and population forecasts, bilateral import–export flows, tariff structures, elasticity differentials between developed and developing economies, geographic distance, and import demand projections. Using weighted trade values from 2020–2024 as the base period to project country-to-country export potential for 2030, these inputs are operationalized through calculated drivers such as gravity model parameters, tariff impact factors, and projected GDP per-capita growth. Through an analysis of hidden potentials, demand hotspots, and market conditions that are most favorable to success, this method enables firms to focus on target countries, maximize returns, and global expansion with data, backed by accuracy.
By factoring in the projected importer demand gap that is currently unmet and could be potential opportunity, it identifies the potential for the Exporter (Country) among 190 countries, against the general trade analysis, which identifies the biggest importer or exporter.
To discover high-growth global markets and optimize your business strategy:
Click Here
Pricing
- Single User License$ 1,995
- Department License$ 2,400
- Site License$ 3,120
- Global License$ 3,795

Leadership Perspectives from Industry Events
Search
Thought Leadership and Analyst Meet


Our Clients
6WResearch In News
- India Export Attractiveness Tracker 2026
- India Air Conditioner Market Set for Strong Rebound in 2026 After Weather-Led Correction and GST-Driven Recovery: 6Wresearch
- ADAS in India: How Automatic Emergency Braking, Blind Spot Detection & Driver Monitoring are Transforming Road Safety
- Doha a strategic location for EV manufacturing hub: IPA Qatar
- Demand for luxury TVs surging in the GCC, says Samsung
- Empowering Growth: The Thriving Journey of Bangladesh’s Cable Industry
Latest Reports
- Nicaragua RPG Gaming Market (2026-2032)
- New Zealand RPG Gaming Market (2026-2032)
- Netherlands RPG Gaming Market (2026-2032)
- Nauru RPG Gaming Market (2026-2032)
- Namibia RPG Gaming Market (2026-2032)
- Mozambique RPG Gaming Market (2026-2032)
- Montenegro RPG Gaming Market (2026-2032)
- Mongolia RPG Gaming Market (2026-2032)
- Monaco RPG Gaming Market (2026-2032)
- Micronesia RPG Gaming Market (2026-2032)
Industry Events and Analyst Meet

EV India Expo 2026

HIMTEX 2026

India Refining Summit 2026

India EV Show 2026

EV tech India Expo 2026
Whitepaper
- Middle East & Africa Commercial Security Market Click here to view more.
- Middle East & Africa Fire Safety Systems & Equipment Market Click here to view more.
- GCC Drone Market Click here to view more.
- Middle East Lighting Fixture Market Click here to view more.
- GCC Physical & Perimeter Security Market Click here to view more.