Finland Tinned Copper Bar Market (2025-2031) | Size, Outlook, Growth, Forecast, Share, Companies, Industry, Revenue, Trends, Analysis, Value & Segmentation
Market Forecast By Type (Full Round, Slightly Round Edge, Square), By Application (Electrical Conductor, Induction Motors, Earthing, Lightning Protection, General Engineering, Switch Gears, Others) And Competitive Landscape
| Product Code: ETC5148864 | Publication Date: Nov 2023 | Updated Date: Apr 2026 | Product Type: Market Research Report | |
| Publisher: 6Wresearch | Author: Shubham Padhi | No. of Pages: 60 | No. of Figures: 30 | No. of Tables: 5 |
Finland Tinned Copper Bar Market Size (2020-2030)
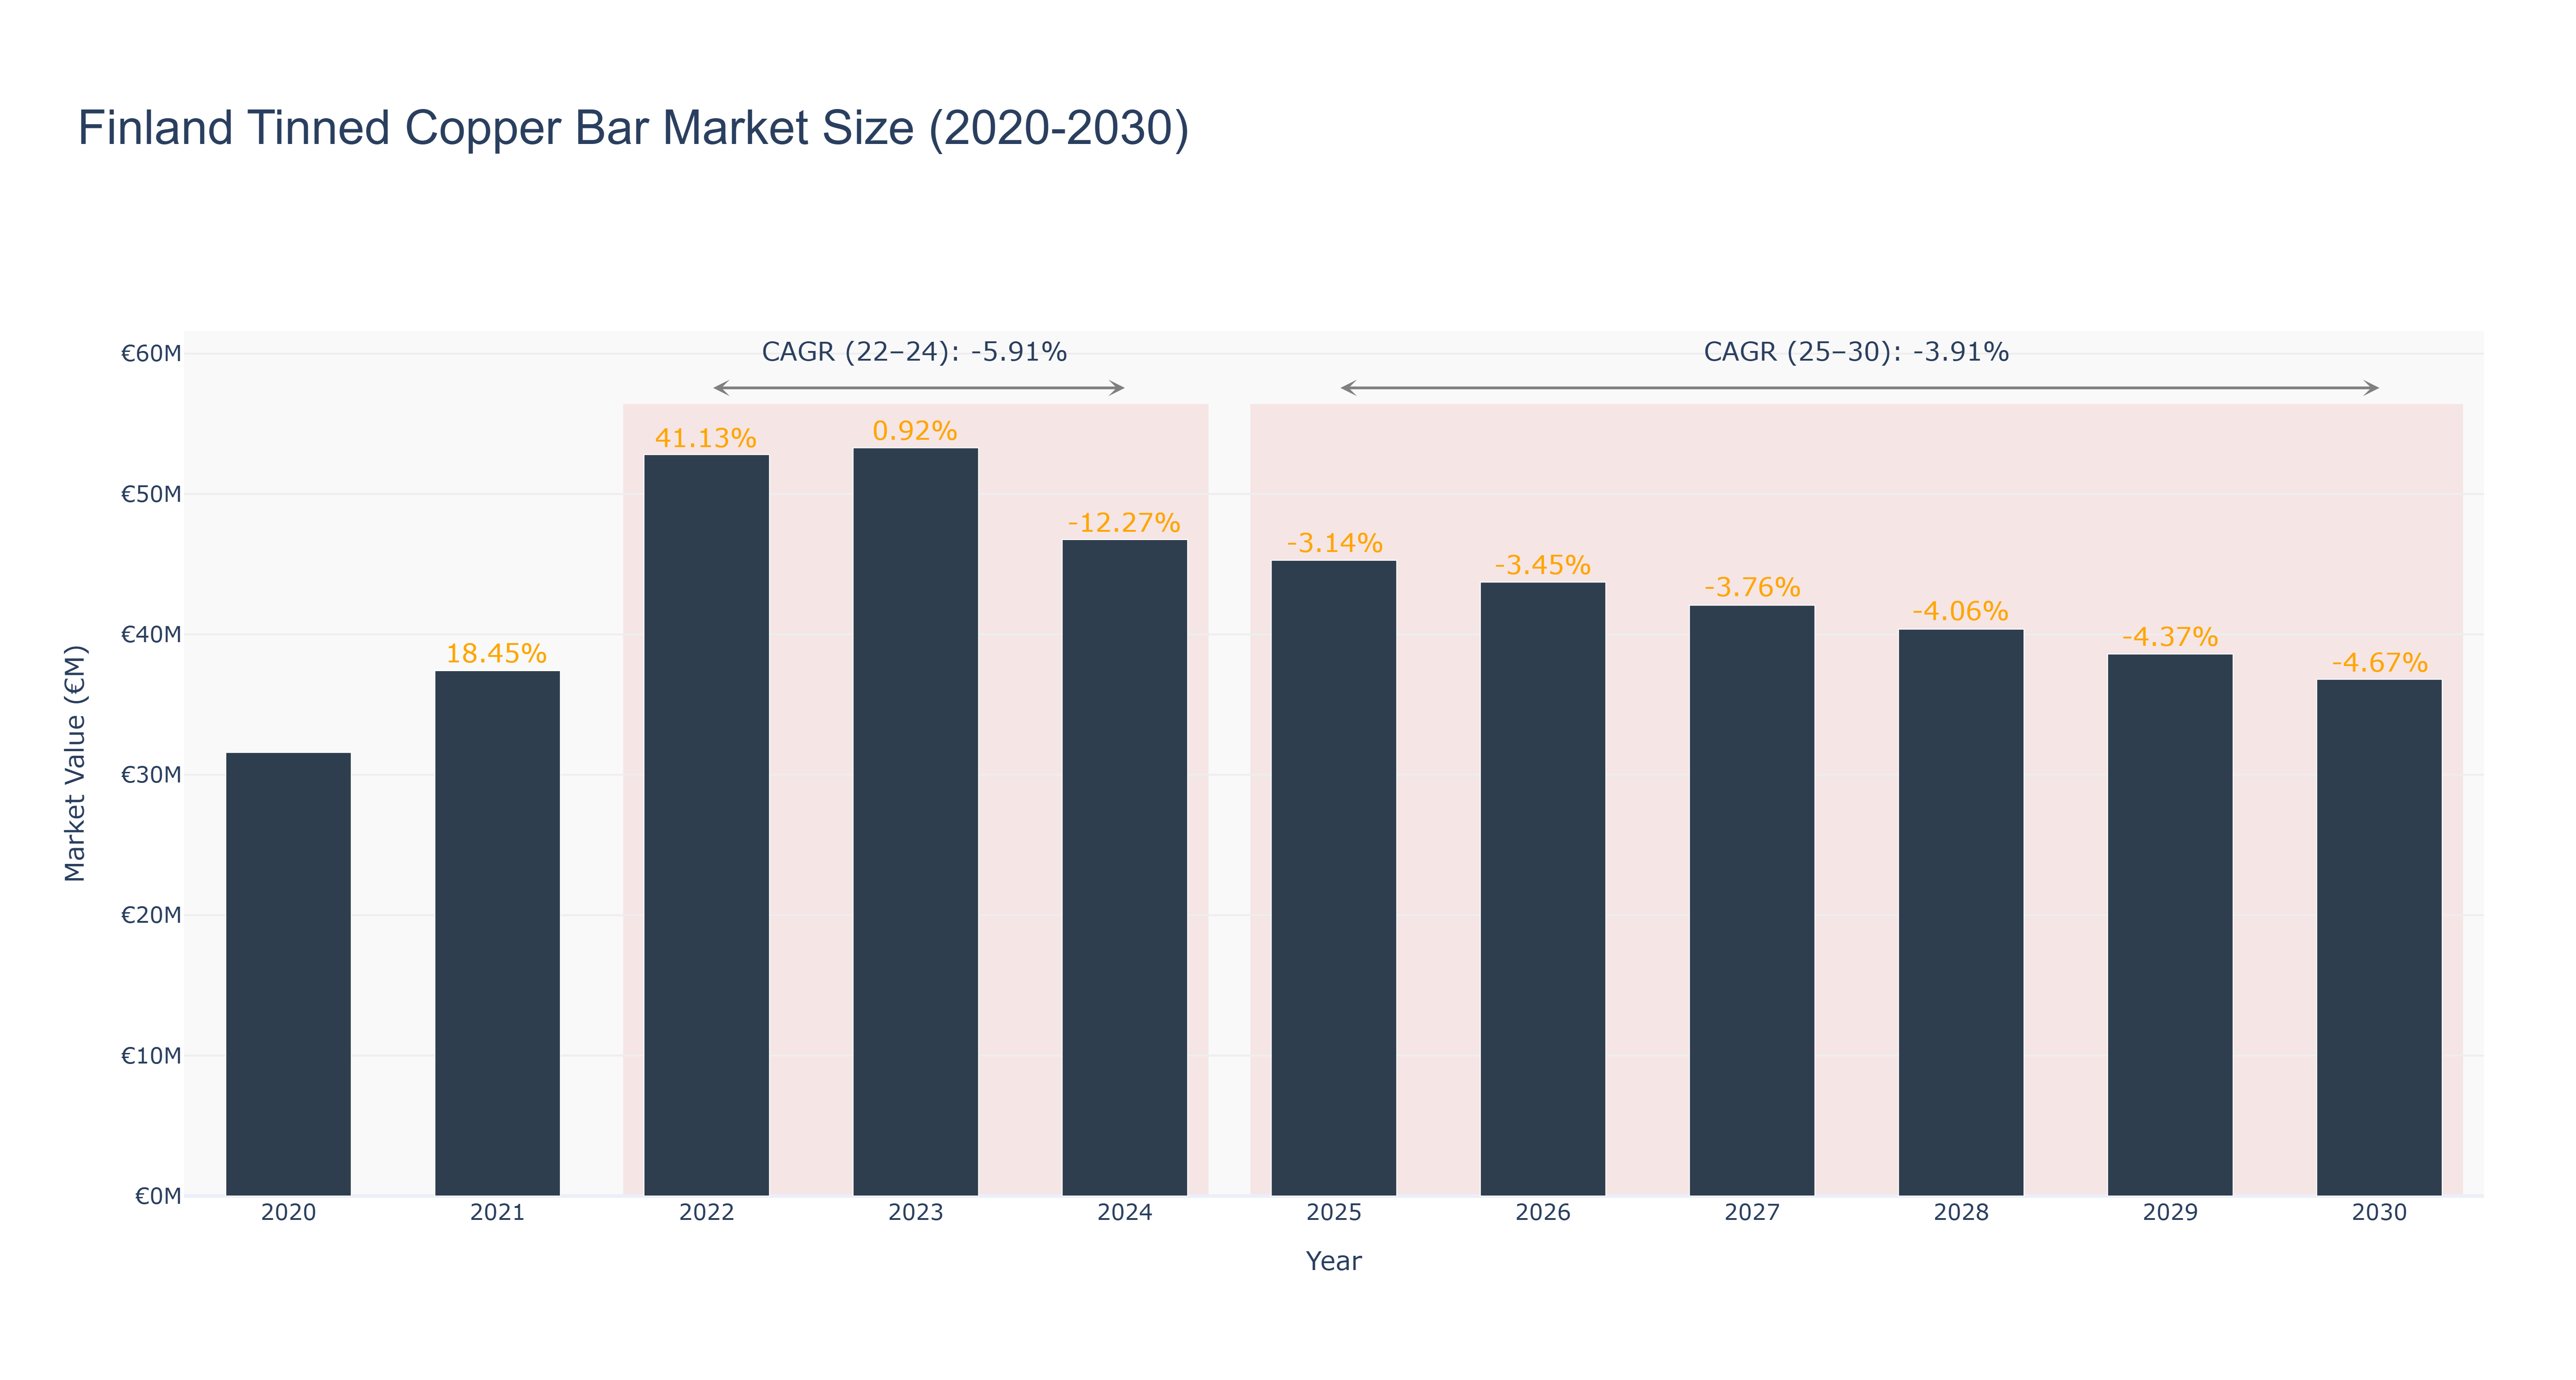
The Finland Tinned Copper Bar Market reached its peak in 2022 with a market size of €52.81 million, reflecting a substantial growth rate of 41.13% from the previous year. However, the market faced a downturn in 2023, with only a marginal growth of 0.92%, followed by a significant decline to €46.75 million in 2024, resulting in a negative growth rate of -12.27%. Looking ahead, the forecast for 2025-2030 indicates a continued contraction, with projected market sizes decreasing from €45.28 million in 2025 to €36.80 million by 2030, translating to a CAGR of -3.91%. This decline can be attributed to various factors, including fluctuating demand from key industries, potential shifts towards alternative materials, and broader economic uncertainties. While specific upcoming projects in Finland may not be extensively documented, macroeconomic trends and global supply chain dynamics will play crucial roles in shaping the market's trajectory.
Finland Tinned Copper Bar Market: Production & Trade Performance (2019-2025)
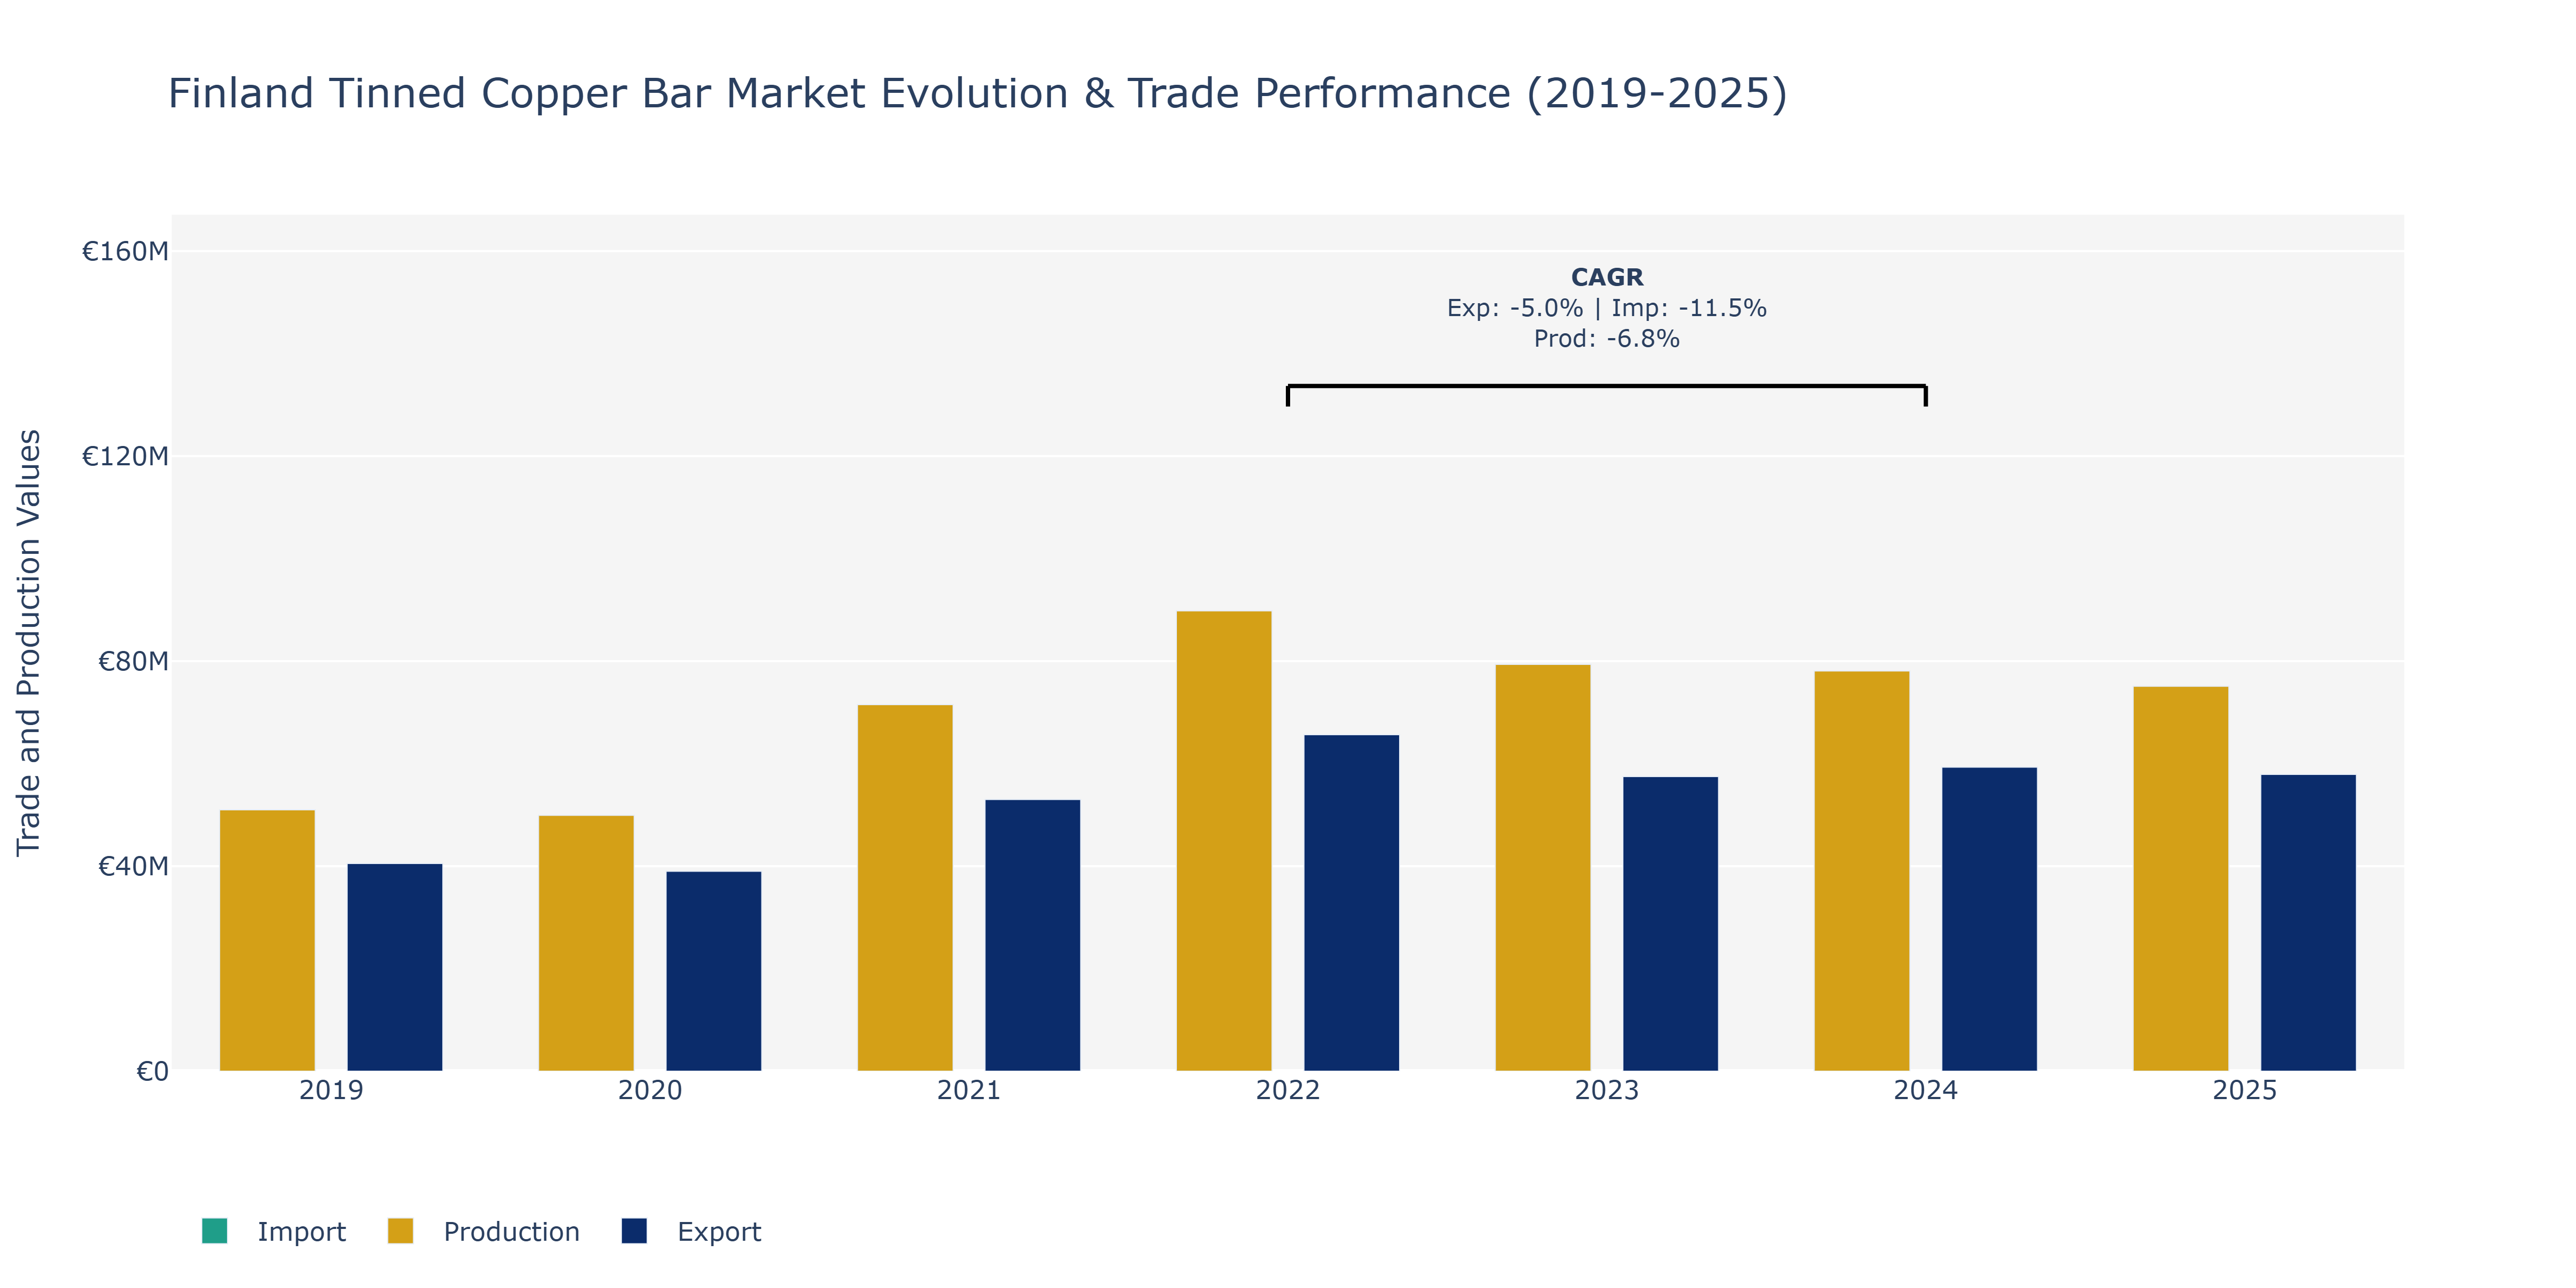
Between 2019 and 2025, Finland's Tinned Copper Bar Market experienced varying trends in Exports, Imports, and Production. Exports saw a peak in 2022 at approximately €65.66 million, followed by a slight decline in subsequent years. Imports peaked in 2022 at about €29.54 million and then decreased steadily. Production also reached its highest point in 2022, standing at around €89.81 million, before showing a decreasing trend. The fluctuations in these metrics can be attributed to several factors such as changes in global demand for copper products, price volatility in the commodity market, and shifts in supply chain dynamics. For instance, the decline in imports could be influenced by efforts to localize production or fluctuations in raw material prices impacting procurement strategies. To maintain competitiveness, market players may need to focus on operational efficiency, strategic sourcing, and market diversification strategies in response to these market dynamics.
Key Highlights of the Report:
- Finland Tinned Copper Bar Market Outlook
- Market Size of Finland Tinned Copper Bar Market, 2024
- Forecast of Finland Tinned Copper Bar Market, 2031
- Historical Data and Forecast of Finland Tinned Copper Bar Revenues & Volume for the Period 2021-2031
- Finland Tinned Copper Bar Market Trend Evolution
- Finland Tinned Copper Bar Market Drivers and Challenges
- Finland Tinned Copper Bar Price Trends
- Finland Tinned Copper Bar Porter`s Five Forces
- Finland Tinned Copper Bar Industry Life Cycle
- Historical Data and Forecast of Finland Tinned Copper Bar Market Revenues & Volume By Type for the Period 2021-2031
- Historical Data and Forecast of Finland Tinned Copper Bar Market Revenues & Volume By Full Round for the Period 2021-2031
- Historical Data and Forecast of Finland Tinned Copper Bar Market Revenues & Volume By Slightly Round Edge for the Period 2021-2031
- Historical Data and Forecast of Finland Tinned Copper Bar Market Revenues & Volume By Square for the Period 2021-2031
- Historical Data and Forecast of Finland Tinned Copper Bar Market Revenues & Volume By Application for the Period 2021-2031
- Historical Data and Forecast of Finland Tinned Copper Bar Market Revenues & Volume By Electrical Conductor for the Period 2021-2031
- Historical Data and Forecast of Finland Tinned Copper Bar Market Revenues & Volume By Induction Motors for the Period 2021-2031
- Historical Data and Forecast of Finland Tinned Copper Bar Market Revenues & Volume By Earthing for the Period 2021-2031
- Historical Data and Forecast of Finland Tinned Copper Bar Market Revenues & Volume By Lightning Protection for the Period 2021-2031
- Historical Data and Forecast of Finland Tinned Copper Bar Market Revenues & Volume By General Engineering for the Period 2021-2031
- Historical Data and Forecast of Finland Tinned Copper Bar Market Revenues & Volume By Switch Gears for the Period 2021-2031
- Historical Data and Forecast of Finland Tinned Copper Bar Market Revenues & Volume By Others for the Period 2021-2031
- Finland Tinned Copper Bar Import Export Trade Statistics
- Market Opportunity Assessment By Type
- Market Opportunity Assessment By Application
- Finland Tinned Copper Bar Top Companies Market Share
- Finland Tinned Copper Bar Competitive Benchmarking By Technical and Operational Parameters
- Finland Tinned Copper Bar Company Profiles
- Finland Tinned Copper Bar Key Strategic Recommendations
Frequently Asked Questions About the Market Study (FAQs):
6Wresearch actively monitors the Finland Tinned Copper Bar Market and publishes its comprehensive annual report, highlighting emerging trends, growth drivers, revenue analysis, and forecast outlook. Our insights help businesses to make data-backed strategic decisions with ongoing market dynamics. Our analysts track relevent industries related to the Finland Tinned Copper Bar Market, allowing our clients with actionable intelligence and reliable forecasts tailored to emerging regional needs.
Yes, we provide customisation as per your requirements. To learn more, feel free to contact us on sales@6wresearch.com
1 Executive Summary |
2 Introduction |
2.1 Key Highlights of the Report |
2.2 Report Description |
2.3 Market Scope & Segmentation |
2.4 Research Methodology |
2.5 Assumptions |
3 Finland Tinned Copper Bar Market Overview |
3.1 Finland Country Macro Economic Indicators |
3.2 Finland Tinned Copper Bar Market Revenues & Volume, 2021 & 2031F |
3.3 Finland Tinned Copper Bar Market - Industry Life Cycle |
3.4 Finland Tinned Copper Bar Market - Porter's Five Forces |
3.5 Finland Tinned Copper Bar Market Revenues & Volume Share, By Type, 2021 & 2031F |
3.6 Finland Tinned Copper Bar Market Revenues & Volume Share, By Application, 2021 & 2031F |
4 Finland Tinned Copper Bar Market Dynamics |
4.1 Impact Analysis |
4.2 Market Drivers |
4.2.1 Increasing demand for tinned copper bars in electrical and electronics industries |
4.2.2 Growing focus on renewable energy sources driving the demand for tinned copper bars in solar and wind energy applications |
4.2.3 Technological advancements leading to the development of tinned copper bars with improved conductivity and corrosion resistance |
4.3 Market Restraints |
4.3.1 Fluctuating prices of raw materials impacting the production cost of tinned copper bars |
4.3.2 Intense competition from substitute materials like aluminum and steel affecting market growth |
4.3.3 Regulatory challenges related to environmental standards and recycling of copper products |
5 Finland Tinned Copper Bar Market Trends |
6 Finland Tinned Copper Bar Market Segmentations |
6.1 Finland Tinned Copper Bar Market, By Type |
6.1.1 Overview and Analysis |
6.1.2 Finland Tinned Copper Bar Market Revenues & Volume, By Full Round, 2021-2031F |
6.1.3 Finland Tinned Copper Bar Market Revenues & Volume, By Slightly Round Edge, 2021-2031F |
6.1.4 Finland Tinned Copper Bar Market Revenues & Volume, By Square, 2021-2031F |
6.2 Finland Tinned Copper Bar Market, By Application |
6.2.1 Overview and Analysis |
6.2.2 Finland Tinned Copper Bar Market Revenues & Volume, By Electrical Conductor, 2021-2031F |
6.2.3 Finland Tinned Copper Bar Market Revenues & Volume, By Induction Motors, 2021-2031F |
6.2.4 Finland Tinned Copper Bar Market Revenues & Volume, By Earthing, 2021-2031F |
6.2.5 Finland Tinned Copper Bar Market Revenues & Volume, By Lightning Protection, 2021-2031F |
6.2.6 Finland Tinned Copper Bar Market Revenues & Volume, By General Engineering, 2021-2031F |
6.2.7 Finland Tinned Copper Bar Market Revenues & Volume, By Switch Gears, 2021-2031F |
7 Finland Tinned Copper Bar Market Import-Export Trade Statistics |
7.1 Finland Tinned Copper Bar Market Export to Major Countries |
7.2 Finland Tinned Copper Bar Market Imports from Major Countries |
8 Finland Tinned Copper Bar Market Key Performance Indicators |
8.1 Percentage of tinned copper bar sales in the electrical and electronics industries |
8.2 Adoption rate of tinned copper bars in renewable energy projects |
8.3 Number of patents filed for technological innovations in tinned copper bar manufacturing |
8.4 Percentage of recycled copper used in tinned copper bar production |
8.5 Average lifespan of tinned copper bars in various applications |
9 Finland Tinned Copper Bar Market - Opportunity Assessment |
9.1 Finland Tinned Copper Bar Market Opportunity Assessment, By Type, 2021 & 2031F |
9.2 Finland Tinned Copper Bar Market Opportunity Assessment, By Application, 2021 & 2031F |
10 Finland Tinned Copper Bar Market - Competitive Landscape |
10.1 Finland Tinned Copper Bar Market Revenue Share, By Companies, 2024 |
10.2 Finland Tinned Copper Bar Market Competitive Benchmarking, By Operating and Technical Parameters |
11 Company Profiles |
12 Recommendations | 13 Disclaimer |
Export potential assessment - trade Analytics for 2030
Export potential enables firms to identify high-growth global markets with greater confidence by combining advanced trade intelligence with a structured quantitative methodology. The framework analyzes emerging demand trends and country-level import patterns while integrating macroeconomic and trade datasets such as GDP and population forecasts, bilateral import–export flows, tariff structures, elasticity differentials between developed and developing economies, geographic distance, and import demand projections. Using weighted trade values from 2020–2024 as the base period to project country-to-country export potential for 2030, these inputs are operationalized through calculated drivers such as gravity model parameters, tariff impact factors, and projected GDP per-capita growth. Through an analysis of hidden potentials, demand hotspots, and market conditions that are most favorable to success, this method enables firms to focus on target countries, maximize returns, and global expansion with data, backed by accuracy.
By factoring in the projected importer demand gap that is currently unmet and could be potential opportunity, it identifies the potential for the Exporter (Country) among 190 countries, against the general trade analysis, which identifies the biggest importer or exporter.
To discover high-growth global markets and optimize your business strategy:
Click Here
Pricing
- Single User License$ 1,995
- Department License$ 2,400
- Site License$ 3,120
- Global License$ 3,795

Search
Thought Leadership and Analyst Meet


Our Clients
Latest Reports
- France Thermally Conductive Filler Dispersants Market (2026-2032) | Challenges, Restraints, Value, Share, Size, segmentation, Analysis, Trends, Investment Opportunities, Outlook, Pricing, Demand, Forecast, Revenue, Companies, Growth, Drivers, Strategy, Insights, Competition
- Egypt Thermally Conductive Filler Dispersants Market (2026-2032) | Competition, Forecast, Strategy, Value, Insights, Outlook, Investment Opportunities, Pricing, Demand, Share, segmentation, Drivers, Size, Companies, Restraints, Growth, Trends, Revenue, Challenges, Analysis
- Czech Republic Thermally Conductive Filler Dispersants Market (2026-2032) | Forecast, Pricing, Analysis, Drivers, Insights, Size, Demand, Growth, Challenges, segmentation, Competition, Outlook, Trends, Investment Opportunities, Companies, Strategy, Revenue, Share, Value, Restraints
- Colombia Thermally Conductive Filler Dispersants Market (2026-2032) | segmentation, Trends, Share, Drivers, Strategy, Companies, Demand, Insights, Size, Challenges, Value, Competition, Analysis, Growth, Revenue, Restraints, Forecast, Pricing, Outlook, Investment Opportunities
- China Thermally Conductive Filler Dispersants Market (2026-2032) | Restraints, Investment Opportunities, Pricing, Companies, Share, Size, Challenges, Trends, Outlook, Value, Analysis, Competition, Revenue, Drivers, Forecast, Demand, Insights, Growth, Strategy, segmentation
- Chile Thermally Conductive Filler Dispersants Market (2026-2032) | Investment Opportunities, Trends, Value, Restraints, Share, Companies, Forecast, segmentation, Pricing, Challenges, Demand, Size, Analysis, Drivers, Outlook, Growth, Competition, Strategy, Revenue, Insights
- Cambodia Thermally Conductive Filler Dispersants Market (2026-2032) | Analysis, Share, Outlook, Strategy, Pricing, Demand, Size, Growth, segmentation, Insights, Revenue, Forecast, Challenges, Competition, Companies, Investment Opportunities, Trends, Restraints, Value, Drivers
- Brazil Thermally Conductive Filler Dispersants Market (2026-2032) | Restraints, Forecast, Competition, Size, Revenue, Value, Investment Opportunities, Trends, Insights, Outlook, Growth, Analysis, Drivers, segmentation, Pricing, Challenges, Strategy, Share, Companies, Demand
- Bangladesh Thermally Conductive Filler Dispersants Market (2026-2032) | Restraints, Trends, Analysis, Competition, Insights, Forecast, Value, Investment Opportunities, Pricing, Share, Demand, Outlook, Revenue, segmentation, Companies, Drivers, Growth, Size, Challenges, Strategy
- Bahrain Thermally Conductive Filler Dispersants Market (2026-2032) | Trends, Outlook, Pricing, Demand, Value, Competition, Forecast, Growth, segmentation, Revenue, Companies, Analysis, Insights, Size, Drivers, Challenges, Strategy, Investment Opportunities, Share, Restraints
Industry Events and Analyst Meet

HIMTEX 2026

India Refining Summit 2026

India EV Show 2026

EV tech India Expo 2026

Auto Tech Asia 2026
Whitepaper
- Middle East & Africa Commercial Security Market Click here to view more.
- Middle East & Africa Fire Safety Systems & Equipment Market Click here to view more.
- GCC Drone Market Click here to view more.
- Middle East Lighting Fixture Market Click here to view more.
- GCC Physical & Perimeter Security Market Click here to view more.
6WResearch In News
- Doha a strategic location for EV manufacturing hub: IPA Qatar
- Demand for luxury TVs surging in the GCC, says Samsung
- Empowering Growth: The Thriving Journey of Bangladesh’s Cable Industry
- Demand for luxury TVs surging in the GCC, says Samsung
- Video call with a traditional healer? Once unthinkable, it’s now common in South Africa
- Intelligent Buildings To Smooth GCC’s Path To Net Zero