France Honeycomb Sandwich Market (2026-2032) | Competition, Strategic Insights, Forecast, Restraints, Pricing Analysis, Competitive, Challenges, Growth, Consumer Insights, Trends, Companies, Supply, Size, Analysis, Opportunities, Strategy, Demand, Industry, Share, Investment Trends, Drivers, Value, Segmentation, Outlook, Segments, Revenue
Market Forecast By Product Type (Aerospace Honeycomb Sandwich, Automotive Honeycomb Sandwich, Marine Honeycomb Sandwich, Industrial Honeycomb Sandwich), By Core Material (Aluminum Core, Polypropylene Core, Fiberglass Core, Carbon Fiber Core), By End User (Aircraft Manufacturers, Car Manufacturers, Boat Builders, Heavy Machinery), By Application (Lightweight Structures, Crash Absorption Panels, Hull and Deck Construction, High-strength Panels) And Competitive Landscape
| Product Code: ETC12315337 | Publication Date: Apr 2025 | Updated Date: Apr 2026 | Product Type: Market Research Report | |
| Publisher: 6Wresearch | Author: Sachin Kumar Rai | No. of Pages: 65 | No. of Figures: 34 | No. of Tables: 19 |
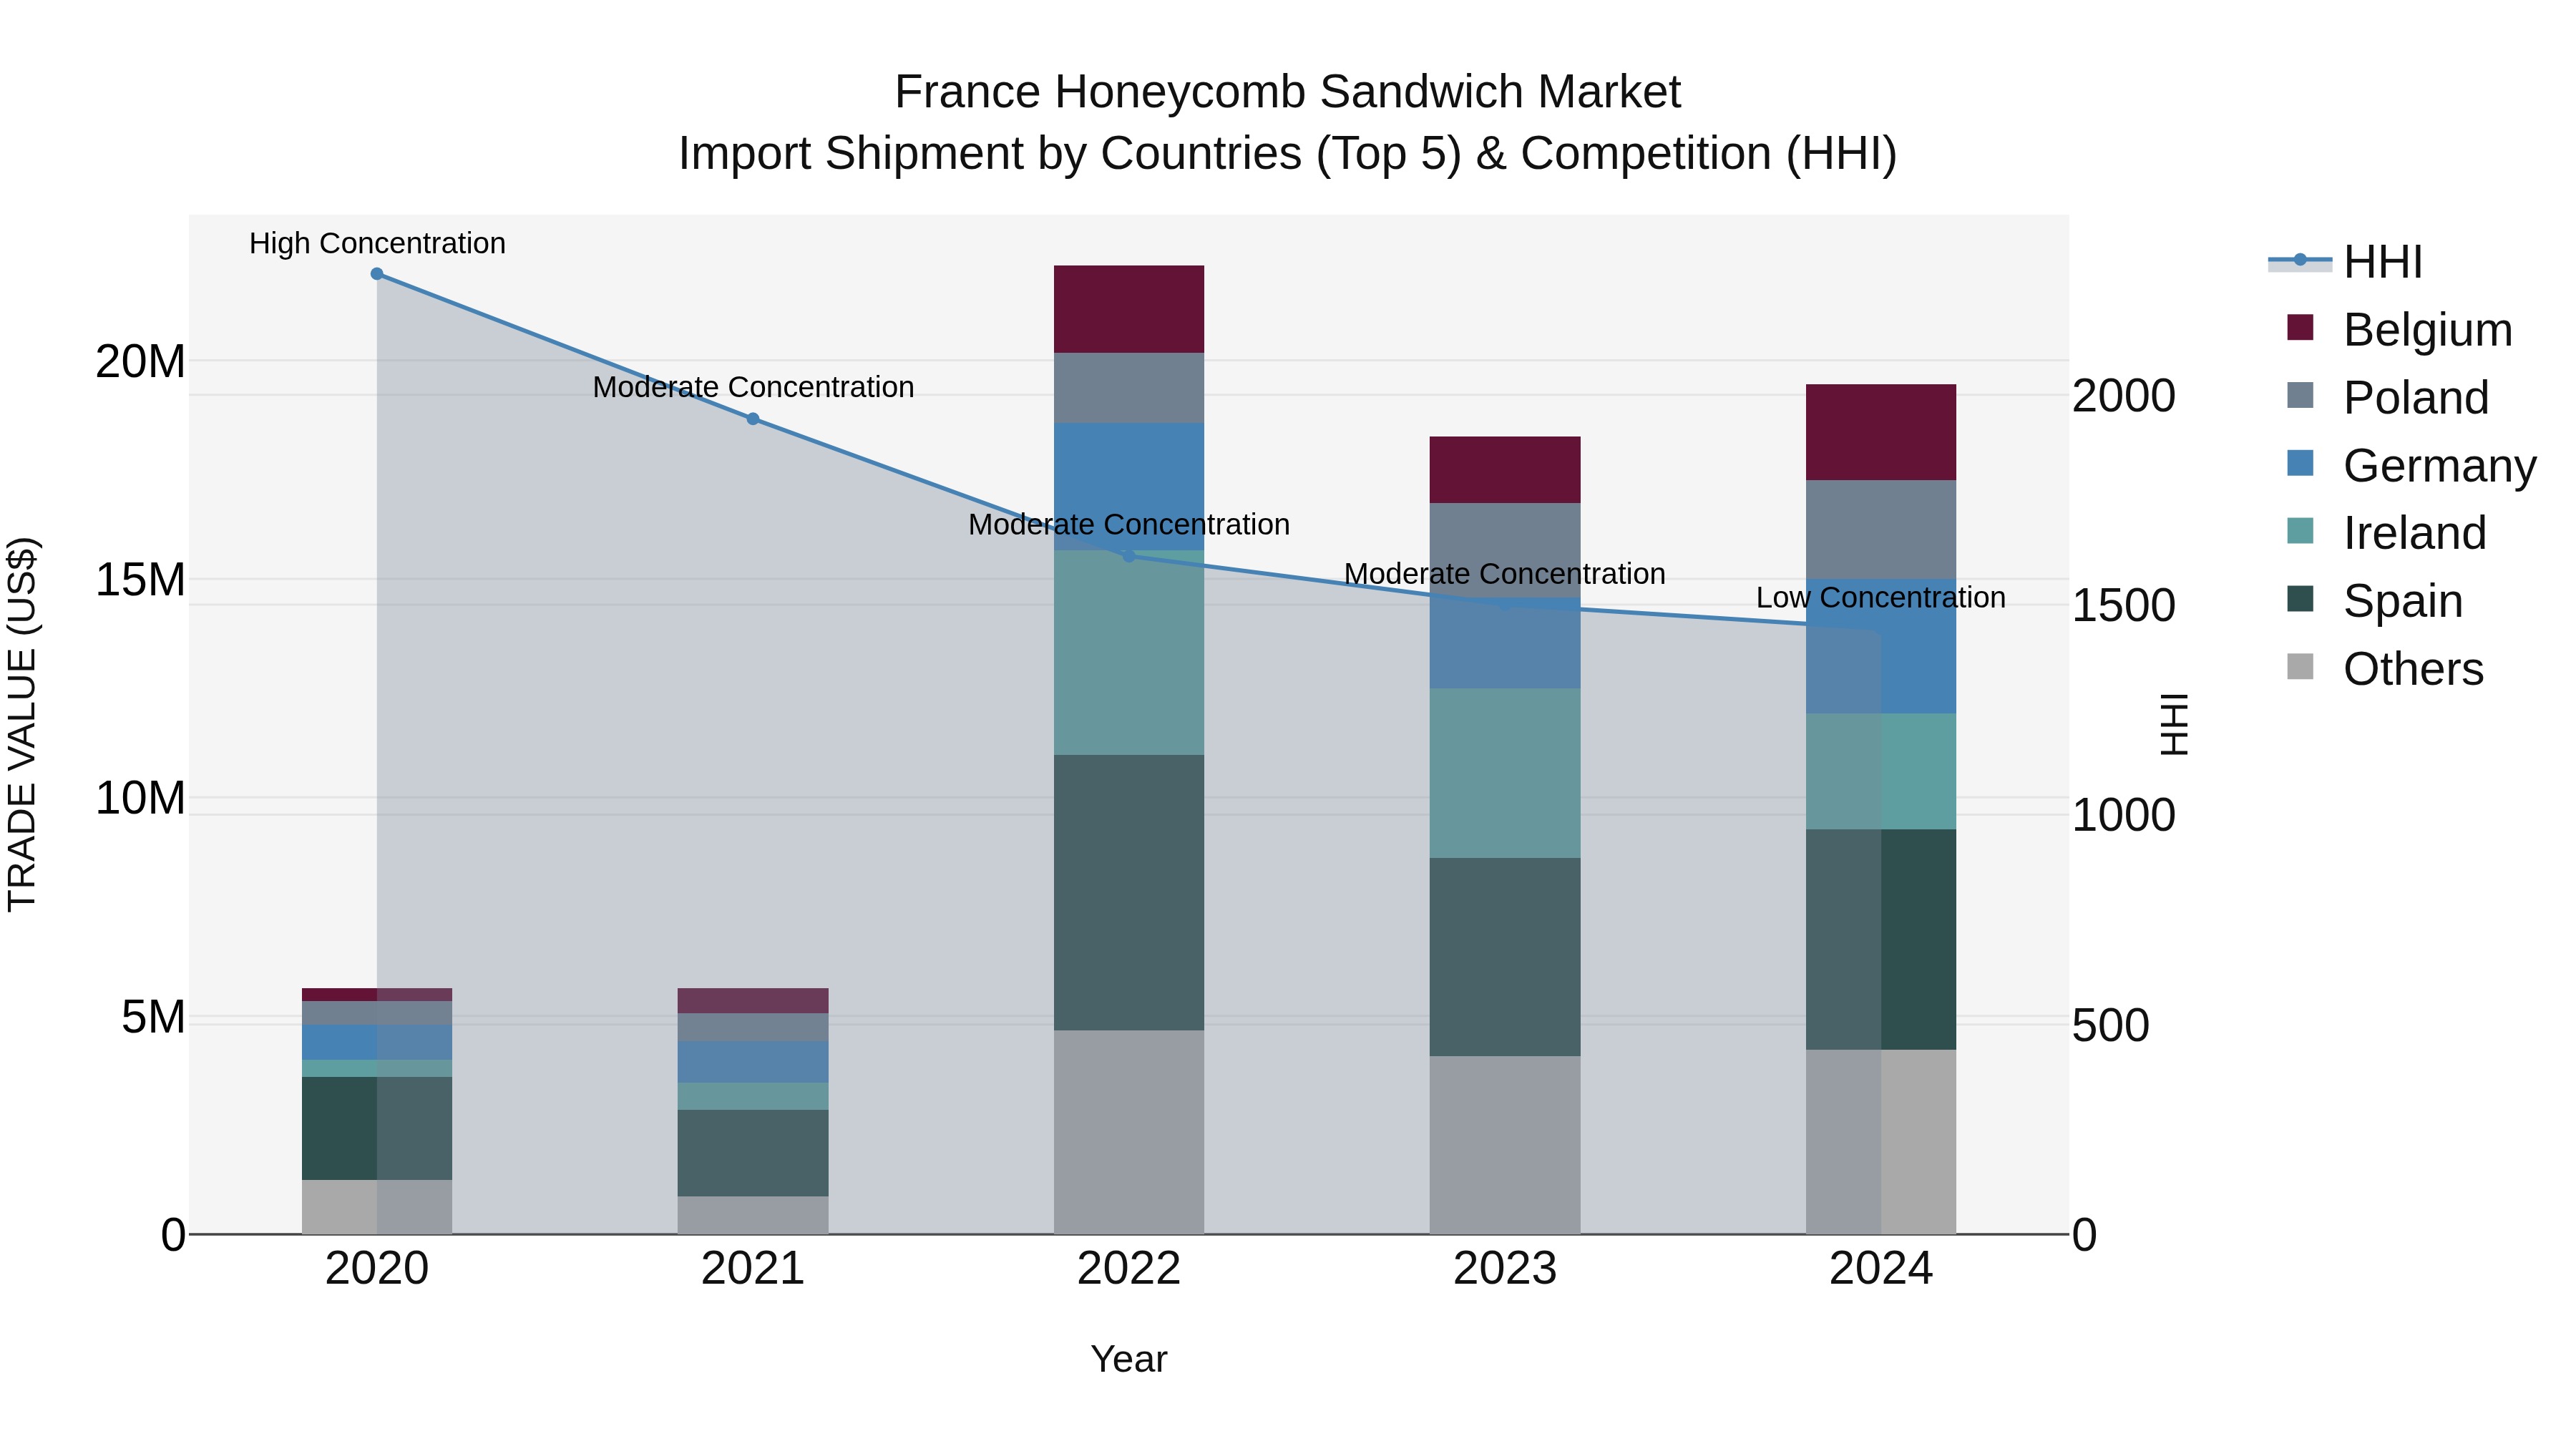
France Honeycomb Sandwich Market Top 5 Importing Countries and Market Competition (HHI) Analysis
France`s honeycomb sandwich import market saw significant growth in 2024, with key suppliers such as Spain, Germany, Ireland, Poland, and Belgium leading the way. The market witnessed a shift from moderate to low concentration, indicating increased competition among suppliers. The compound annual growth rate (CAGR) from 2020 to 2024 was an impressive 36.31%, with a notable growth rate of 6.55% in 2024 alone. This data suggests a thriving market for honeycomb sandwich imports in France, driven by a diverse range of suppliers and sustained growth momentum.
Key Highlights of the Report:
- France Honeycomb Sandwich Market Outlook
- Market Size of France Honeycomb Sandwich Market, 2025
- Forecast of France Honeycomb Sandwich Market, 2032
- Historical Data and Forecast of France Honeycomb Sandwich Revenues & Volume for the Period 2022 - 2032F
- France Honeycomb Sandwich Market Trend Evolution
- France Honeycomb Sandwich Market Drivers and Challenges
- France Honeycomb Sandwich Price Trends
- France Honeycomb Sandwich Porter's Five Forces
- France Honeycomb Sandwich Industry Life Cycle
- Historical Data and Forecast of France Honeycomb Sandwich Market Revenues & Volume By Product Type for the Period 2022 - 2032F
- Historical Data and Forecast of France Honeycomb Sandwich Market Revenues & Volume By Aerospace Honeycomb Sandwich for the Period 2022 - 2032F
- Historical Data and Forecast of France Honeycomb Sandwich Market Revenues & Volume By Automotive Honeycomb Sandwich for the Period 2022 - 2032F
- Historical Data and Forecast of France Honeycomb Sandwich Market Revenues & Volume By Marine Honeycomb Sandwich for the Period 2022 - 2032F
- Historical Data and Forecast of France Honeycomb Sandwich Market Revenues & Volume By Industrial Honeycomb Sandwich for the Period 2022 - 2032F
- Historical Data and Forecast of France Honeycomb Sandwich Market Revenues & Volume By Core Material for the Period 2022 - 2032F
- Historical Data and Forecast of France Honeycomb Sandwich Market Revenues & Volume By Aluminum Core for the Period 2022 - 2032F
- Historical Data and Forecast of France Honeycomb Sandwich Market Revenues & Volume By Polypropylene Core for the Period 2022 - 2032F
- Historical Data and Forecast of France Honeycomb Sandwich Market Revenues & Volume By Fiberglass Core for the Period 2022 - 2032F
- Historical Data and Forecast of France Honeycomb Sandwich Market Revenues & Volume By Carbon Fiber Core for the Period 2022 - 2032F
- Historical Data and Forecast of France Honeycomb Sandwich Market Revenues & Volume By End User for the Period 2022 - 2032F
- Historical Data and Forecast of France Honeycomb Sandwich Market Revenues & Volume By Aircraft Manufacturers for the Period 2022 - 2032F
- Historical Data and Forecast of France Honeycomb Sandwich Market Revenues & Volume By Car Manufacturers for the Period 2022 - 2032F
- Historical Data and Forecast of France Honeycomb Sandwich Market Revenues & Volume By Boat Builders for the Period 2022 - 2032F
- Historical Data and Forecast of France Honeycomb Sandwich Market Revenues & Volume By Heavy Machinery for the Period 2022 - 2032F
- Historical Data and Forecast of France Honeycomb Sandwich Market Revenues & Volume By Application for the Period 2022 - 2032F
- Historical Data and Forecast of France Honeycomb Sandwich Market Revenues & Volume By Lightweight Structures for the Period 2022 - 2032F
- Historical Data and Forecast of France Honeycomb Sandwich Market Revenues & Volume By Crash Absorption Panels for the Period 2022 - 2032F
- Historical Data and Forecast of France Honeycomb Sandwich Market Revenues & Volume By Hull and Deck Construction for the Period 2022 - 2032F
- Historical Data and Forecast of France Honeycomb Sandwich Market Revenues & Volume By High-strength Panels for the Period 2022 - 2032F
- France Honeycomb Sandwich Import Export Trade Statistics
- Market Opportunity Assessment By Product Type
- Market Opportunity Assessment By Core Material
- Market Opportunity Assessment By End User
- Market Opportunity Assessment By Application
- France Honeycomb Sandwich Top Companies Market Share
- France Honeycomb Sandwich Competitive Benchmarking By Technical and Operational Parameters
- France Honeycomb Sandwich Company Profiles
- France Honeycomb Sandwich Key Strategic Recommendations
Frequently Asked Questions About the Market Study (FAQs):
6Wresearch actively monitors the France Honeycomb Sandwich Market and publishes its comprehensive annual report, highlighting emerging trends, growth drivers, revenue analysis, and forecast outlook. Our insights help businesses to make data-backed strategic decisions with ongoing market dynamics. Our analysts track relevent industries related to the France Honeycomb Sandwich Market, allowing our clients with actionable intelligence and reliable forecasts tailored to emerging regional needs.
Yes, we provide customisation as per your requirements. To learn more, feel free to contact us on sales@6wresearch.com
1 Executive Summary |
2 Introduction |
2.1 Key Highlights of the Report |
2.2 Report Description |
2.3 Market Scope & Segmentation |
2.4 Research Methodology |
2.5 Assumptions |
3 France Honeycomb Sandwich Market Overview |
3.1 France Country Macro Economic Indicators |
3.2 France Honeycomb Sandwich Market Revenues & Volume, 2022 & 2032F |
3.3 France Honeycomb Sandwich Market - Industry Life Cycle |
3.4 France Honeycomb Sandwich Market - Porter's Five Forces |
3.5 France Honeycomb Sandwich Market Revenues & Volume Share, By Product Type, 2022 & 2032F |
3.6 France Honeycomb Sandwich Market Revenues & Volume Share, By Core Material, 2022 & 2032F |
3.7 France Honeycomb Sandwich Market Revenues & Volume Share, By End User, 2022 & 2032F |
3.8 France Honeycomb Sandwich Market Revenues & Volume Share, By Application, 2022 & 2032F |
4 France Honeycomb Sandwich Market Dynamics |
4.1 Impact Analysis |
4.2 Market Drivers |
4.2.1 Increasing demand for lightweight and high-strength materials in the aerospace industry |
4.2.2 Growing preference for honeycomb sandwich structures in automotive for weight reduction and improved fuel efficiency |
4.2.3 Rising adoption of honeycomb sandwich panels in construction and building applications for their durability and thermal insulation properties |
4.3 Market Restraints |
4.3.1 High production costs associated with honeycomb sandwich structures |
4.3.2 Limited availability of raw materials required for manufacturing honeycomb sandwich panels |
4.3.3 Stringent regulations and standards governing the use of honeycomb sandwich structures in certain industries |
5 France Honeycomb Sandwich Market Trends |
6 France Honeycomb Sandwich Market, By Types |
6.1 France Honeycomb Sandwich Market, By Product Type |
6.1.1 Overview and Analysis |
6.1.2 France Honeycomb Sandwich Market Revenues & Volume, By Product Type, 2022 - 2032F |
6.1.3 France Honeycomb Sandwich Market Revenues & Volume, By Aerospace Honeycomb Sandwich, 2022 - 2032F |
6.1.4 France Honeycomb Sandwich Market Revenues & Volume, By Automotive Honeycomb Sandwich, 2022 - 2032F |
6.1.5 France Honeycomb Sandwich Market Revenues & Volume, By Marine Honeycomb Sandwich, 2022 - 2032F |
6.1.6 France Honeycomb Sandwich Market Revenues & Volume, By Industrial Honeycomb Sandwich, 2022 - 2032F |
6.2 France Honeycomb Sandwich Market, By Core Material |
6.2.1 Overview and Analysis |
6.2.2 France Honeycomb Sandwich Market Revenues & Volume, By Aluminum Core, 2022 - 2032F |
6.2.3 France Honeycomb Sandwich Market Revenues & Volume, By Polypropylene Core, 2022 - 2032F |
6.2.4 France Honeycomb Sandwich Market Revenues & Volume, By Fiberglass Core, 2022 - 2032F |
6.2.5 France Honeycomb Sandwich Market Revenues & Volume, By Carbon Fiber Core, 2022 - 2032F |
6.3 France Honeycomb Sandwich Market, By End User |
6.3.1 Overview and Analysis |
6.3.2 France Honeycomb Sandwich Market Revenues & Volume, By Aircraft Manufacturers, 2022 - 2032F |
6.3.3 France Honeycomb Sandwich Market Revenues & Volume, By Car Manufacturers, 2022 - 2032F |
6.3.4 France Honeycomb Sandwich Market Revenues & Volume, By Boat Builders, 2022 - 2032F |
6.3.5 France Honeycomb Sandwich Market Revenues & Volume, By Heavy Machinery, 2022 - 2032F |
6.4 France Honeycomb Sandwich Market, By Application |
6.4.1 Overview and Analysis |
6.4.2 France Honeycomb Sandwich Market Revenues & Volume, By Lightweight Structures, 2022 - 2032F |
6.4.3 France Honeycomb Sandwich Market Revenues & Volume, By Crash Absorption Panels, 2022 - 2032F |
6.4.4 France Honeycomb Sandwich Market Revenues & Volume, By Hull and Deck Construction, 2022 - 2032F |
6.4.5 France Honeycomb Sandwich Market Revenues & Volume, By High-strength Panels, 2022 - 2032F |
7 France Honeycomb Sandwich Market Import-Export Trade Statistics |
7.1 France Honeycomb Sandwich Market Export to Major Countries |
7.2 France Honeycomb Sandwich Market Imports from Major Countries |
8 France Honeycomb Sandwich Market Key Performance Indicators |
8.1 Average order value per customer |
8.2 Percentage of repeat customers |
8.3 Customer satisfaction score based on product quality and service level |
8.4 Percentage of market share within specific industries where honeycomb sandwich structures are used |
8.5 Number of new product innovations or developments in the honeycomb sandwich market |
9 France Honeycomb Sandwich Market - Opportunity Assessment |
9.1 France Honeycomb Sandwich Market Opportunity Assessment, By Product Type, 2022 & 2032F |
9.2 France Honeycomb Sandwich Market Opportunity Assessment, By Core Material, 2022 & 2032F |
9.3 France Honeycomb Sandwich Market Opportunity Assessment, By End User, 2022 & 2032F |
9.4 France Honeycomb Sandwich Market Opportunity Assessment, By Application, 2022 & 2032F |
10 France Honeycomb Sandwich Market - Competitive Landscape |
10.1 France Honeycomb Sandwich Market Revenue Share, By Companies, 2025 |
10.2 France Honeycomb Sandwich Market Competitive Benchmarking, By Operating and Technical Parameters |
11 Company Profiles |
12 Recommendations |
13 Disclaimer |
Export potential assessment - trade Analytics for 2030
Export potential enables firms to identify high-growth global markets with greater confidence by combining advanced trade intelligence with a structured quantitative methodology. The framework analyzes emerging demand trends and country-level import patterns while integrating macroeconomic and trade datasets such as GDP and population forecasts, bilateral import–export flows, tariff structures, elasticity differentials between developed and developing economies, geographic distance, and import demand projections. Using weighted trade values from 2020–2024 as the base period to project country-to-country export potential for 2030, these inputs are operationalized through calculated drivers such as gravity model parameters, tariff impact factors, and projected GDP per-capita growth. Through an analysis of hidden potentials, demand hotspots, and market conditions that are most favorable to success, this method enables firms to focus on target countries, maximize returns, and global expansion with data, backed by accuracy.
By factoring in the projected importer demand gap that is currently unmet and could be potential opportunity, it identifies the potential for the Exporter (Country) among 190 countries, against the general trade analysis, which identifies the biggest importer or exporter.
To discover high-growth global markets and optimize your business strategy:
Click Here
Pricing
- Single User License$ 1,995
- Department License$ 2,400
- Site License$ 3,120
- Global License$ 3,795

Search
Thought Leadership and Analyst Meet


Our Clients
Latest Reports
- China Electric Appliance Rental Market (2026-2032) | Trends, Revenue, Growth, Challenges, Size, Value, Outlook, Pricing, Strategy, Insights, Restraints, segmentation, Companies, Investment Opportunities, Analysis, Demand, Drivers, Competition, Forecast, Share
- Chile Electric Appliance Rental Market (2026-2032) | Outlook, Competition, Drivers, Strategy, Revenue, Analysis, Value, Pricing, Restraints, Size, Demand, Share, Growth, Forecast, Challenges, Insights, Investment Opportunities, Companies, Trends, segmentation
- Cambodia Electric Appliance Rental Market (2026-2032) | Companies, Analysis, Restraints, Pricing, Insights, Challenges, Outlook, Strategy, Forecast, Trends, Competition, Value, Revenue, Investment Opportunities, segmentation, Drivers, Size, Demand, Growth, Share
- Brazil Electric Appliance Rental Market (2026-2032) | Revenue, Strategy, Forecast, Companies, segmentation, Competition, Size, Investment Opportunities, Pricing, Restraints, Outlook, Challenges, Analysis, Drivers, Value, Demand, Insights, Trends, Growth, Share
- Bangladesh Electric Appliance Rental Market (2026-2032) | Drivers, Forecast, Investment Opportunities, Strategy, Insights, Demand, Challenges, Outlook, Trends, Competition, Value, Revenue, Size, Pricing, Analysis, Companies, Restraints, segmentation, Share, Growth
- Bahrain Electric Appliance Rental Market (2026-2032) | Outlook, Size, Competition, Restraints, Drivers, Value, Trends, Investment Opportunities, Insights, Forecast, Revenue, Strategy, Growth, Share, Demand, Analysis, Challenges, Companies, segmentation, Pricing
- Azerbaijan Electric Appliance Rental Market (2026-2032) | Trends, Investment Opportunities, Restraints, Insights, Strategy, Competition, Value, Growth, Demand, Drivers, Analysis, Forecast, Size, Share, Outlook, segmentation, Pricing, Challenges, Revenue, Companies
- Australia Electric Appliance Rental Market (2026-2032) | Challenges, Restraints, Forecast, Demand, Size, Competition, Pricing, Investment Opportunities, Revenue, Trends, Drivers, Growth, Outlook, Analysis, Strategy, Value, segmentation, Insights, Companies, Share
- Argentina Electric Appliance Rental Market (2026-2032) | Growth, Trends, Insights, Outlook, Forecast, Size, Drivers, Analysis, Restraints, Challenges, Share, Revenue, Investment Opportunities, Strategy, Demand, Value, Companies, segmentation, Competition, Pricing
- Algeria Electric Appliance Rental Market (2026-2032) | Share, Size, Value, Strategy, Competition, Outlook, Challenges, Companies, Trends, Pricing, Insights, Forecast, Investment Opportunities, Revenue, Growth, Restraints, segmentation, Analysis, Demand, Drivers
Industry Events and Analyst Meet

HIMTEX 2026

India Refining Summit 2026

India EV Show 2026

EV tech India Expo 2026

Auto Tech Asia 2026
Whitepaper
- Middle East & Africa Commercial Security Market Click here to view more.
- Middle East & Africa Fire Safety Systems & Equipment Market Click here to view more.
- GCC Drone Market Click here to view more.
- Middle East Lighting Fixture Market Click here to view more.
- GCC Physical & Perimeter Security Market Click here to view more.
6WResearch In News
- Doha a strategic location for EV manufacturing hub: IPA Qatar
- Demand for luxury TVs surging in the GCC, says Samsung
- Empowering Growth: The Thriving Journey of Bangladesh’s Cable Industry
- Demand for luxury TVs surging in the GCC, says Samsung
- Video call with a traditional healer? Once unthinkable, it’s now common in South Africa
- Intelligent Buildings To Smooth GCC’s Path To Net Zero