Gambia Ceramic Inks Market (2026-2032) | Size, Revenue, Value, Companies, Trends, Forecast, Segmentation, Share, Growth, Industry, Outlook & Analysis
Market Forecast By Type (Decorative , Functional), By Technology (Digital , Analog), By Application (Ceramic Tiles, Glass Printing, Food Container Printing) And Competitive Landscape
| Product Code: ETC5705718 | Publication Date: Nov 2023 | Updated Date: Mar 2026 | Product Type: Market Research Report | |
| Publisher: 6Wresearch | Author: Sumit Sagar | No. of Pages: 60 | No. of Figures: 30 | No. of Tables: 5 |
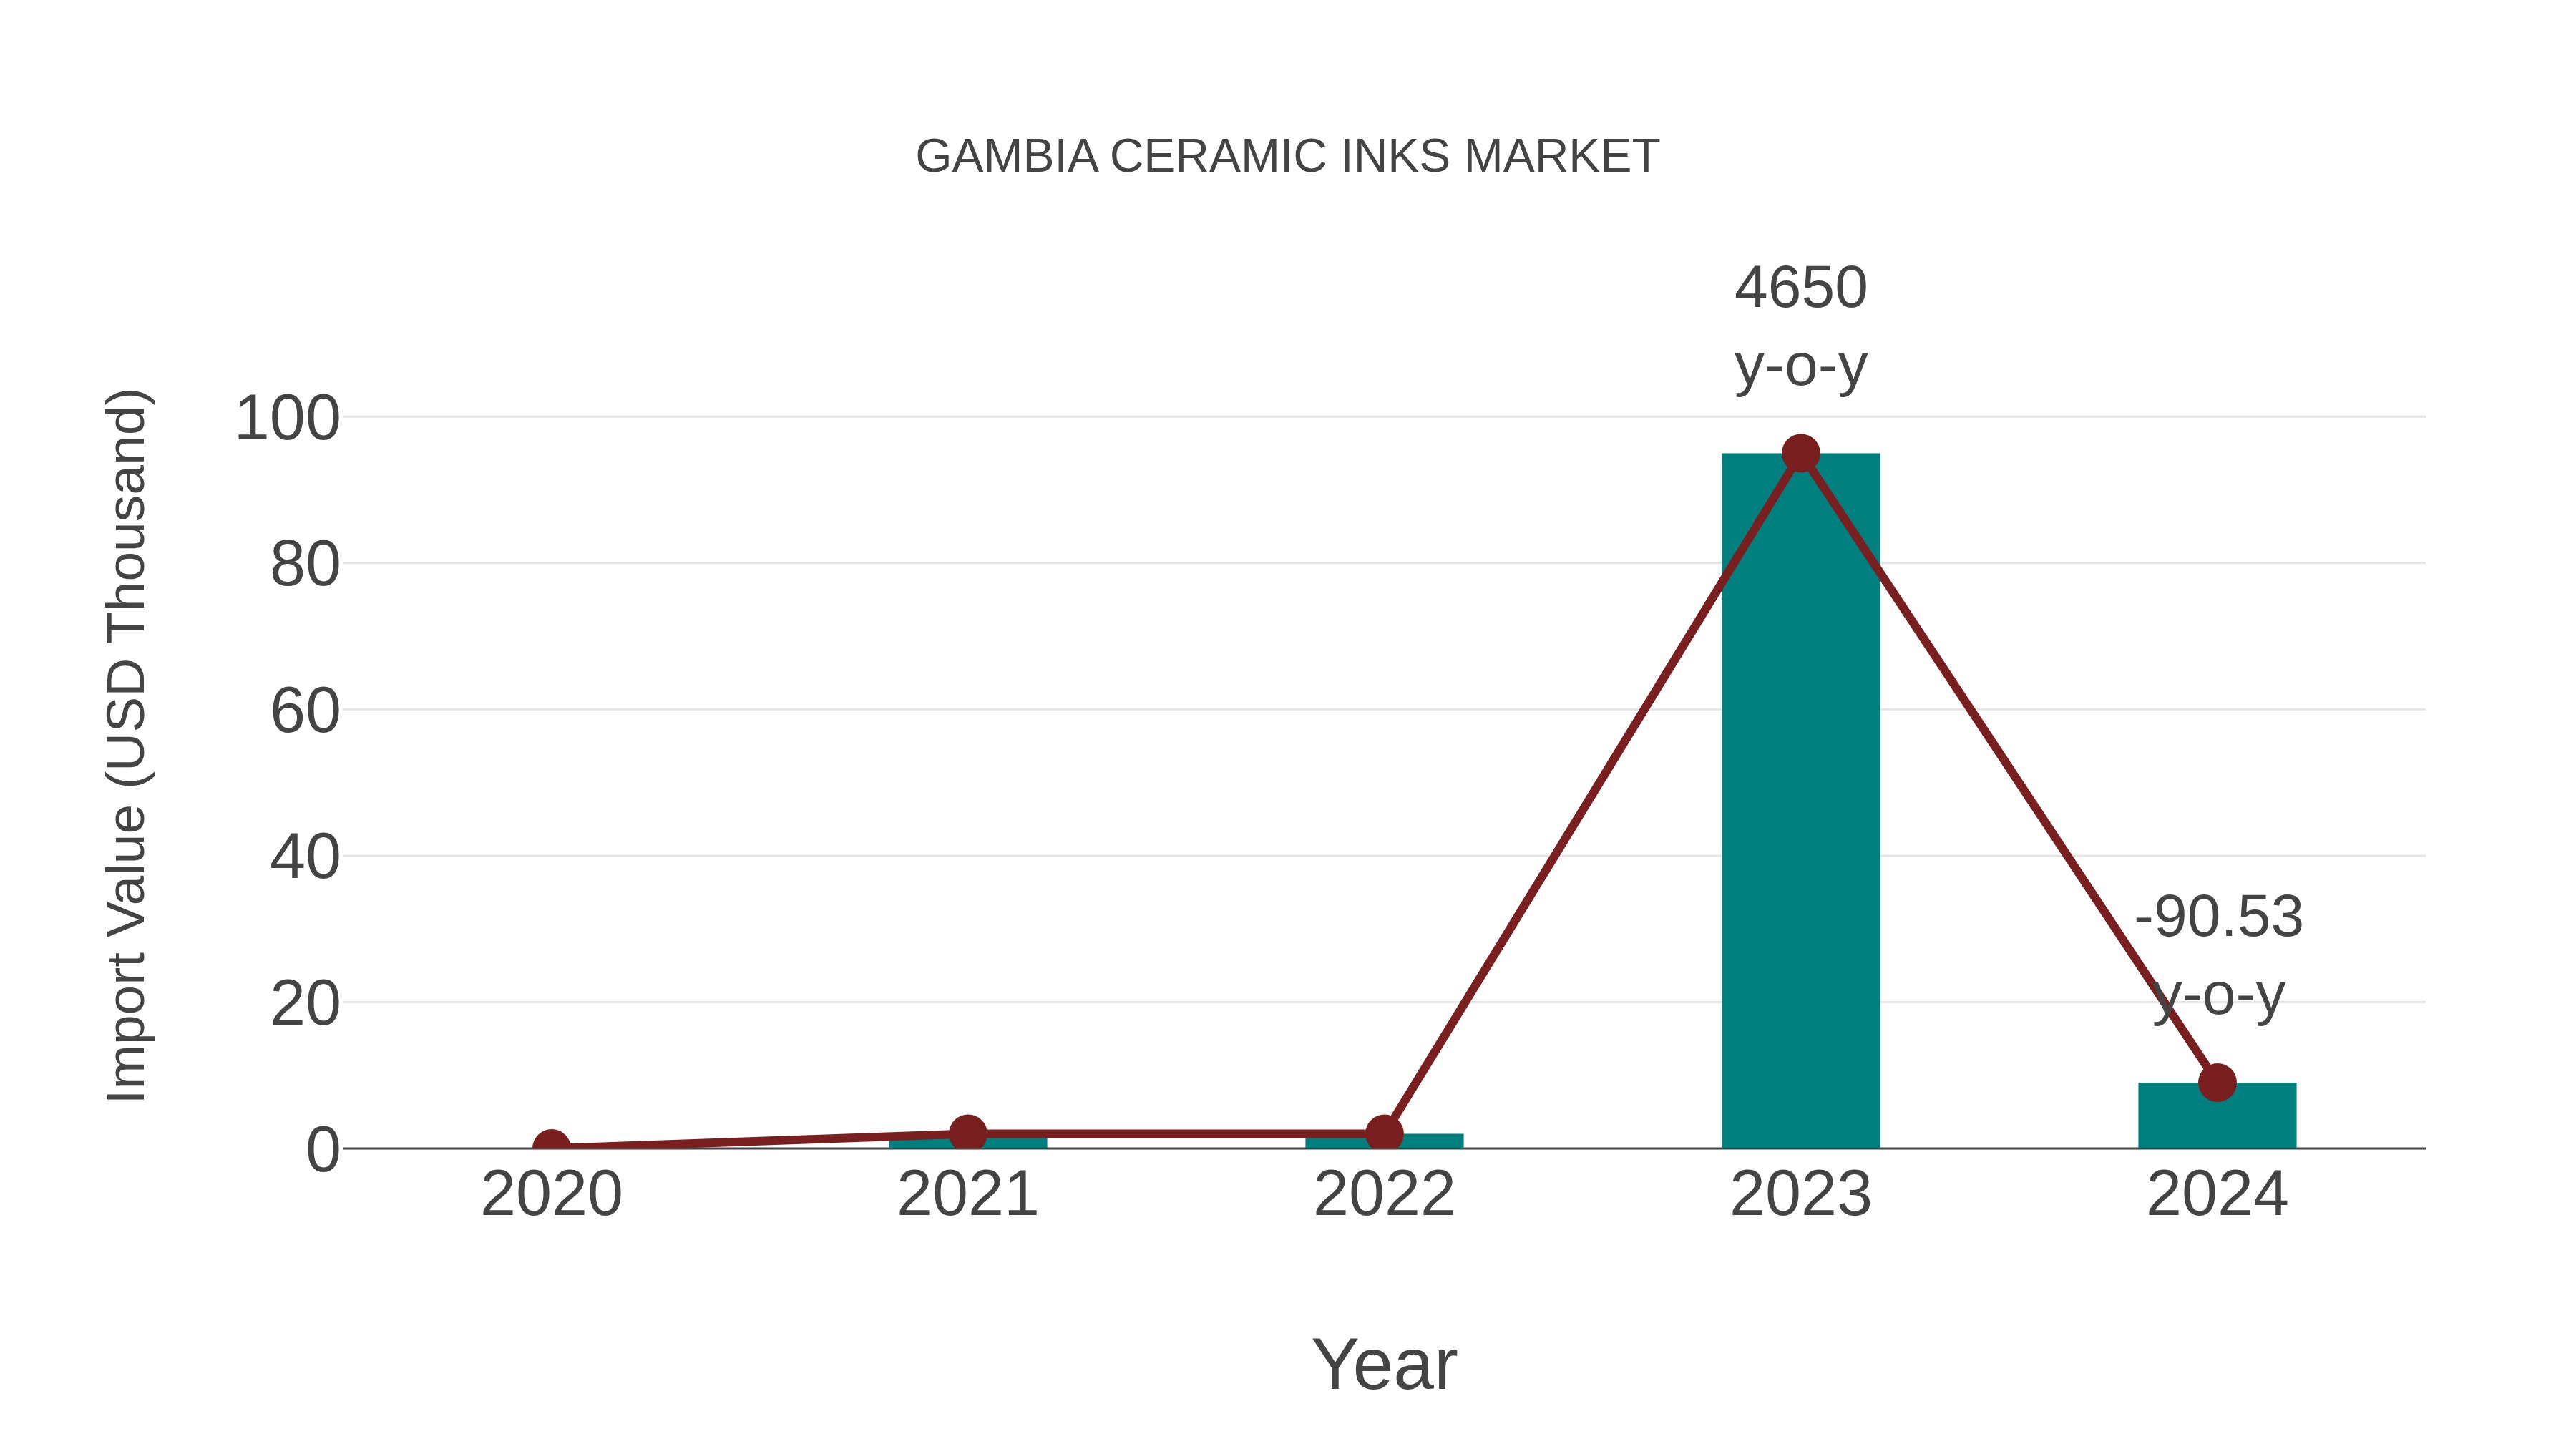
Gambia Ceramic Inks Market: Import Trend Analysis
The Gambia ceramic inks market witnessed a significant increase in imports from 2020 to 2024, with a Compound Annual Growth Rate (CAGR) of 65.10%. Notably, there was a sharp decline in the year-on-year growth rate from 2023 to 2024, with a decrease of -90.53%. Despite this decline, the overall trend showed a substantial rise in imports during the specified period.
Gambia Ceramic Inks Market Overview
The ceramic inks market in Gambia is growing with the increasing demand for printed ceramics and decorative tiles. Ceramic inks are used in the decoration of ceramics, particularly for tiles, bathroom fixtures, and kitchenware. The market is expected to expand as demand for aesthetically pleasing and high-quality ceramic products rises in both residential and commercial sectors.
Drivers of the market
The Gambia ceramic inks market is driven by the growing demand for decorative and functional ceramics, particularly in the construction and home decor industries. Ceramic inks are used for printing designs on ceramic tiles, dinnerware, and other ceramic products. As the construction industry grows, the demand for decorative ceramic products also rises, boosting the demand for ceramic inks. Additionally, the increasing preference for customized and unique designs in ceramics is fueling the markets growth.
Challenges of the market
The ceramic inks market in Gambia is influenced by the high cost of imports, as there is no significant local manufacturing of ceramic inks. These inks are used in industries like ceramics and printing, but the market for these products is limited due to the high cost and lack of local production facilities. Furthermore, the lack of awareness about the advantages and diverse applications of ceramic inks restricts their adoption.
Government Policy of the market
The ceramic inks market in Gambia is regulated under policies that support the local production of inks used in the decoration and design of ceramics. The government incentivizes businesses that adopt eco-friendly and non-toxic ink formulations, promoting sustainability in the ceramics industry. Quality assurance programs ensure that ceramic inks meet international standards, boosting the competitiveness of local ceramic products on the global market.
Key Highlights of the Report:
- Gambia Ceramic Inks Market Outlook
- Market Size of Gambia Ceramic Inks Market, 2025
- Forecast of Gambia Ceramic Inks Market, 2032
- Historical Data and Forecast of Gambia Ceramic Inks Revenues & Volume for the Period 2022-2032F
- Gambia Ceramic Inks Market Trend Evolution
- Gambia Ceramic Inks Market Drivers and Challenges
- Gambia Ceramic Inks Price Trends
- Gambia Ceramic Inks Porter`s Five Forces
- Gambia Ceramic Inks Industry Life Cycle
- Historical Data and Forecast of Gambia Ceramic Inks Market Revenues & Volume By Type for the Period 2022-2032F
- Historical Data and Forecast of Gambia Ceramic Inks Market Revenues & Volume By Decorative for the Period 2022-2032F
- Historical Data and Forecast of Gambia Ceramic Inks Market Revenues & Volume By Functional for the Period 2022-2032F
- Historical Data and Forecast of Gambia Ceramic Inks Market Revenues & Volume By Technology for the Period 2022-2032F
- Historical Data and Forecast of Gambia Ceramic Inks Market Revenues & Volume By Digital for the Period 2022-2032F
- Historical Data and Forecast of Gambia Ceramic Inks Market Revenues & Volume By Analog for the Period 2022-2032F
- Historical Data and Forecast of Gambia Ceramic Inks Market Revenues & Volume By Application for the Period 2022-2032F
- Historical Data and Forecast of Gambia Ceramic Inks Market Revenues & Volume By Ceramic Tiles for the Period 2022-2032F
- Historical Data and Forecast of Gambia Ceramic Inks Market Revenues & Volume By Glass Printing for the Period 2022-2032F
- Historical Data and Forecast of Gambia Ceramic Inks Market Revenues & Volume By Food Container Printing for the Period 2022-2032F
- Gambia Ceramic Inks Import Export Trade Statistics
- Market Opportunity Assessment By Type
- Market Opportunity Assessment By Technology
- Market Opportunity Assessment By Application
- Gambia Ceramic Inks Top Companies Market Share
- Gambia Ceramic Inks Competitive Benchmarking By Technical and Operational Parameters
- Gambia Ceramic Inks Company Profiles
- Gambia Ceramic Inks Key Strategic Recommendations
Gambia Ceramic Inks Market (2026-2032): FAQs
6Wresearch actively monitors the Gambia Ceramic Inks Market and publishes its comprehensive annual report, highlighting emerging trends, growth drivers, revenue analysis, and forecast outlook. Our insights help businesses to make data-backed strategic decisions with ongoing market dynamics. Our analysts track relevent industries related to the Gambia Ceramic Inks Market, allowing our clients with actionable intelligence and reliable forecasts tailored to emerging regional needs.
Yes, we provide customisation as per your requirements. To learn more, feel free to contact us on sales@6wresearch.com
1 Executive Summary |
2 Introduction |
2.1 Key Highlights of the Report |
2.2 Report Description |
2.3 Market Scope & Segmentation |
2.4 Research Methodology |
2.5 Assumptions |
3 Gambia Ceramic Inks Market Overview |
3.1 Gambia Country Macro Economic Indicators |
3.2 Gambia Ceramic Inks Market Revenues & Volume, 2022 & 2032F |
3.3 Gambia Ceramic Inks Market - Industry Life Cycle |
3.4 Gambia Ceramic Inks Market - Porter's Five Forces |
3.5 Gambia Ceramic Inks Market Revenues & Volume Share, By Type, 2022 & 2032F |
3.6 Gambia Ceramic Inks Market Revenues & Volume Share, By Technology, 2022 & 2032F |
3.7 Gambia Ceramic Inks Market Revenues & Volume Share, By Application, 2022 & 2032F |
4 Gambia Ceramic Inks Market Dynamics |
4.1 Impact Analysis |
4.2 Market Drivers |
4.2.1 Growth in the construction industry, leading to an increased demand for ceramic tiles and inks. |
4.2.2 Rising disposable income and changing consumer preferences towards aesthetically appealing ceramic products. |
4.2.3 Technological advancements in ceramic ink formulations, leading to improved quality and durability. |
4.3 Market Restraints |
4.3.1 Fluctuating raw material prices impacting production costs. |
4.3.2 Intense competition from alternative printing technologies in the ceramic industry. |
5 Gambia Ceramic Inks Market Trends |
6 Gambia Ceramic Inks Market Segmentations |
6.1 Gambia Ceramic Inks Market, By Type |
6.1.1 Overview and Analysis |
6.1.2 Gambia Ceramic Inks Market Revenues & Volume, By Decorative , 2022-2032F |
6.1.3 Gambia Ceramic Inks Market Revenues & Volume, By Functional, 2022-2032F |
6.2 Gambia Ceramic Inks Market, By Technology |
6.2.1 Overview and Analysis |
6.2.2 Gambia Ceramic Inks Market Revenues & Volume, By Digital , 2022-2032F |
6.2.3 Gambia Ceramic Inks Market Revenues & Volume, By Analog, 2022-2032F |
6.3 Gambia Ceramic Inks Market, By Application |
6.3.1 Overview and Analysis |
6.3.2 Gambia Ceramic Inks Market Revenues & Volume, By Ceramic Tiles, 2022-2032F |
6.3.3 Gambia Ceramic Inks Market Revenues & Volume, By Glass Printing, 2022-2032F |
6.3.4 Gambia Ceramic Inks Market Revenues & Volume, By Food Container Printing, 2022-2032F |
7 Gambia Ceramic Inks Market Import-Export Trade Statistics |
7.1 Gambia Ceramic Inks Market Export to Major Countries |
7.2 Gambia Ceramic Inks Market Imports from Major Countries |
8 Gambia Ceramic Inks Market Key Performance Indicators |
8.1 Research and development investment in innovative ceramic ink formulations. |
8.2 Number of new product launches or enhancements in the ceramic inks market. |
8.3 Adoption rate of digital printing technology in the ceramic industry. |
8.4 Environmental sustainability initiatives in ceramic ink manufacturing processes. |
9 Gambia Ceramic Inks Market - Opportunity Assessment |
9.1 Gambia Ceramic Inks Market Opportunity Assessment, By Type, 2022 & 2032F |
9.2 Gambia Ceramic Inks Market Opportunity Assessment, By Technology, 2022 & 2032F |
9.3 Gambia Ceramic Inks Market Opportunity Assessment, By Application, 2022 & 2032F |
10 Gambia Ceramic Inks Market - Competitive Landscape |
10.1 Gambia Ceramic Inks Market Revenue Share, By Companies, 2025 |
10.2 Gambia Ceramic Inks Market Competitive Benchmarking, By Operating and Technical Parameters |
11 Company Profiles |
12 Recommendations | 13 Disclaimer |
Global Go To Market Strategy - 2030
Export potential enables firms to identify high-growth global markets with greater confidence by combining advanced trade intelligence with a structured quantitative methodology. The framework analyzes emerging demand trends and country-level import patterns while integrating macroeconomic and trade datasets such as GDP and population forecasts, bilateral import–export flows, tariff structures, elasticity differentials between developed and developing economies, geographic distance, and import demand projections. Using weighted trade values from 2020–2024 as the base period to project country-to-country export potential for 2030, these inputs are operationalized through calculated drivers such as gravity model parameters, tariff impact factors, and projected GDP per-capita growth. Through an analysis of hidden potentials, demand hotspots, and market conditions that are most favorable to success, this method enables firms to focus on target countries, maximize returns, and global expansion with data, backed by accuracy.
By factoring in the projected importer demand gap that is currently unmet and could be potential opportunity, it identifies the potential for the Exporter (Country) among 190 countries, against the general trade analysis, which identifies the biggest importer or exporter.
To discover high-growth global markets and optimize your business strategy:
Click Here
Pricing
- Single User License$ 1,995
- Department License$ 2,400
- Site License$ 3,120
- Global License$ 3,795

Leadership Perspectives from Industry Events
Search
Thought Leadership and Analyst Meet


Our Clients
6WResearch In News
- Doha a strategic location for EV manufacturing hub: IPA Qatar
- Demand for luxury TVs surging in the GCC, says Samsung
- Empowering Growth: The Thriving Journey of Bangladesh’s Cable Industry
- Demand for luxury TVs surging in the GCC, says Samsung
- Video call with a traditional healer? Once unthinkable, it’s now common in South Africa
- Intelligent Buildings To Smooth GCC’s Path To Net Zero
Latest Reports
- Taiwan Airport Wireless Infrastructure Market (2026-2032)
- Vietnam Airport Wireless Infrastructure Market (2026-2032)
- Thailand Airport Wireless Infrastructure Market (2026-2032)
- South Korea Airport Wireless Infrastructure Market (2026-2032)
- Romania Airport Wireless Infrastructure Market (2026-2032)
- Qatar Airport Wireless Infrastructure Market (2026-2032)
- Philippines Airport Wireless Infrastructure Market (2026-2032)
- Japan Airport Wireless Infrastructure Market (2026-2032)
- Taiwan Airport Winter Services Market (2026-2032)
- Vietnam Airport Winter Services Market (2026-2032)
Industry Events and Analyst Meet

HIMTEX 2026

India Refining Summit 2026

India EV Show 2026

EV tech India Expo 2026

Auto Tech Asia 2026
Whitepaper
- Middle East & Africa Commercial Security Market Click here to view more.
- Middle East & Africa Fire Safety Systems & Equipment Market Click here to view more.
- GCC Drone Market Click here to view more.
- Middle East Lighting Fixture Market Click here to view more.
- GCC Physical & Perimeter Security Market Click here to view more.