Gambia Humectants Market (2026-2032) | Revenue, Segmentation, Value, Industry, Companies, Size, Outlook, Forecast, Trends, Growth, Share & Analysis
Market Forecast By Type (Sugar Alcohol, Glycerol, Alpha Hydroxy Acid & Polysaccharides, Glycols), By Application (Food & Beverages, Oral & Personal Care, Pharmaceuticals, Animal Feed), By Source (Synthetic, Natural) And Competitive Landscape
| Product Code: ETC5813980 | Publication Date: Nov 2023 | Updated Date: Mar 2026 | Product Type: Market Research Report | |
| Publisher: 6Wresearch | Author: Summon Dutta | No. of Pages: 60 | No. of Figures: 30 | No. of Tables: 5 |
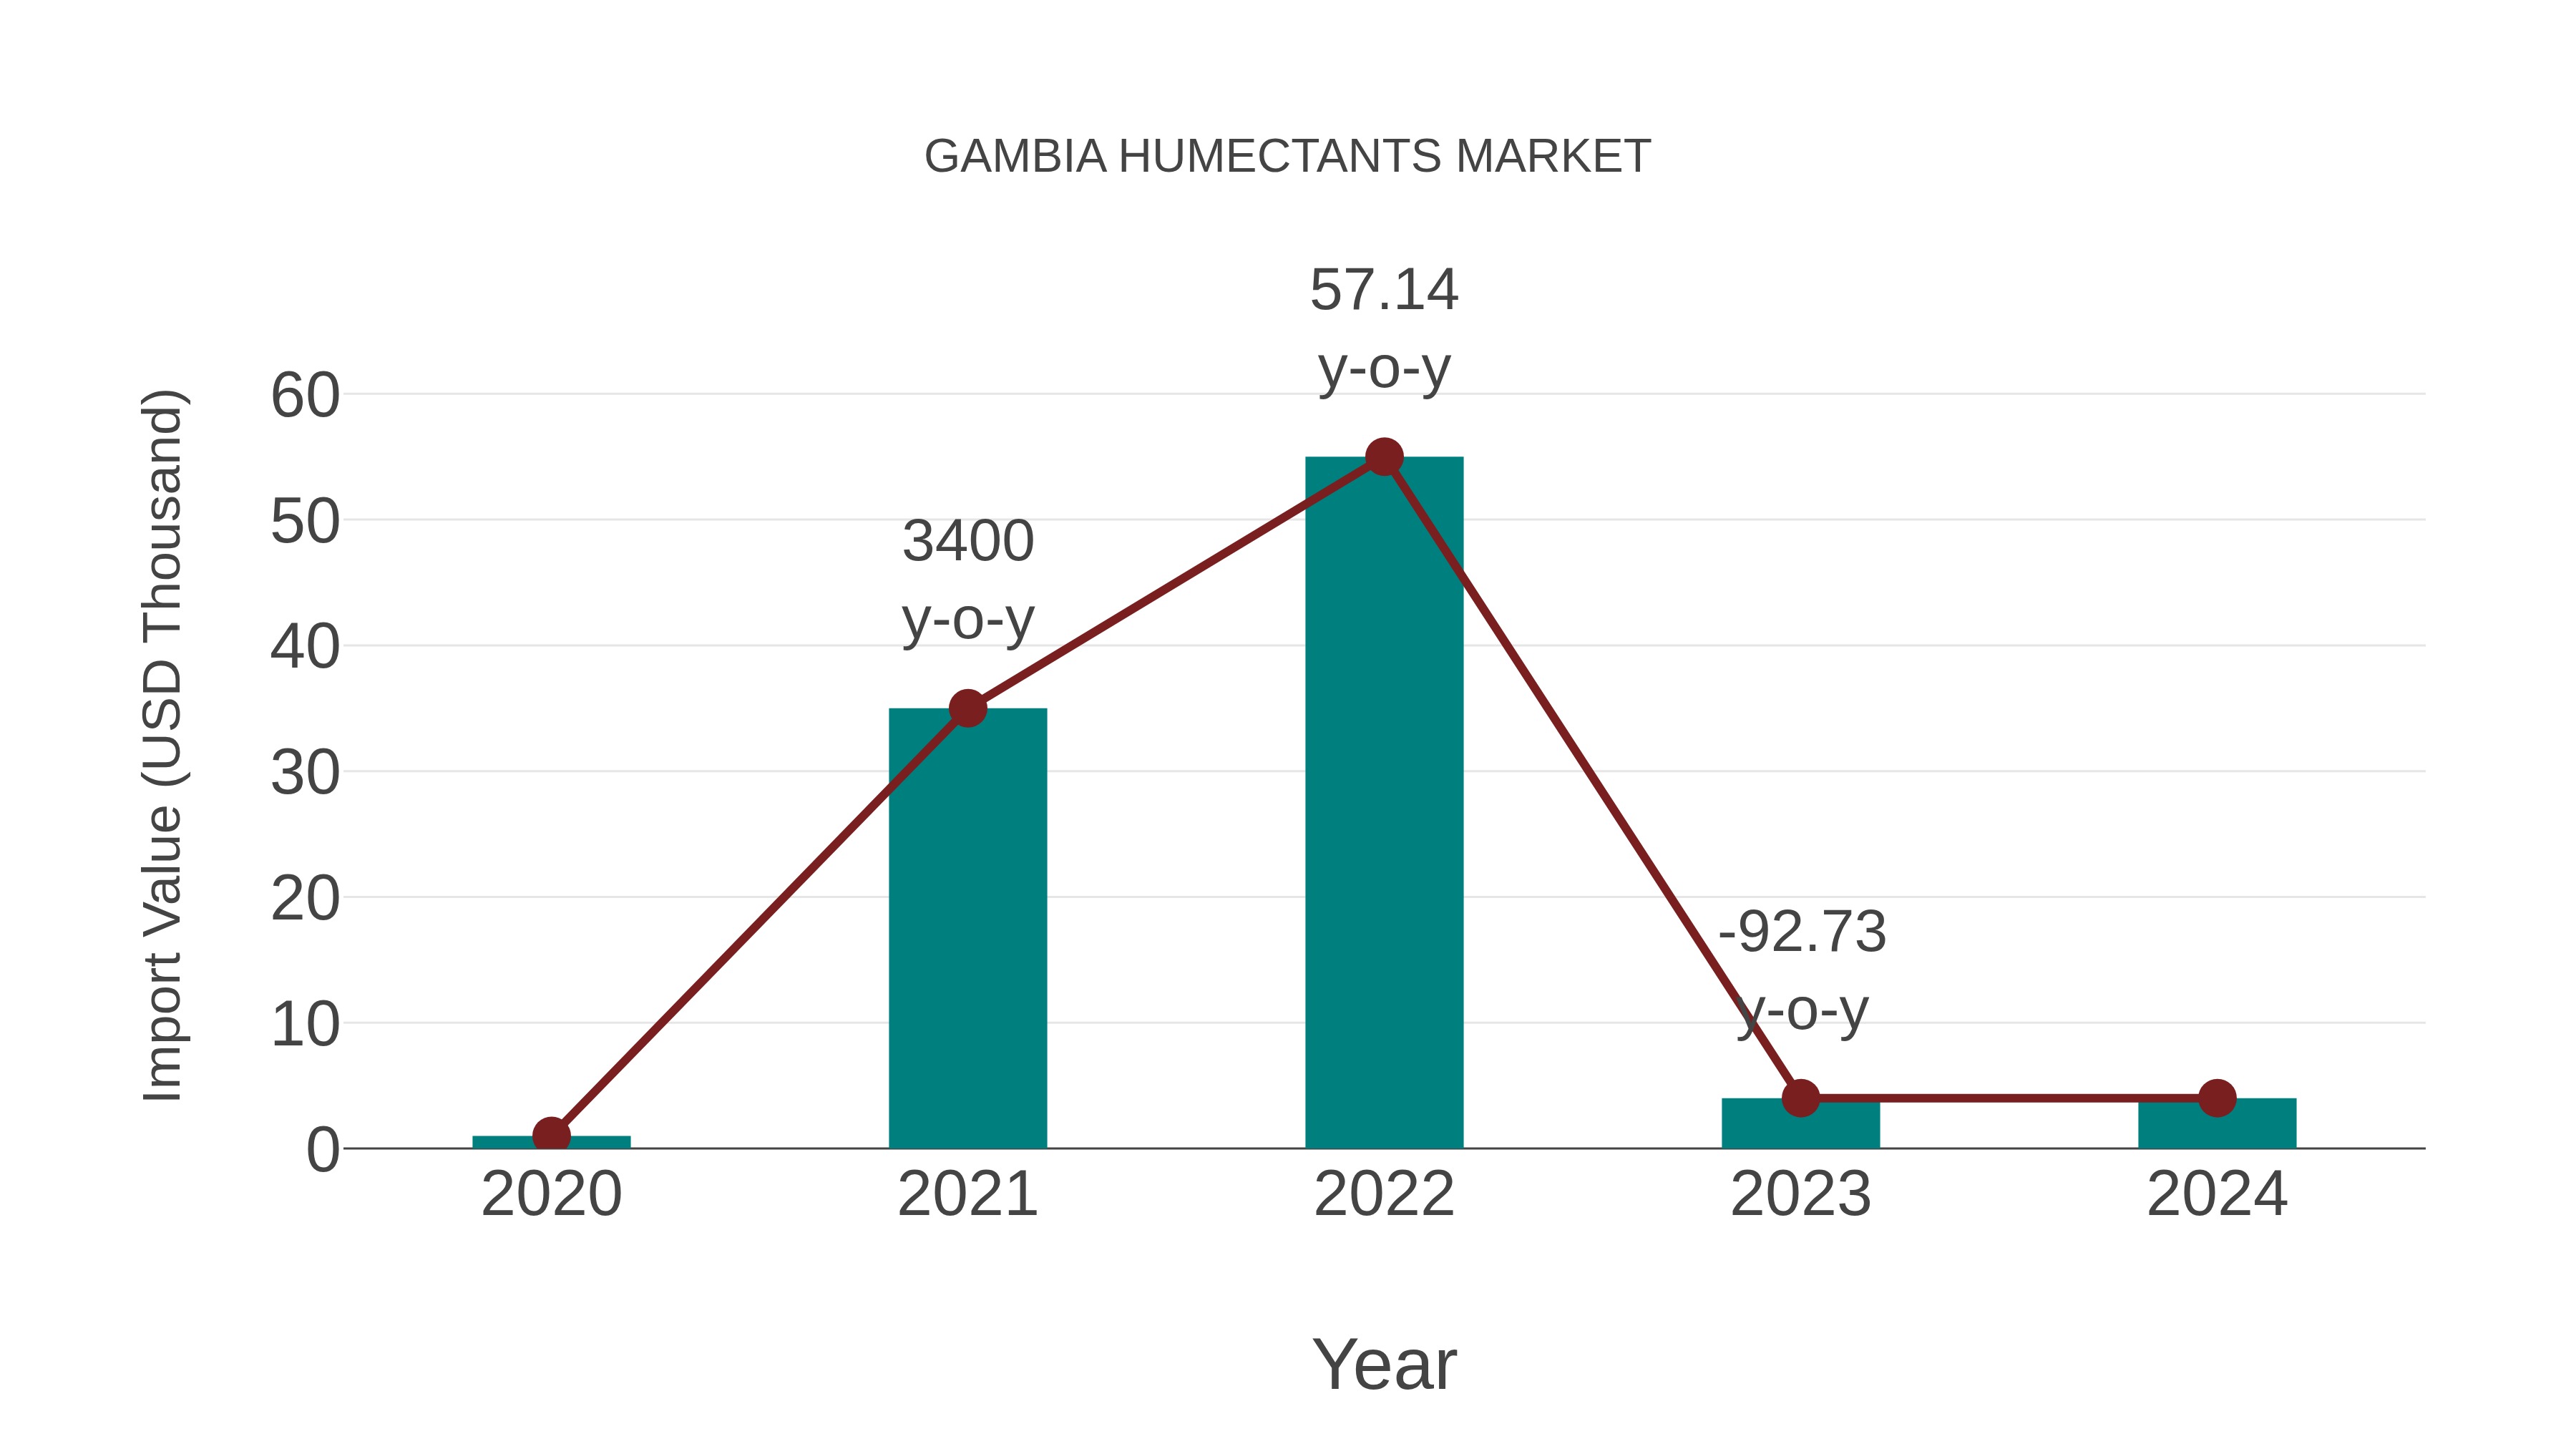
Gambia Humectants Market: Import Trend Analysis
During 2020-2024, the Gambia humectants market experienced a Compound Annual Growth Rate (CAGR) of 41.42%. Despite a zero year-on-year growth rate in 2023-2024, the overall increase in imports can be attributed to the significant growth observed in previous years within the specified period.
Gambia Humectants Market Overview
The Humectants market in Gambia is growing due to increasing demand for these substances in the food, cosmetics, and pharmaceutical industries. Humectants are essential for retaining moisture in products such as lotions, creams, and food items. As Gambias food processing and cosmetic industries continue to expand, the demand for high-quality humectants will likely rise, driving market growth.
Drivers of the market
The humectants market in Gambia is expanding due to the growing demand for moisturizing and preservation products in the cosmetics, personal care, and food industries. Humectants play a key role in maintaining moisture in skincare products, food, and beverages. As consumer awareness of skincare and health products increases, the demand for humectants as part of formulations that improve texture and shelf life is driving market growth.
Challenges of the market
The Humectants market in Gambia faces challenges due to limited local production and a high reliance on imported raw materials, which raises costs. Additionally, a lack of awareness about the benefits of humectants in the food and cosmetics industries restricts their widespread adoption.
Government Policy of the market
The humectants market in Gambia is closely linked to industries such as food, cosmetics, and pharmaceuticals. The government has been promoting industrial growth and the diversification of local production, including the manufacturing of consumer goods. As the economy develops and industries such as food processing and cosmetics expand, the demand for humectants as key ingredients will increase, contributing to market growth.
Key Highlights of the Report:
- Gambia Humectants Market Outlook
- Market Size of Gambia Humectants Market, 2025
- Forecast of Gambia Humectants Market, 2032
- Historical Data and Forecast of Gambia Humectants Revenues & Volume for the Period 2022-2032F
- Gambia Humectants Market Trend Evolution
- Gambia Humectants Market Drivers and Challenges
- Gambia Humectants Price Trends
- Gambia Humectants Porter`s Five Forces
- Gambia Humectants Industry Life Cycle
- Historical Data and Forecast of Gambia Humectants Market Revenues & Volume By Type for the Period 2022-2032F
- Historical Data and Forecast of Gambia Humectants Market Revenues & Volume By Sugar Alcohol for the Period 2022-2032F
- Historical Data and Forecast of Gambia Humectants Market Revenues & Volume By Glycerol for the Period 2022-2032F
- Historical Data and Forecast of Gambia Humectants Market Revenues & Volume By Alpha Hydroxy Acid & Polysaccharides for the Period 2022-2032F
- Historical Data and Forecast of Gambia Humectants Market Revenues & Volume By Glycols for the Period 2022-2032F
- Historical Data and Forecast of Gambia Humectants Market Revenues & Volume By Application for the Period 2022-2032F
- Historical Data and Forecast of Gambia Humectants Market Revenues & Volume By Food & Beverages for the Period 2022-2032F
- Historical Data and Forecast of Gambia Humectants Market Revenues & Volume By Oral & Personal Care for the Period 2022-2032F
- Historical Data and Forecast of Gambia Humectants Market Revenues & Volume By Pharmaceuticals for the Period 2022-2032F
- Historical Data and Forecast of Gambia Humectants Market Revenues & Volume By Animal Feed for the Period 2022-2032F
- Historical Data and Forecast of Gambia Humectants Market Revenues & Volume By Source for the Period 2022-2032F
- Historical Data and Forecast of Gambia Humectants Market Revenues & Volume By Synthetic for the Period 2022-2032F
- Historical Data and Forecast of Gambia Humectants Market Revenues & Volume By Natural for the Period 2022-2032F
- Gambia Humectants Import Export Trade Statistics
- Market Opportunity Assessment By Type
- Market Opportunity Assessment By Application
- Market Opportunity Assessment By Source
- Gambia Humectants Top Companies Market Share
- Gambia Humectants Competitive Benchmarking By Technical and Operational Parameters
- Gambia Humectants Company Profiles
- Gambia Humectants Key Strategic Recommendations
Gambia Humectants Market (2026-2032): FAQs
6Wresearch actively monitors the Gambia Humectants Market and publishes its comprehensive annual report, highlighting emerging trends, growth drivers, revenue analysis, and forecast outlook. Our insights help businesses to make data-backed strategic decisions with ongoing market dynamics. Our analysts track relevent industries related to the Gambia Humectants Market, allowing our clients with actionable intelligence and reliable forecasts tailored to emerging regional needs.
Yes, we provide customisation as per your requirements. To learn more, feel free to contact us on sales@6wresearch.com
1 Executive Summary |
2 Introduction |
2.1 Key Highlights of the Report |
2.2 Report Description |
2.3 Market Scope & Segmentation |
2.4 Research Methodology |
2.5 Assumptions |
3 Gambia Humectants Market Overview |
3.1 Gambia Country Macro Economic Indicators |
3.2 Gambia Humectants Market Revenues & Volume, 2022 & 2032F |
3.3 Gambia Humectants Market - Industry Life Cycle |
3.4 Gambia Humectants Market - Porter's Five Forces |
3.5 Gambia Humectants Market Revenues & Volume Share, By Type, 2022 & 2032F |
3.6 Gambia Humectants Market Revenues & Volume Share, By Application, 2022 & 2032F |
3.7 Gambia Humectants Market Revenues & Volume Share, By Source, 2022 & 2032F |
4 Gambia Humectants Market Dynamics |
4.1 Impact Analysis |
4.2 Market Drivers |
4.2.1 Increasing awareness about the benefits of using humectants in skincare products |
4.2.2 Growing demand for natural and organic ingredients in cosmetics industry |
4.2.3 Rising disposable income and changing lifestyle trends in Gambia |
4.3 Market Restraints |
4.3.1 Fluctuating prices of raw materials used in humectants production |
4.3.2 Lack of standardized regulations for labeling and marketing of humectants in Gambia |
5 Gambia Humectants Market Trends |
6 Gambia Humectants Market Segmentations |
6.1 Gambia Humectants Market, By Type |
6.1.1 Overview and Analysis |
6.1.2 Gambia Humectants Market Revenues & Volume, By Sugar Alcohol, 2022-2032F |
6.1.3 Gambia Humectants Market Revenues & Volume, By Glycerol, 2022-2032F |
6.1.4 Gambia Humectants Market Revenues & Volume, By Alpha Hydroxy Acid & Polysaccharides, 2022-2032F |
6.1.5 Gambia Humectants Market Revenues & Volume, By Glycols, 2022-2032F |
6.2 Gambia Humectants Market, By Application |
6.2.1 Overview and Analysis |
6.2.2 Gambia Humectants Market Revenues & Volume, By Food & Beverages, 2022-2032F |
6.2.3 Gambia Humectants Market Revenues & Volume, By Oral & Personal Care, 2022-2032F |
6.2.4 Gambia Humectants Market Revenues & Volume, By Pharmaceuticals, 2022-2032F |
6.2.5 Gambia Humectants Market Revenues & Volume, By Animal Feed, 2022-2032F |
6.3 Gambia Humectants Market, By Source |
6.3.1 Overview and Analysis |
6.3.2 Gambia Humectants Market Revenues & Volume, By Synthetic, 2022-2032F |
6.3.3 Gambia Humectants Market Revenues & Volume, By Natural, 2022-2032F |
7 Gambia Humectants Market Import-Export Trade Statistics |
7.1 Gambia Humectants Market Export to Major Countries |
7.2 Gambia Humectants Market Imports from Major Countries |
8 Gambia Humectants Market Key Performance Indicators |
8.1 Consumer interest and engagement with humectant-based skincare products |
8.2 Number of new product launches containing humectants |
8.3 Adoption rate of humectant-infused products in the market |
9 Gambia Humectants Market - Opportunity Assessment |
9.1 Gambia Humectants Market Opportunity Assessment, By Type, 2022 & 2032F |
9.2 Gambia Humectants Market Opportunity Assessment, By Application, 2022 & 2032F |
9.3 Gambia Humectants Market Opportunity Assessment, By Source, 2022 & 2032F |
10 Gambia Humectants Market - Competitive Landscape |
10.1 Gambia Humectants Market Revenue Share, By Companies, 2025 |
10.2 Gambia Humectants Market Competitive Benchmarking, By Operating and Technical Parameters |
11 Company Profiles |
12 Recommendations | 13 Disclaimer |
Export potential assessment - trade Analytics for 2030
Export potential enables firms to identify high-growth global markets with greater confidence by combining advanced trade intelligence with a structured quantitative methodology. The framework analyzes emerging demand trends and country-level import patterns while integrating macroeconomic and trade datasets such as GDP and population forecasts, bilateral import–export flows, tariff structures, elasticity differentials between developed and developing economies, geographic distance, and import demand projections. Using weighted trade values from 2020–2024 as the base period to project country-to-country export potential for 2030, these inputs are operationalized through calculated drivers such as gravity model parameters, tariff impact factors, and projected GDP per-capita growth. Through an analysis of hidden potentials, demand hotspots, and market conditions that are most favorable to success, this method enables firms to focus on target countries, maximize returns, and global expansion with data, backed by accuracy.
By factoring in the projected importer demand gap that is currently unmet and could be potential opportunity, it identifies the potential for the Exporter (Country) among 190 countries, against the general trade analysis, which identifies the biggest importer or exporter.
To discover high-growth global markets and optimize your business strategy:
Click Here
Pricing
- Single User License$ 1,995
- Department License$ 2,400
- Site License$ 3,120
- Global License$ 3,795

Search
Thought Leadership and Analyst Meet


Our Clients
Latest Reports
- United Kingdom (UK) Outdoor Cooking Equipment Market (2026-2032) | Investment Opportunities, Outlook, Growth, Competition, Trends, Pricing, Demand, Insights, Challenges, Drivers, Size, Restraints, segmentation, Value, Share, Forecast, Companies, Analysis, Revenue, Strategy
- United Arab Emirates (UAE) Outdoor Cooking Equipment Market (2026-2032) | Challenges, Value, Restraints, Growth, Competition, Revenue, Trends, Outlook, Analysis, Drivers, Share, Investment Opportunities, Strategy, Demand, Companies, Forecast, Pricing, segmentation, Size, Insights
- Vietnam Outdoor Cooking Equipment Market (2026-2032) | Demand, Investment Opportunities, Growth, Pricing, Trends, Restraints, Competition, Outlook, Drivers, Strategy, Challenges, Revenue, Analysis, segmentation, Value, Size, Share, Insights, Companies, Forecast
- Venezuela Outdoor Cooking Equipment Market (2026-2032) | Challenges, Revenue, Demand, Value, Pricing, Strategy, Competition, Analysis, Companies, Insights, Growth, Outlook, Forecast, Size, Restraints, segmentation, Drivers, Trends, Investment Opportunities, Share
- Uganda Outdoor Cooking Equipment Market (2026-2032) | Drivers, Pricing, Challenges, Value, Growth, Companies, segmentation, Strategy, Analysis, Demand, Outlook, Size, Competition, Restraints, Revenue, Forecast, Investment Opportunities, Insights, Trends, Share
- Turkey Outdoor Cooking Equipment Market (2026-2032) | Size, Competition, Outlook, Strategy, Forecast, Drivers, Trends, Companies, Revenue, Growth, Analysis, segmentation, Insights, Pricing, Restraints, Demand, Investment Opportunities, Value, Share, Challenges
- Tunisia Outdoor Cooking Equipment Market (2026-2032) | Analysis, Share, Pricing, Trends, Size, Outlook, Revenue, segmentation, Demand, Insights, Investment Opportunities, Restraints, Growth, Forecast, Competition, Drivers, Challenges, Companies, Strategy, Value
- Thailand Outdoor Cooking Equipment Market (2026-2032) | Growth, Revenue, Insights, Companies, Drivers, Strategy, Forecast, Size, Analysis, segmentation, Trends, Challenges, Competition, Share, Investment Opportunities, Demand, Pricing, Value, Restraints, Outlook
- Tanzania Outdoor Cooking Equipment Market (2026-2032) | Share, Drivers, Forecast, Revenue, Growth, Outlook, Analysis, Investment Opportunities, Restraints, segmentation, Demand, Pricing, Size, Insights, Challenges, Competition, Companies, Value, Trends, Strategy
- Tajikistan Outdoor Cooking Equipment Market (2026-2032) | Value, Pricing, Companies, Share, Strategy, Revenue, Investment Opportunities, Demand, Forecast, Size, Competition, Challenges, Growth, Insights, Restraints, segmentation, Analysis, Trends, Drivers, Outlook
Industry Events and Analyst Meet

HIMTEX 2026

India Refining Summit 2026

India EV Show 2026

EV tech India Expo 2026

Auto Tech Asia 2026
Whitepaper
- Middle East & Africa Commercial Security Market Click here to view more.
- Middle East & Africa Fire Safety Systems & Equipment Market Click here to view more.
- GCC Drone Market Click here to view more.
- Middle East Lighting Fixture Market Click here to view more.
- GCC Physical & Perimeter Security Market Click here to view more.
6WResearch In News
- Doha a strategic location for EV manufacturing hub: IPA Qatar
- Demand for luxury TVs surging in the GCC, says Samsung
- Empowering Growth: The Thriving Journey of Bangladesh’s Cable Industry
- Demand for luxury TVs surging in the GCC, says Samsung
- Video call with a traditional healer? Once unthinkable, it’s now common in South Africa
- Intelligent Buildings To Smooth GCC’s Path To Net Zero