Greece Anti Static Brush Market (2026-2032) | Analysis, Revenue, Share, Forecast, Growth, Size, Outlook, Trends, Industry, Value, Companies & Segmentation
Market Forecast By Product (Toothbrush Type, Paint Brush Type, U Type, Special Type), By Application (Electronic Components, Static Charge Sensitive Products) And Competitive Landscape
| Product Code: ETC5092076 | Publication Date: Nov 2023 | Updated Date: Apr 2026 | Product Type: Market Research Report | |
| Publisher: 6Wresearch | Author: Shubham Padhi | No. of Pages: 60 | No. of Figures: 30 | No. of Tables: 5 |
Greece Anti Static Brush Market Size (2020-2030)
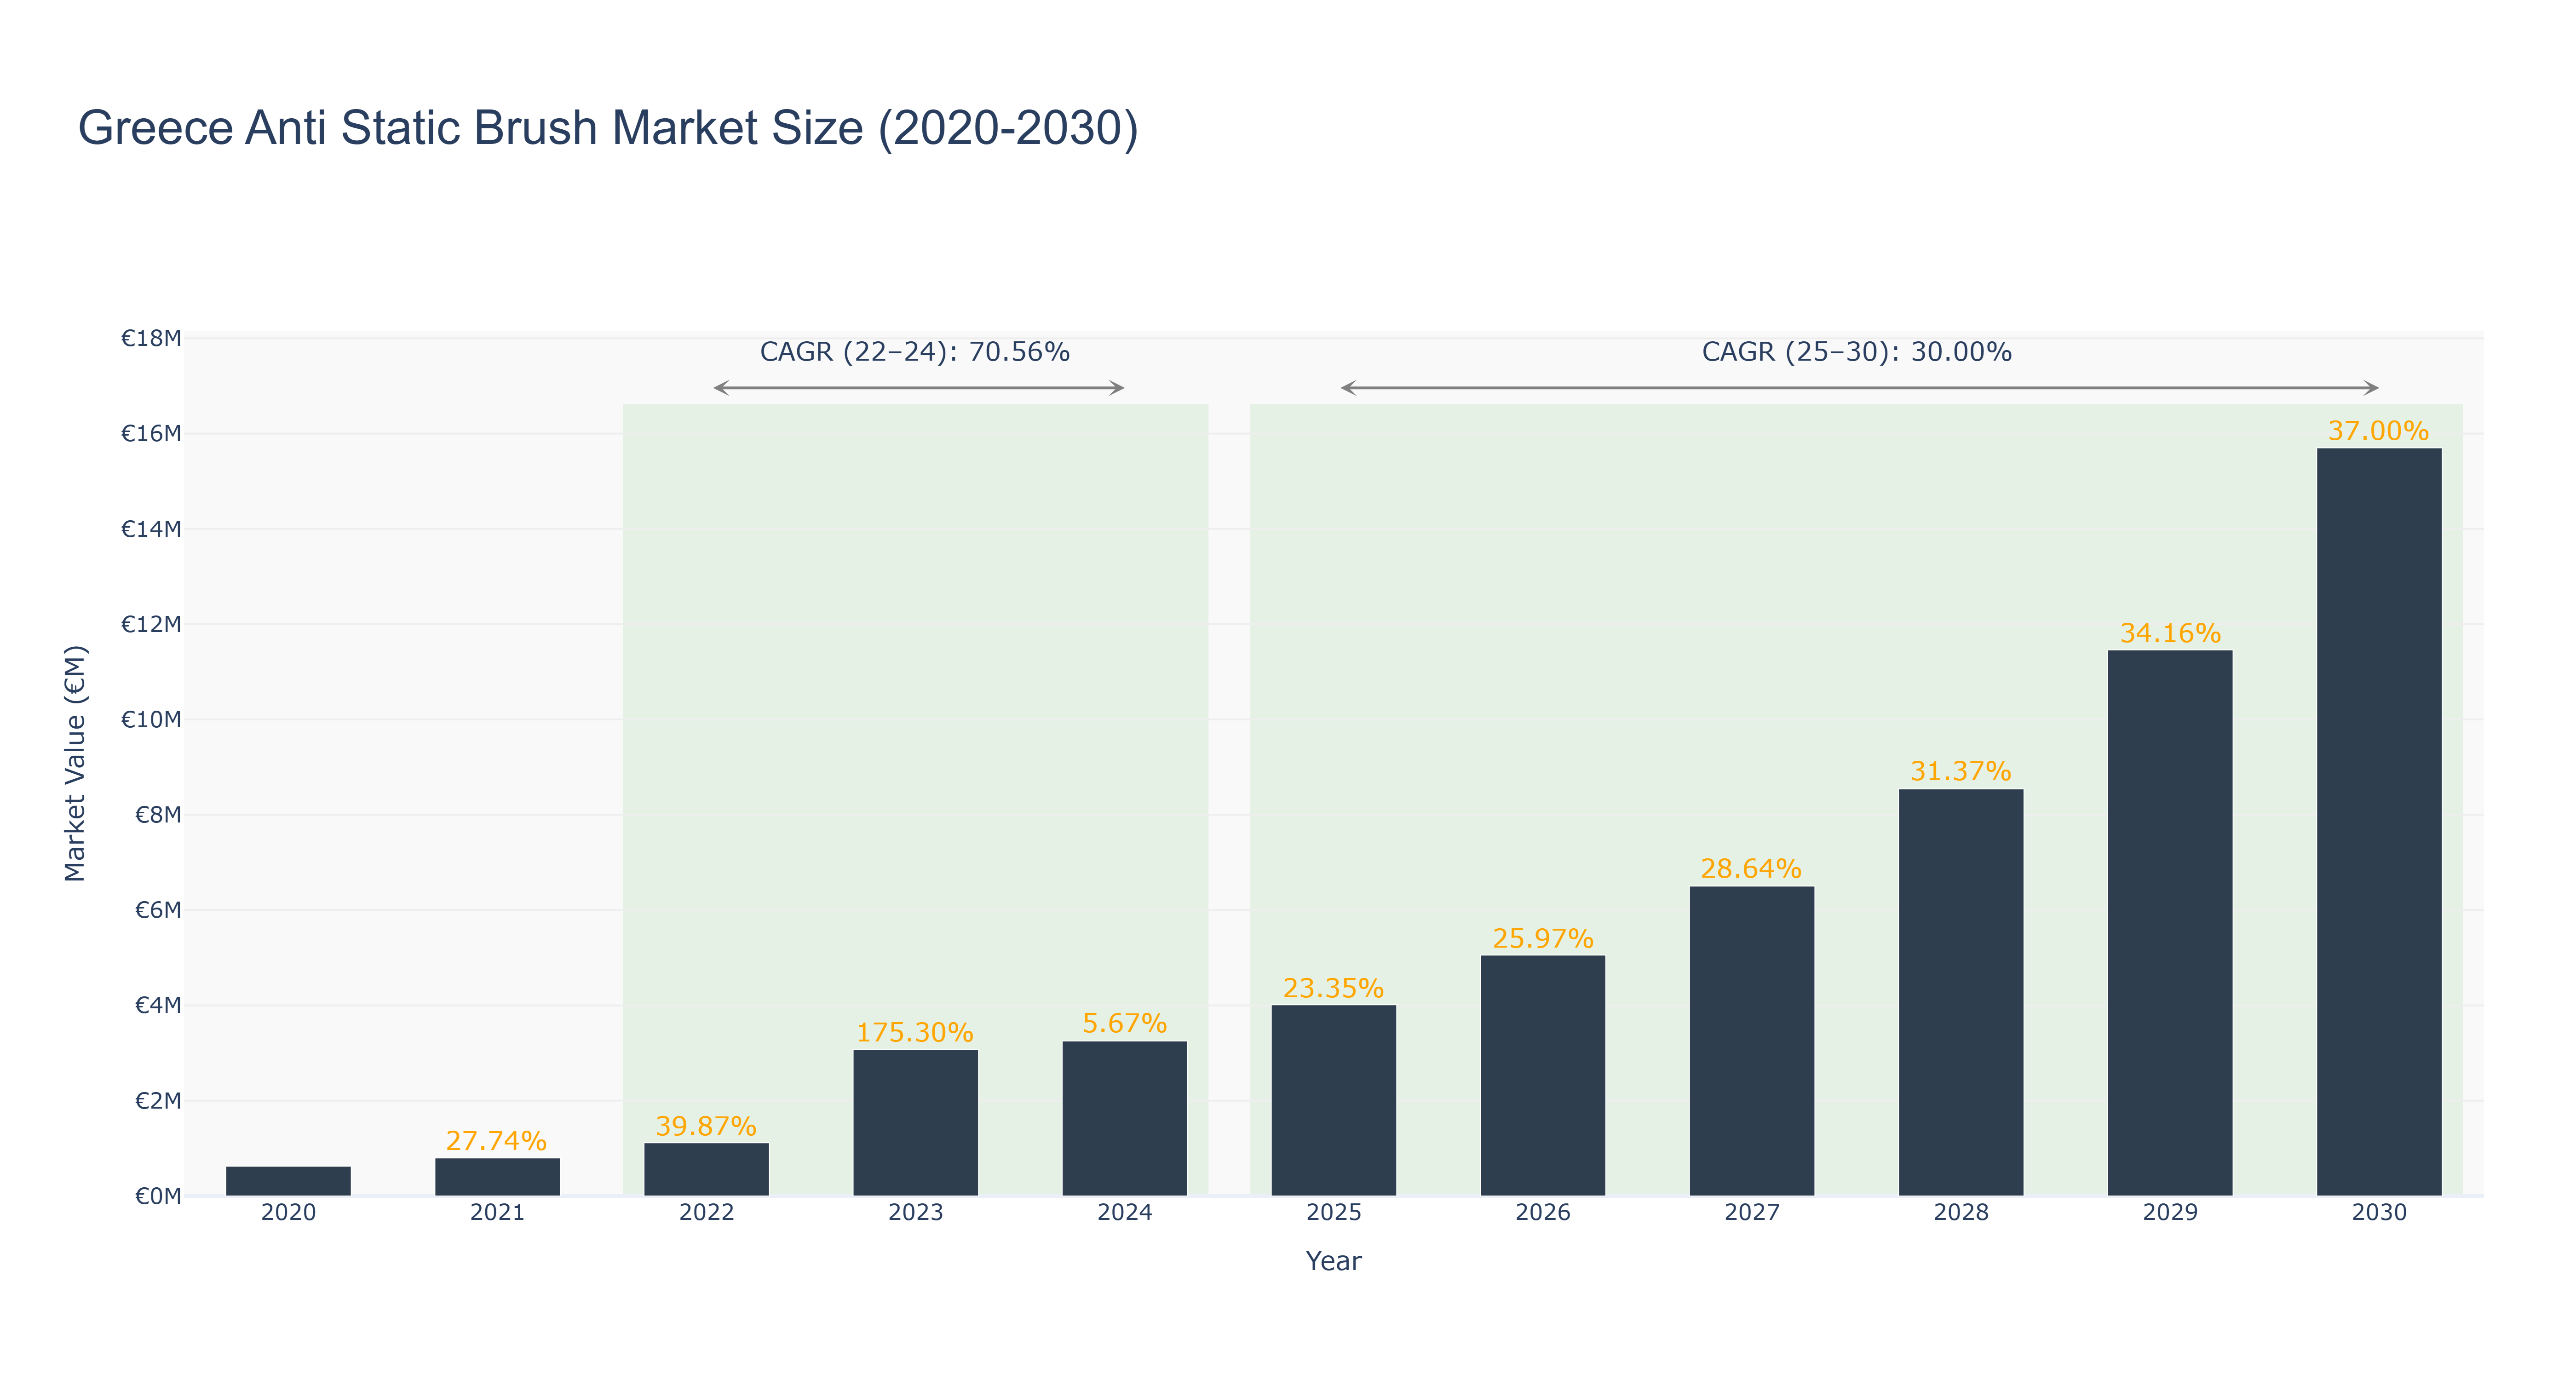
The Greece Anti Static Brush Market has shown a remarkable growth trajectory over the years. The market size peaked at €15.70 million in 2030, reflecting a steady upward trend. From 2020 to 2024, the market size increased from €0.63 million to €3.25 million, driven by a compound annual growth rate (CAGR) of 70.56%. Looking ahead, the forecasted market size from 2025 to 2030 is projected to reach €15.70 million, with a CAGR of 30.0%. The significant growth in the market can be attributed to increasing awareness about anti-static solutions and the rising demand for electronic devices in Greece. Moving forward, upcoming projects in the country's technology sector are expected to further boost the demand for anti-static products, indicating a promising future for the Greece Anti Static Brush Market.
Greece Anti Static Brush Market: Production & Trade Performance (2019-2025)
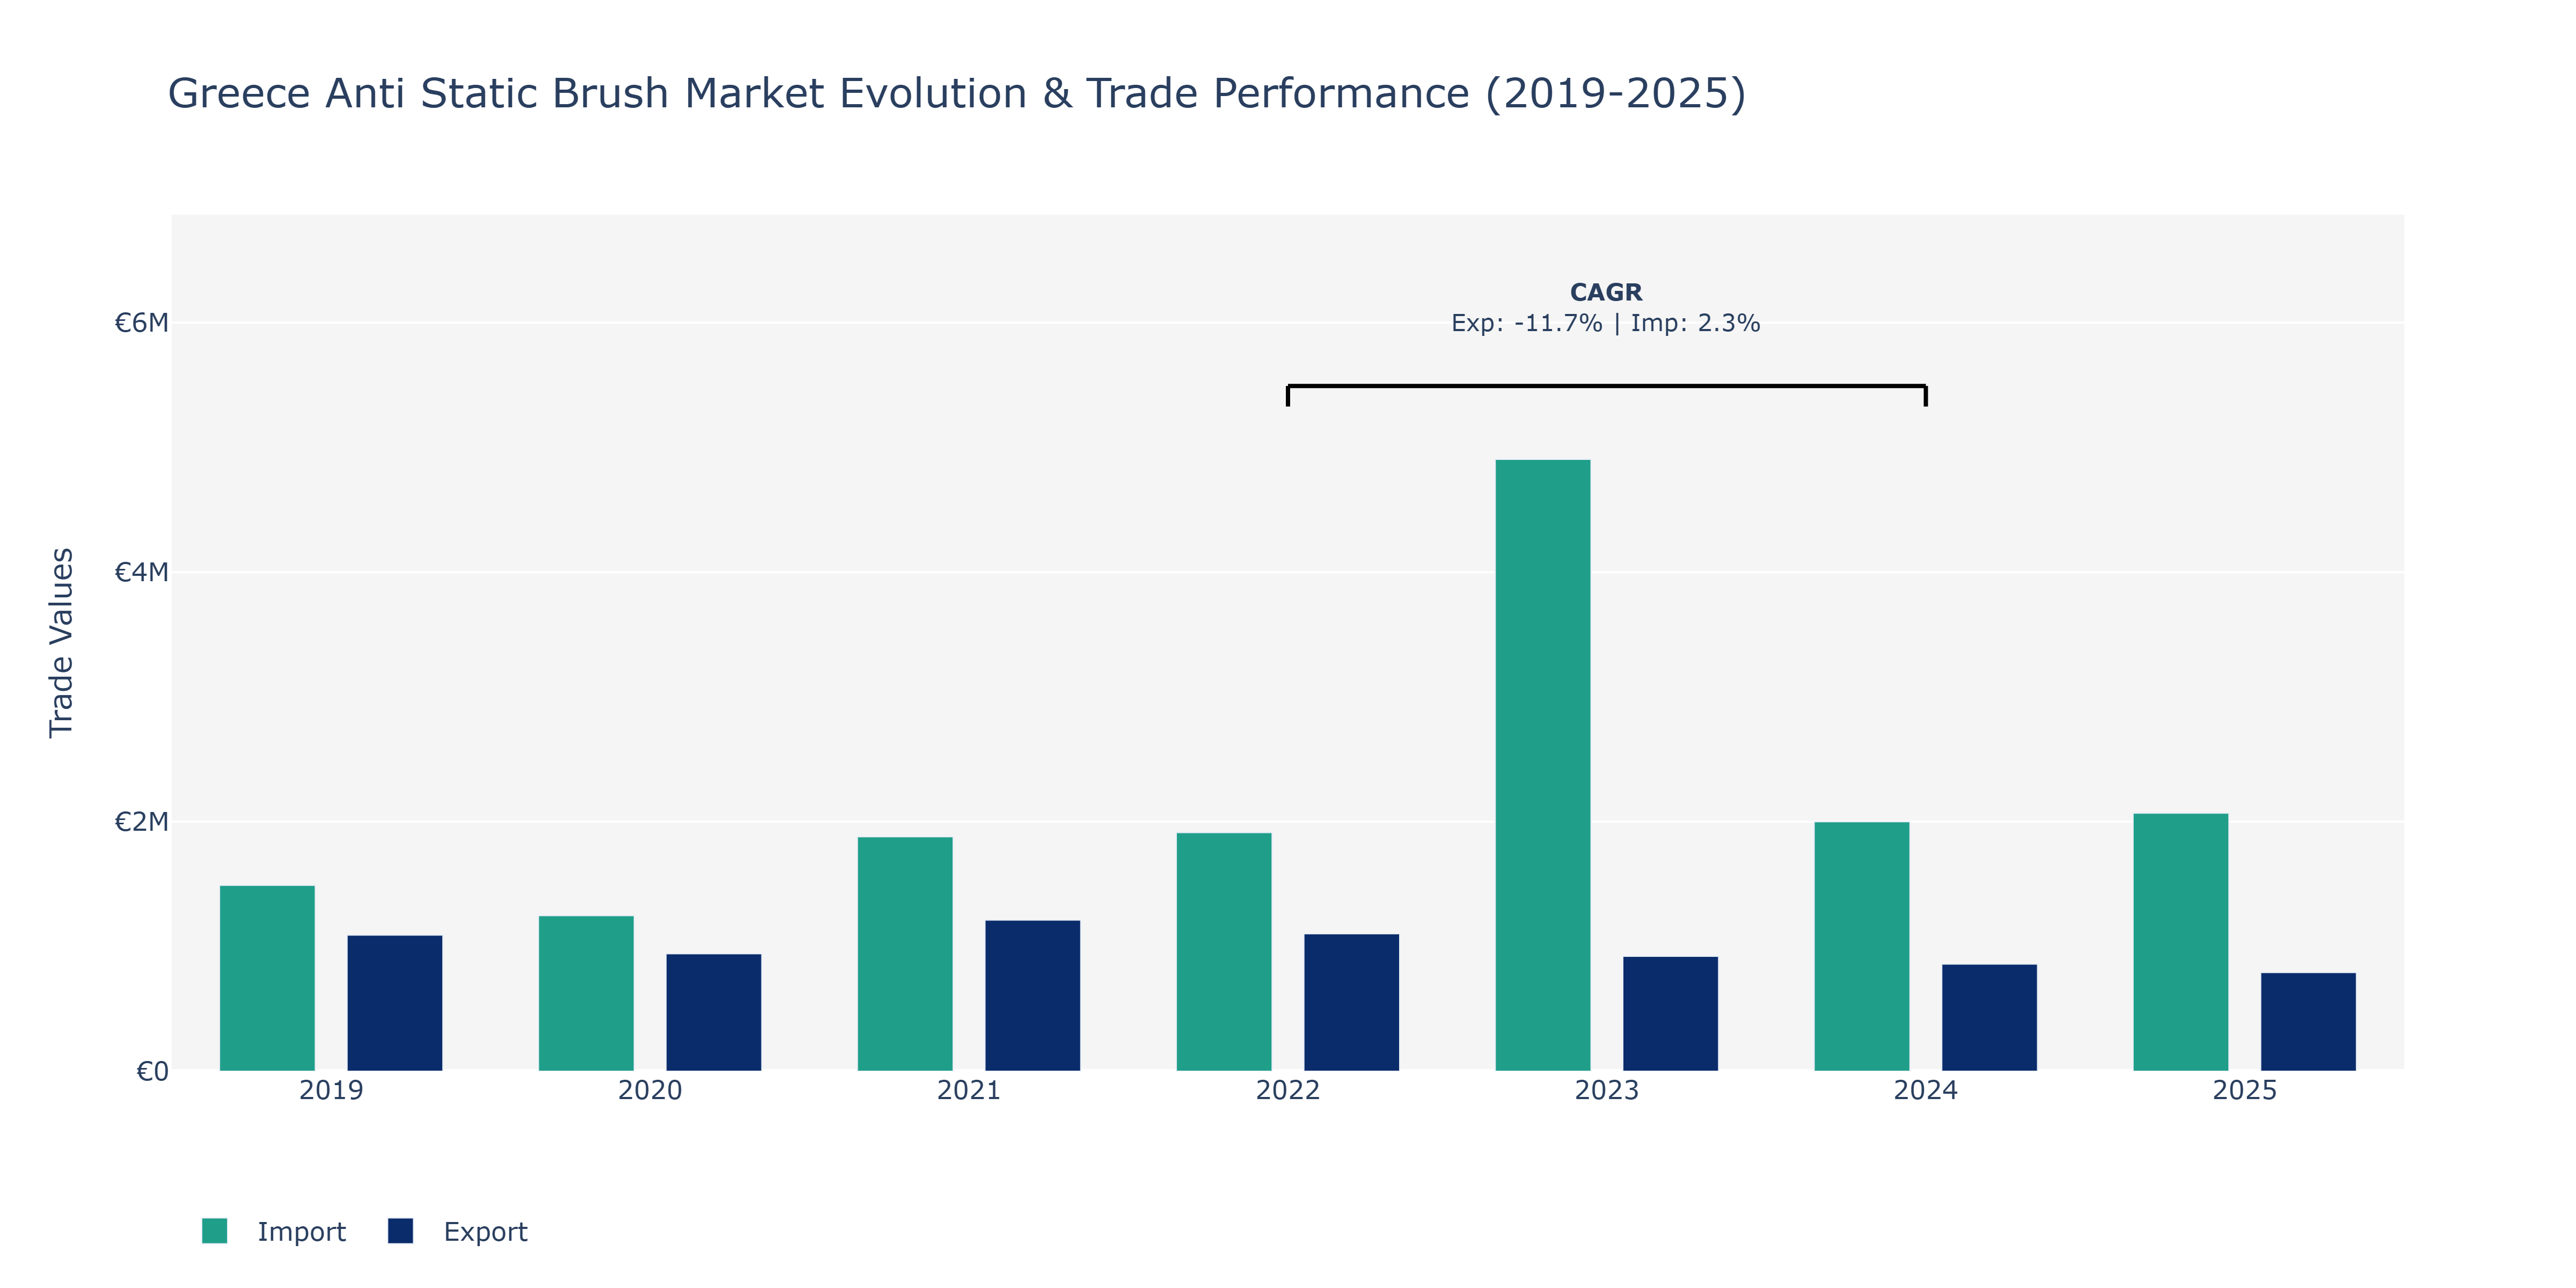
The Greece Anti Static Brush Market saw varied trends in Exports and Imports over the years. In 2019, Exports stood at €1.09 million, whereas Imports were at €1.49 million, indicating a strong trade volume. However, both Exports and Imports experienced a decline in 2020, dropping to €941.15 thousand and €1.25 million, respectively, possibly due to global economic uncertainties. By 2021, there was a notable recovery, with Exports reaching €1.21 million and Imports climbing to €1.88 million, reflecting improved market conditions and increased demand. The year 2023 witnessed a significant surge in Imports to €4.9 million, potentially driven by supply chain disruptions or heightened domestic consumption. Despite a slight decrease in Exports and Imports in 2024, the market remained active. The year 2025 showed a continuation of this downward trend, which might necessitate market players to reassess their strategies to maintain competitiveness in the evolving landscape.
Key Highlights of the Report:
- Greece Anti Static Brush Market Outlook
- Market Size of Greece Anti Static Brush Market, 2025
- Forecast of Greece Anti Static Brush Market, 2032
- Historical Data and Forecast of Greece Anti Static Brush Revenues & Volume for the Period 2022-2032F
- Greece Anti Static Brush Market Trend Evolution
- Greece Anti Static Brush Market Drivers and Challenges
- Greece Anti Static Brush Price Trends
- Greece Anti Static Brush Porter`s Five Forces
- Greece Anti Static Brush Industry Life Cycle
- Historical Data and Forecast of Greece Anti Static Brush Market Revenues & Volume By Product for the Period 2022-2032F
- Historical Data and Forecast of Greece Anti Static Brush Market Revenues & Volume By Toothbrush Type for the Period 2022-2032F
- Historical Data and Forecast of Greece Anti Static Brush Market Revenues & Volume By Paint Brush Type for the Period 2022-2032F
- Historical Data and Forecast of Greece Anti Static Brush Market Revenues & Volume By U Type for the Period 2022-2032F
- Historical Data and Forecast of Greece Anti Static Brush Market Revenues & Volume By Special Type for the Period 2022-2032F
- Historical Data and Forecast of Greece Anti Static Brush Market Revenues & Volume By Application for the Period 2022-2032F
- Historical Data and Forecast of Greece Anti Static Brush Market Revenues & Volume By Electronic Components for the Period 2022-2032F
- Historical Data and Forecast of Greece Anti Static Brush Market Revenues & Volume By Static Charge Sensitive Products for the Period 2022-2032F
- Greece Anti Static Brush Import Export Trade Statistics
- Market Opportunity Assessment By Product
- Market Opportunity Assessment By Application
- Greece Anti Static Brush Top Companies Market Share
- Greece Anti Static Brush Competitive Benchmarking By Technical and Operational Parameters
- Greece Anti Static Brush Company Profiles
- Greece Anti Static Brush Key Strategic Recommendations
Frequently Asked Questions About the Market Study (FAQs):
6Wresearch actively monitors the Greece Anti Static Brush Market and publishes its comprehensive annual report, highlighting emerging trends, growth drivers, revenue analysis, and forecast outlook. Our insights help businesses to make data-backed strategic decisions with ongoing market dynamics. Our analysts track relevent industries related to the Greece Anti Static Brush Market, allowing our clients with actionable intelligence and reliable forecasts tailored to emerging regional needs.
Yes, we provide customisation as per your requirements. To learn more, feel free to contact us on sales@6wresearch.com
1 Executive Summary |
2 Introduction |
2.1 Key Highlights of the Report |
2.2 Report Description |
2.3 Market Scope & Segmentation |
2.4 Research Methodology |
2.5 Assumptions |
3 Greece Anti Static Brush Market Overview |
3.1 Greece Country Macro Economic Indicators |
3.2 Greece Anti Static Brush Market Revenues & Volume, 2022 & 2032F |
3.3 Greece Anti Static Brush Market - Industry Life Cycle |
3.4 Greece Anti Static Brush Market - Porter's Five Forces |
3.5 Greece Anti Static Brush Market Revenues & Volume Share, By Product, 2022 & 2032F |
3.6 Greece Anti Static Brush Market Revenues & Volume Share, By Application, 2022 & 2032F |
4 Greece Anti Static Brush Market Dynamics |
4.1 Impact Analysis |
4.2 Market Drivers |
4.2.1 Increasing demand for electronic devices and components in Greece |
4.2.2 Growing awareness about the importance of static control in manufacturing processes |
4.2.3 Stringent regulations and standards regarding static control measures in industries |
4.3 Market Restraints |
4.3.1 High initial investment required for anti-static brush technology |
4.3.2 Availability of alternative static control solutions |
4.3.3 Limited technological advancements in the anti-static brush market |
5 Greece Anti Static Brush Market Trends |
6 Greece Anti Static Brush Market Segmentations |
6.1 Greece Anti Static Brush Market, By Product |
6.1.1 Overview and Analysis |
6.1.2 Greece Anti Static Brush Market Revenues & Volume, By Toothbrush Type, 2022-2032F |
6.1.3 Greece Anti Static Brush Market Revenues & Volume, By Paint Brush Type, 2022-2032F |
6.1.4 Greece Anti Static Brush Market Revenues & Volume, By U Type, 2022-2032F |
6.1.5 Greece Anti Static Brush Market Revenues & Volume, By Special Type, 2022-2032F |
6.2 Greece Anti Static Brush Market, By Application |
6.2.1 Overview and Analysis |
6.2.2 Greece Anti Static Brush Market Revenues & Volume, By Electronic Components, 2022-2032F |
6.2.3 Greece Anti Static Brush Market Revenues & Volume, By Static Charge Sensitive Products, 2022-2032F |
7 Greece Anti Static Brush Market Import-Export Trade Statistics |
7.1 Greece Anti Static Brush Market Export to Major Countries |
7.2 Greece Anti Static Brush Market Imports from Major Countries |
8 Greece Anti Static Brush Market Key Performance Indicators |
8.1 Percentage increase in the adoption of anti-static brush technology by Greek industries |
8.2 Number of training programs or workshops conducted on static control measures |
8.3 Research and development investment in improving anti-static brush technology |
9 Greece Anti Static Brush Market - Opportunity Assessment |
9.1 Greece Anti Static Brush Market Opportunity Assessment, By Product, 2022 & 2032F |
9.2 Greece Anti Static Brush Market Opportunity Assessment, By Application, 2022 & 2032F |
10 Greece Anti Static Brush Market - Competitive Landscape |
10.1 Greece Anti Static Brush Market Revenue Share, By Companies, 2025 |
10.2 Greece Anti Static Brush Market Competitive Benchmarking, By Operating and Technical Parameters |
11 Company Profiles |
12 Recommendations | 13 Disclaimer |
Global Go To Market Strategy - 2030
Export potential enables firms to identify high-growth global markets with greater confidence by combining advanced trade intelligence with a structured quantitative methodology. The framework analyzes emerging demand trends and country-level import patterns while integrating macroeconomic and trade datasets such as GDP and population forecasts, bilateral import–export flows, tariff structures, elasticity differentials between developed and developing economies, geographic distance, and import demand projections. Using weighted trade values from 2020–2024 as the base period to project country-to-country export potential for 2030, these inputs are operationalized through calculated drivers such as gravity model parameters, tariff impact factors, and projected GDP per-capita growth. Through an analysis of hidden potentials, demand hotspots, and market conditions that are most favorable to success, this method enables firms to focus on target countries, maximize returns, and global expansion with data, backed by accuracy.
By factoring in the projected importer demand gap that is currently unmet and could be potential opportunity, it identifies the potential for the Exporter (Country) among 190 countries, against the general trade analysis, which identifies the biggest importer or exporter.
To discover high-growth global markets and optimize your business strategy:
Click Here
Pricing
- Single User License$ 1,995
- Department License$ 2,400
- Site License$ 3,120
- Global License$ 3,795

Leadership Perspectives from Industry Events
Search
Thought Leadership and Analyst Meet


Our Clients
6WResearch In News
- Doha a strategic location for EV manufacturing hub: IPA Qatar
- Demand for luxury TVs surging in the GCC, says Samsung
- Empowering Growth: The Thriving Journey of Bangladesh’s Cable Industry
- Demand for luxury TVs surging in the GCC, says Samsung
- Video call with a traditional healer? Once unthinkable, it’s now common in South Africa
- Intelligent Buildings To Smooth GCC’s Path To Net Zero
Latest Reports
- Poland Fire Protection Systems Market (2026-2032)
- Cape Verde Portable Hand-Thrown Extinguisher Market (2026-2032)
- Canada Portable Hand-Thrown Extinguisher Market (2026-2032)
- Cameroon Portable Hand-Thrown Extinguisher Market (2026-2032)
- Burundi Portable Hand-Thrown Extinguisher Market (2026-2032)
- Burkina Faso Portable Hand-Thrown Extinguisher Market (2026-2032)
- Bulgaria Portable Hand-Thrown Extinguisher Market (2026-2032)
- Brunei Portable Hand-Thrown Extinguisher Market (2026-2032)
- Botswana Portable Hand-Thrown Extinguisher Market (2026-2032)
- Bosnia and Herzegovina Portable Hand-Thrown Extinguisher Market (2026-2032)
Industry Events and Analyst Meet

HIMTEX 2026

India Refining Summit 2026

India EV Show 2026

EV tech India Expo 2026

Auto Tech Asia 2026
Whitepaper
- Middle East & Africa Commercial Security Market Click here to view more.
- Middle East & Africa Fire Safety Systems & Equipment Market Click here to view more.
- GCC Drone Market Click here to view more.
- Middle East Lighting Fixture Market Click here to view more.
- GCC Physical & Perimeter Security Market Click here to view more.