Greece Ceramics Market (2026-2032) | Growth, Segmentation, Forecast, Trends, Share, Industry, Value, Companies, Revenue, Size, Outlook & Analysis
Market Forecast By Product Types (Traditional, Advanced), By Applications (Sanitary Ware, Abrasives, Bricks and Pipes, Tiles, Pottery, Others), By End-users (Building & Construction, Industrial, Medical, Others) And Competitive Landscape
| Product Code: ETC4656102 | Publication Date: Nov 2023 | Updated Date: Apr 2026 | Product Type: Market Research Report | |
| Publisher: 6Wresearch | Author: Shubham Padhi | No. of Pages: 60 | No. of Figures: 30 | No. of Tables: 5 |
Greece Ceramics Market Size (2020-2030)
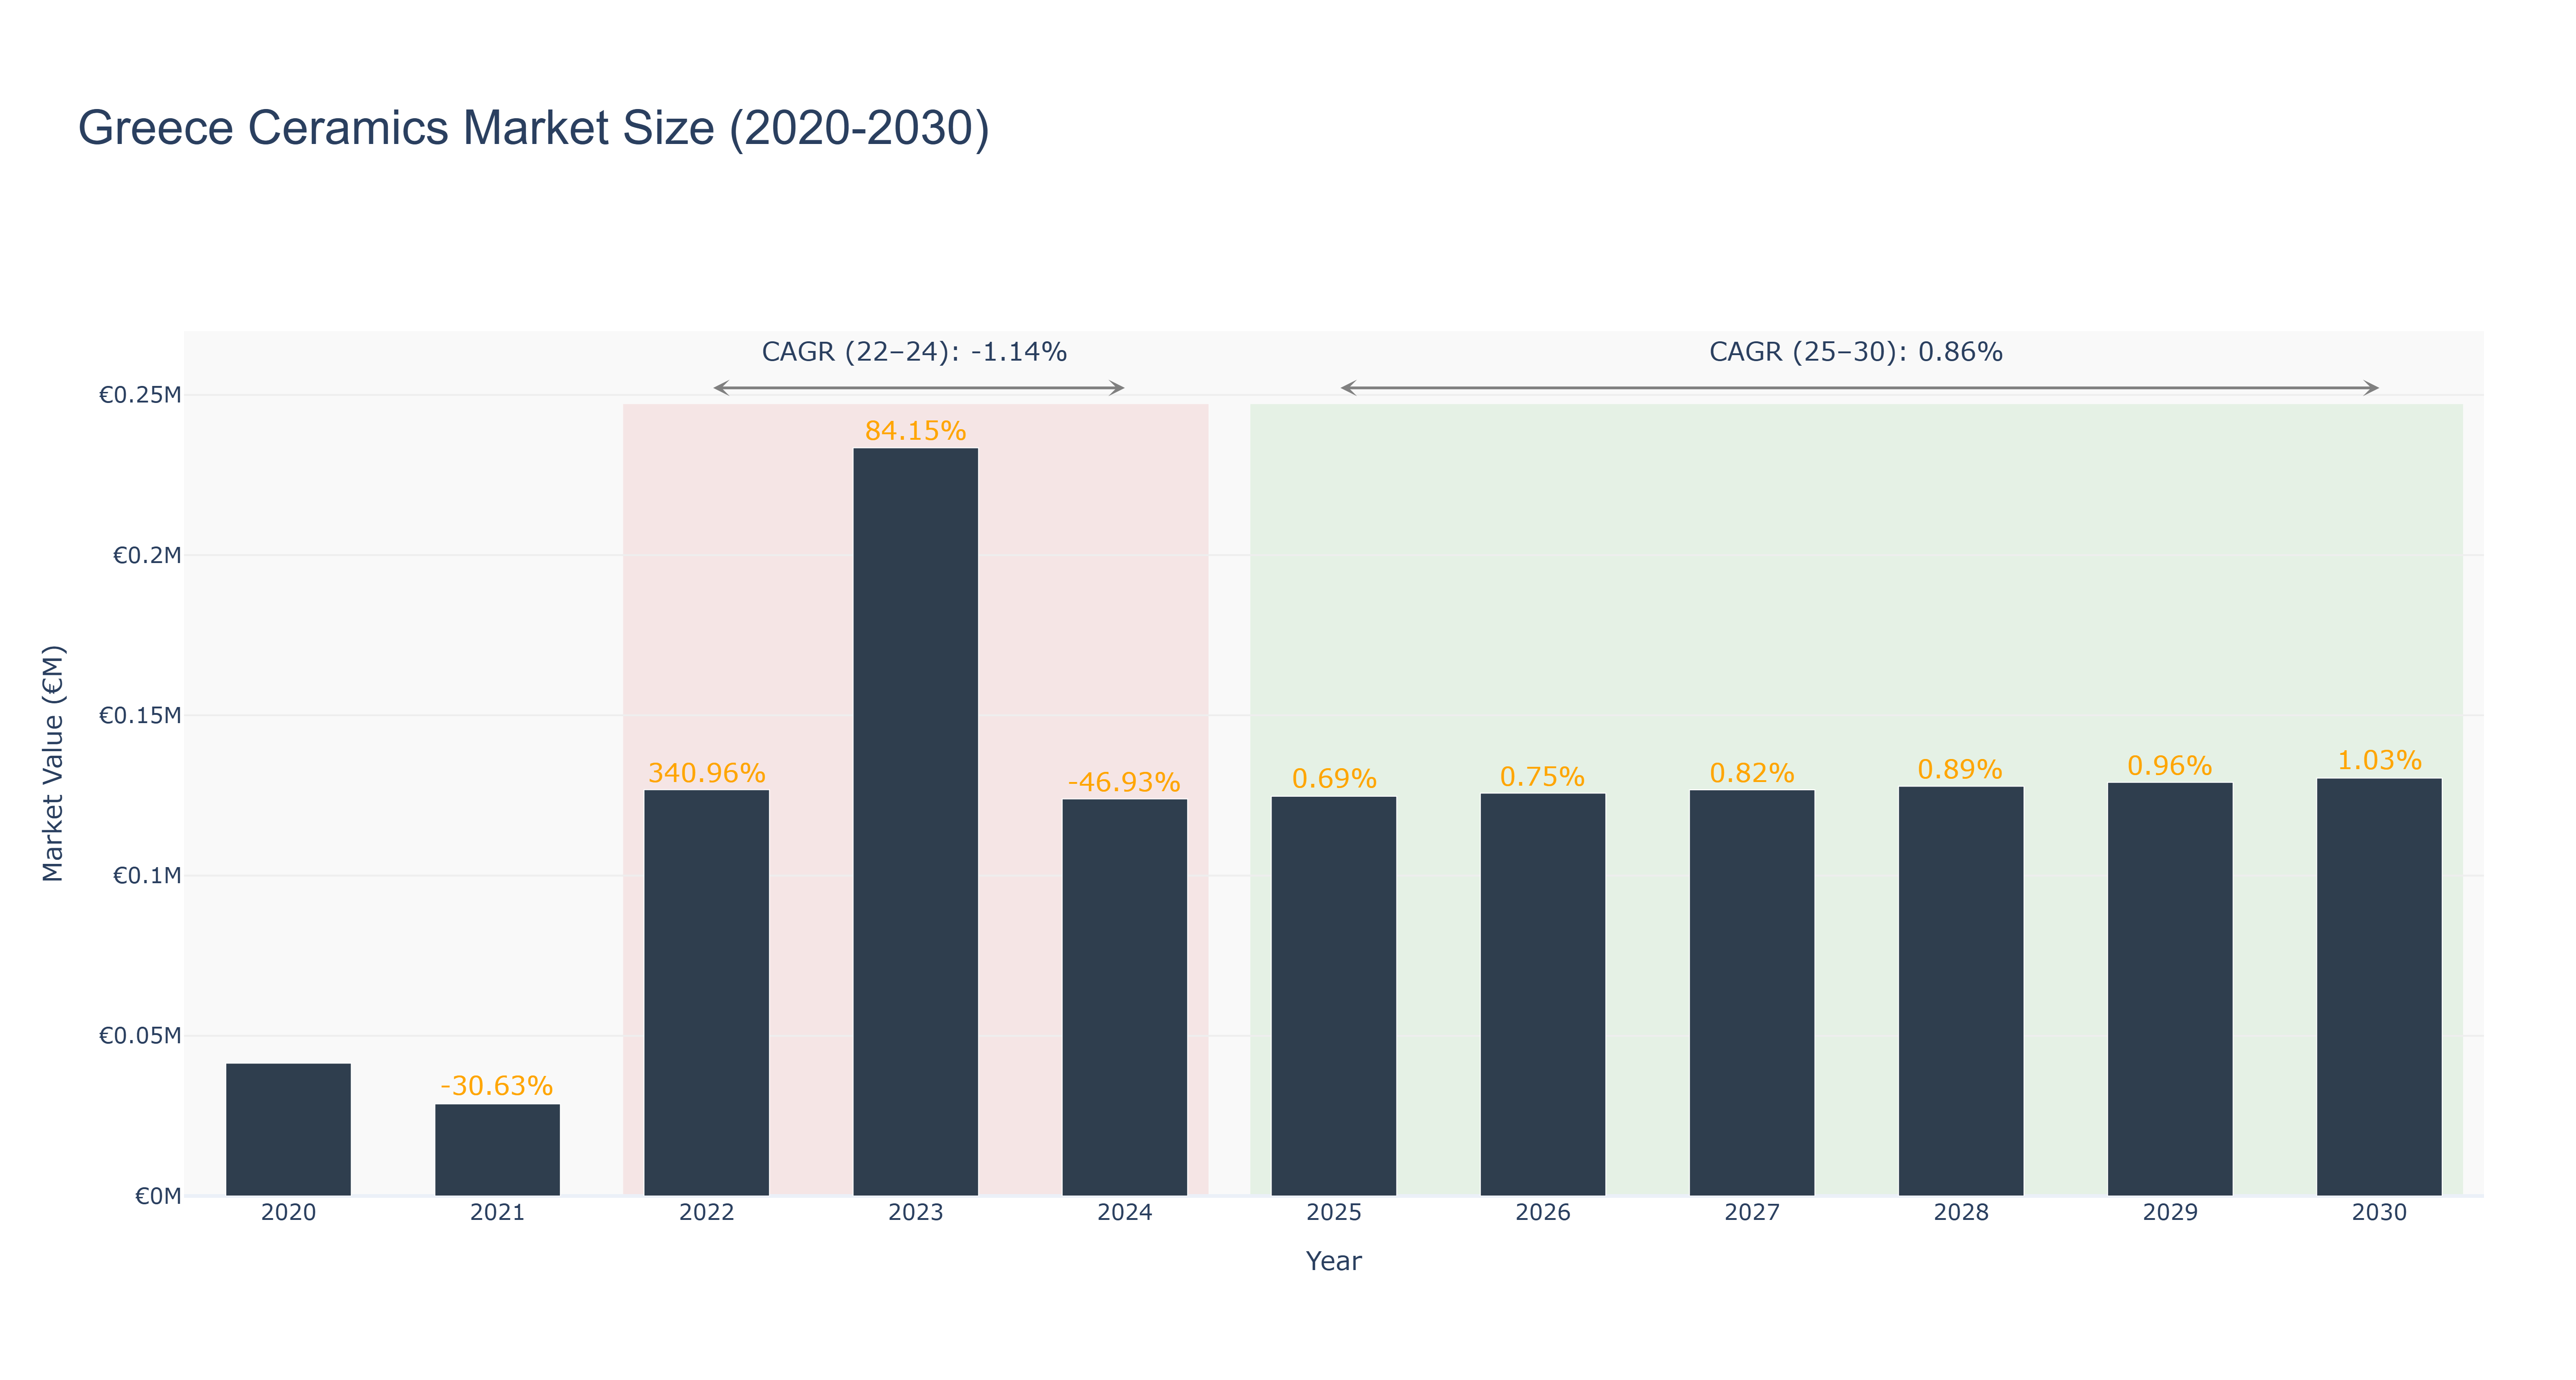
Greece Ceramics Market has shown a fluctuating trend over the years. The peak market size was in 2023 at €0.23 million, followed by a decline to €0.12 million in 2024. From 2025 to 2030, the market is forecasted to maintain a stable growth trajectory, with a CAGR of 0.86%. The market experienced a significant growth of 340.96% in 2022, possibly due to increased demand for ceramics products. The subsequent decline in 2024 could be attributed to market saturation or economic factors. Looking ahead, industry drivers such as innovation in ceramic technology and sustainability initiatives are expected to propel market growth. Recent developments in Greece's ceramics sector include collaborations with international designers to create unique product lines, indicating a promising future for the market.
Greece Ceramics Market: Production & Trade Performance (2019-2025)
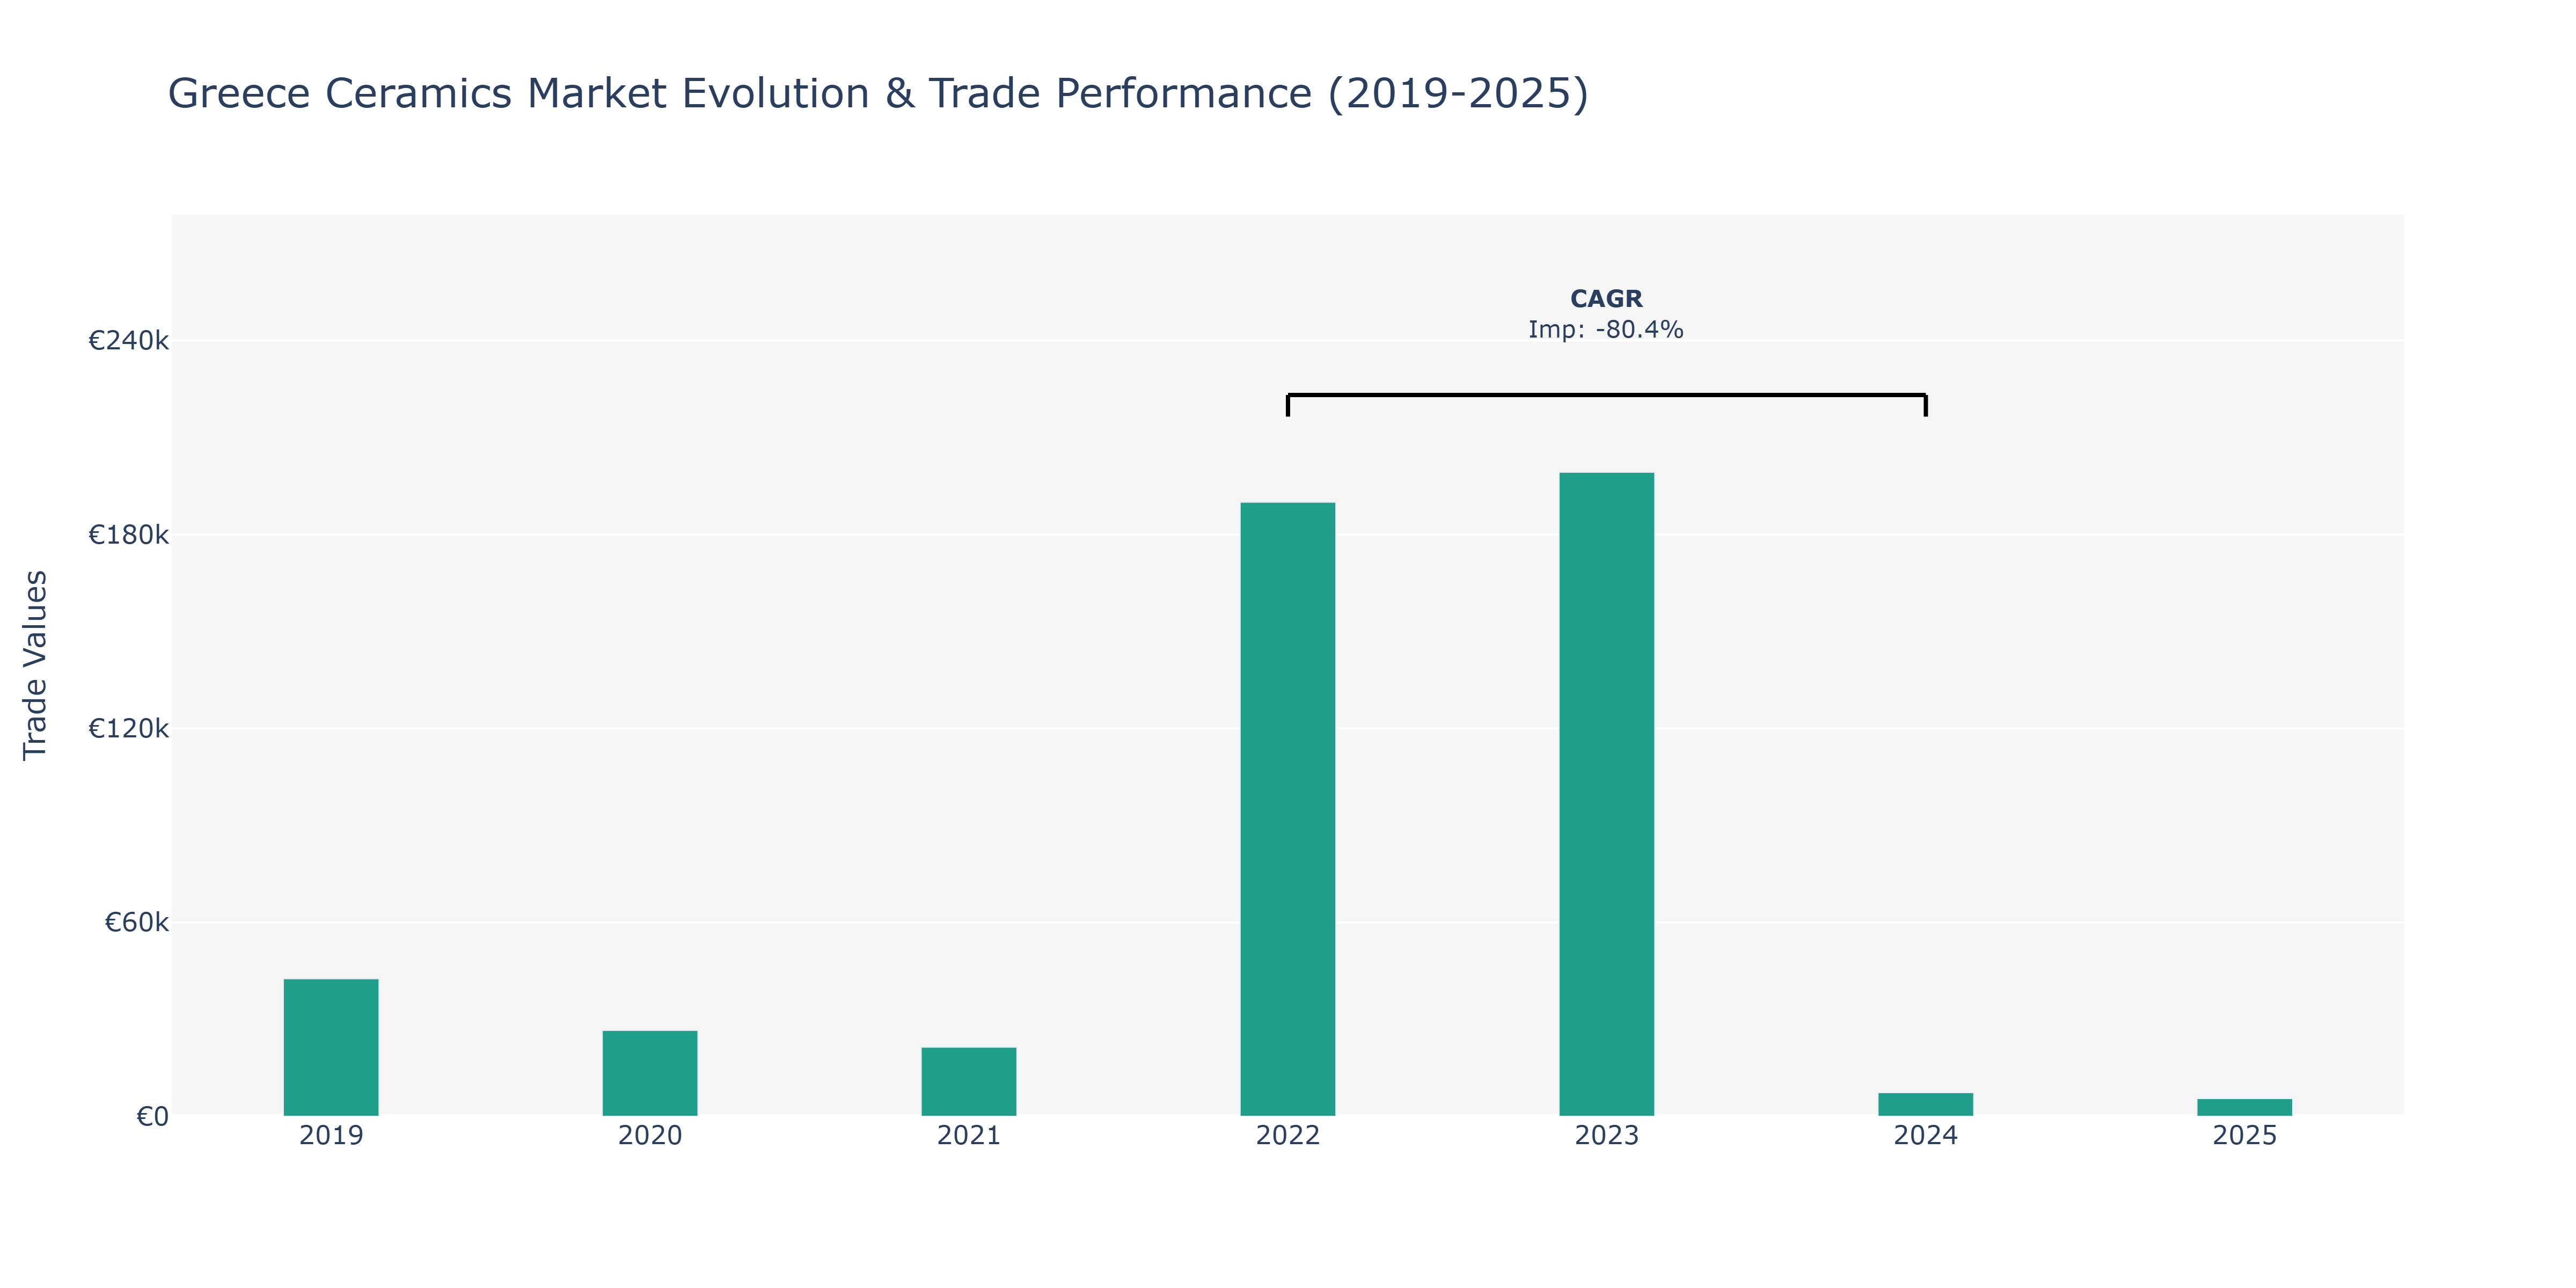
In the Greece Ceramics Market, imports exhibited notable fluctuations during the period under review. In 2019, imports stood at €42.54 thousand, showing a substantial decrease to €26.55 thousand in 2020. The downward trend continued in 2021 with imports dropping to €21.38 thousand. However, in 2022, there was a remarkable surge in imports to €189.94 thousand, marking a significant peak point. This spike was short-lived as imports sharply declined in 2024 to €7.31 thousand, reaching the lowest point in the data series. The following year, imports slightly decreased to €5.49 thousand. These fluctuations can be attributed to various factors such as changes in consumer demand, global economic conditions, and supply chain disruptions. The surge in 2022 may have been driven by increased construction activities or shifts in sourcing strategies. Conversely, the sharp decline in 2024 could be linked to supply chain challenges or changes in trade policies impacting import volumes. Such volatility underscores the market's sensitivity to external factors, necessitating agile strategies to navigate uncertainties in the ceramics sector.
Key Highlights of the Report:
- Greece Ceramics Market Outlook
- Market Size of Greece Ceramics Market, 2025
- Forecast of Greece Ceramics Market, 2032
- Historical Data and Forecast of Greece Ceramics Revenues & Volume for the Period 2022-2032F
- Greece Ceramics Market Trend Evolution
- Greece Ceramics Market Drivers and Challenges
- Greece Ceramics Price Trends
- Greece Ceramics Porter`s Five Forces
- Greece Ceramics Industry Life Cycle
- Historical Data and Forecast of Greece Ceramics Market Revenues & Volume By Product Types for the Period 2022-2032F
- Historical Data and Forecast of Greece Ceramics Market Revenues & Volume By Traditional for the Period 2022-2032F
- Historical Data and Forecast of Greece Ceramics Market Revenues & Volume By Advanced for the Period 2022-2032F
- Historical Data and Forecast of Greece Ceramics Market Revenues & Volume By Applications for the Period 2022-2032F
- Historical Data and Forecast of Greece Ceramics Market Revenues & Volume By Sanitary Ware for the Period 2022-2032F
- Historical Data and Forecast of Greece Ceramics Market Revenues & Volume By Abrasives for the Period 2022-2032F
- Historical Data and Forecast of Greece Ceramics Market Revenues & Volume By Bricks and Pipes for the Period 2022-2032F
- Historical Data and Forecast of Greece Ceramics Market Revenues & Volume By Tiles for the Period 2022-2032F
- Historical Data and Forecast of Greece Ceramics Market Revenues & Volume By Pottery for the Period 2022-2032F
- Historical Data and Forecast of Greece Ceramics Market Revenues & Volume By Others for the Period 2022-2032F
- Historical Data and Forecast of Greece Ceramics Market Revenues & Volume By End-users for the Period 2022-2032F
- Historical Data and Forecast of Greece Ceramics Market Revenues & Volume By Building & Construction for the Period 2022-2032F
- Historical Data and Forecast of Greece Ceramics Market Revenues & Volume By Industrial for the Period 2022-2032F
- Historical Data and Forecast of Greece Ceramics Market Revenues & Volume By Medical for the Period 2022-2032F
- Historical Data and Forecast of Greece Ceramics Market Revenues & Volume By Others for the Period 2022-2032F
- Greece Ceramics Import Export Trade Statistics
- Market Opportunity Assessment By Product Types
- Market Opportunity Assessment By Applications
- Market Opportunity Assessment By End-users
- Greece Ceramics Top Companies Market Share
- Greece Ceramics Competitive Benchmarking By Technical and Operational Parameters
- Greece Ceramics Company Profiles
- Greece Ceramics Key Strategic Recommendations
Frequently Asked Questions About the Market Study (FAQs):
6Wresearch actively monitors the Greece Ceramics Market and publishes its comprehensive annual report, highlighting emerging trends, growth drivers, revenue analysis, and forecast outlook. Our insights help businesses to make data-backed strategic decisions with ongoing market dynamics. Our analysts track relevent industries related to the Greece Ceramics Market, allowing our clients with actionable intelligence and reliable forecasts tailored to emerging regional needs.
Yes, we provide customisation as per your requirements. To learn more, feel free to contact us on sales@6wresearch.com
1 Executive Summary |
2 Introduction |
2.1 Key Highlights of the Report |
2.2 Report Description |
2.3 Market Scope & Segmentation |
2.4 Research Methodology |
2.5 Assumptions |
3 Greece Ceramics Market Overview |
3.1 Greece Country Macro Economic Indicators |
3.2 Greece Ceramics Market Revenues & Volume, 2022 & 2032F |
3.3 Greece Ceramics Market - Industry Life Cycle |
3.4 Greece Ceramics Market - Porter's Five Forces |
3.5 Greece Ceramics Market Revenues & Volume Share, By Product Types, 2022 & 2032F |
3.6 Greece Ceramics Market Revenues & Volume Share, By Applications, 2022 & 2032F |
3.7 Greece Ceramics Market Revenues & Volume Share, By End-users, 2022 & 2032F |
4 Greece Ceramics Market Dynamics |
4.1 Impact Analysis |
4.2 Market Drivers |
4.2.1 Growing demand for premium and customized ceramic products in Greece |
4.2.2 Increasing focus on sustainable and eco-friendly materials in the ceramics industry |
4.2.3 Rising disposable income and consumer spending on home decor items |
4.3 Market Restraints |
4.3.1 Fluctuating raw material prices impacting production costs |
4.3.2 Intense competition from alternative materials such as glass and metal in the market |
5 Greece Ceramics Market Trends |
6 Greece Ceramics Market Segmentations |
6.1 Greece Ceramics Market, By Product Types |
6.1.1 Overview and Analysis |
6.1.2 Greece Ceramics Market Revenues & Volume, By Traditional, 2022-2032F |
6.1.3 Greece Ceramics Market Revenues & Volume, By Advanced, 2022-2032F |
6.2 Greece Ceramics Market, By Applications |
6.2.1 Overview and Analysis |
6.2.2 Greece Ceramics Market Revenues & Volume, By Sanitary Ware, 2022-2032F |
6.2.3 Greece Ceramics Market Revenues & Volume, By Abrasives, 2022-2032F |
6.2.4 Greece Ceramics Market Revenues & Volume, By Bricks and Pipes, 2022-2032F |
6.2.5 Greece Ceramics Market Revenues & Volume, By Tiles, 2022-2032F |
6.2.6 Greece Ceramics Market Revenues & Volume, By Pottery, 2022-2032F |
6.2.7 Greece Ceramics Market Revenues & Volume, By Others, 2022-2032F |
6.3 Greece Ceramics Market, By End-users |
6.3.1 Overview and Analysis |
6.3.2 Greece Ceramics Market Revenues & Volume, By Building & Construction, 2022-2032F |
6.3.3 Greece Ceramics Market Revenues & Volume, By Industrial, 2022-2032F |
6.3.4 Greece Ceramics Market Revenues & Volume, By Medical, 2022-2032F |
6.3.5 Greece Ceramics Market Revenues & Volume, By Others, 2022-2032F |
7 Greece Ceramics Market Import-Export Trade Statistics |
7.1 Greece Ceramics Market Export to Major Countries |
7.2 Greece Ceramics Market Imports from Major Countries |
8 Greece Ceramics Market Key Performance Indicators |
8.1 Percentage of revenue derived from new product innovations |
8.2 Customer satisfaction scores related to product quality and design |
8.3 Percentage of revenue from eco-friendly ceramic products |
8.4 Rate of return on investment in technology and automation in production processes |
9 Greece Ceramics Market - Opportunity Assessment |
9.1 Greece Ceramics Market Opportunity Assessment, By Product Types, 2022 & 2032F |
9.2 Greece Ceramics Market Opportunity Assessment, By Applications, 2022 & 2032F |
9.3 Greece Ceramics Market Opportunity Assessment, By End-users, 2022 & 2032F |
10 Greece Ceramics Market - Competitive Landscape |
10.1 Greece Ceramics Market Revenue Share, By Companies, 2025 |
10.2 Greece Ceramics Market Competitive Benchmarking, By Operating and Technical Parameters |
11 Company Profiles |
12 Recommendations | 13 Disclaimer |
Global Go To Market Strategy - 2030
Export potential enables firms to identify high-growth global markets with greater confidence by combining advanced trade intelligence with a structured quantitative methodology. The framework analyzes emerging demand trends and country-level import patterns while integrating macroeconomic and trade datasets such as GDP and population forecasts, bilateral import–export flows, tariff structures, elasticity differentials between developed and developing economies, geographic distance, and import demand projections. Using weighted trade values from 2020–2024 as the base period to project country-to-country export potential for 2030, these inputs are operationalized through calculated drivers such as gravity model parameters, tariff impact factors, and projected GDP per-capita growth. Through an analysis of hidden potentials, demand hotspots, and market conditions that are most favorable to success, this method enables firms to focus on target countries, maximize returns, and global expansion with data, backed by accuracy.
By factoring in the projected importer demand gap that is currently unmet and could be potential opportunity, it identifies the potential for the Exporter (Country) among 190 countries, against the general trade analysis, which identifies the biggest importer or exporter.
To discover high-growth global markets and optimize your business strategy:
Click Here
Pricing
- Single User License$ 1,995
- Department License$ 2,400
- Site License$ 3,120
- Global License$ 3,795

Leadership Perspectives from Industry Events
Search
Thought Leadership and Analyst Meet


Our Clients
6WResearch In News
- India Export Attractiveness Tracker 2026
- India Air Conditioner Market Set for Strong Rebound in 2026 After Weather-Led Correction and GST-Driven Recovery: 6Wresearch
- ADAS in India: How Automatic Emergency Braking, Blind Spot Detection & Driver Monitoring are Transforming Road Safety
- Doha a strategic location for EV manufacturing hub: IPA Qatar
- Demand for luxury TVs surging in the GCC, says Samsung
- Empowering Growth: The Thriving Journey of Bangladesh’s Cable Industry
Latest Reports
- Qatar Access and Home Network Market (2026-2032)
- Nicaragua RPG Gaming Market (2026-2032)
- New Zealand RPG Gaming Market (2026-2032)
- Netherlands RPG Gaming Market (2026-2032)
- Nauru RPG Gaming Market (2026-2032)
- Namibia RPG Gaming Market (2026-2032)
- Mozambique RPG Gaming Market (2026-2032)
- Montenegro RPG Gaming Market (2026-2032)
- Mongolia RPG Gaming Market (2026-2032)
- Monaco RPG Gaming Market (2026-2032)
Industry Events and Analyst Meet

EV India Expo 2026

HIMTEX 2026

India Refining Summit 2026

India EV Show 2026

EV tech India Expo 2026
Whitepaper
- Middle East & Africa Commercial Security Market Click here to view more.
- Middle East & Africa Fire Safety Systems & Equipment Market Click here to view more.
- GCC Drone Market Click here to view more.
- Middle East Lighting Fixture Market Click here to view more.
- GCC Physical & Perimeter Security Market Click here to view more.