Greece Container Glass Market (2026-2032) | Companies, Growth, Value, Industry, Segmentation, Revenue, Size, Analysis, Forecast, Share, Trends & Outlook
Market Forecast By Glass Type (Borosilicate-based, Soda-lime-silica-based), By Forming Method (Blow & Blow, Press & Blow, Narrow Neck Press & Blow), By End Use (Food & Beverages, Cosmetics & Personal Care, Pharmaceuticals, Chemical, Others) And Competitive Landscape
| Product Code: ETC5113888 | Publication Date: Nov 2023 | Updated Date: Mar 2026 | Product Type: Market Research Report | |
| Publisher: 6Wresearch | Author: Sachin Kumar Rai | No. of Pages: 60 | No. of Figures: 30 | No. of Tables: 5 |
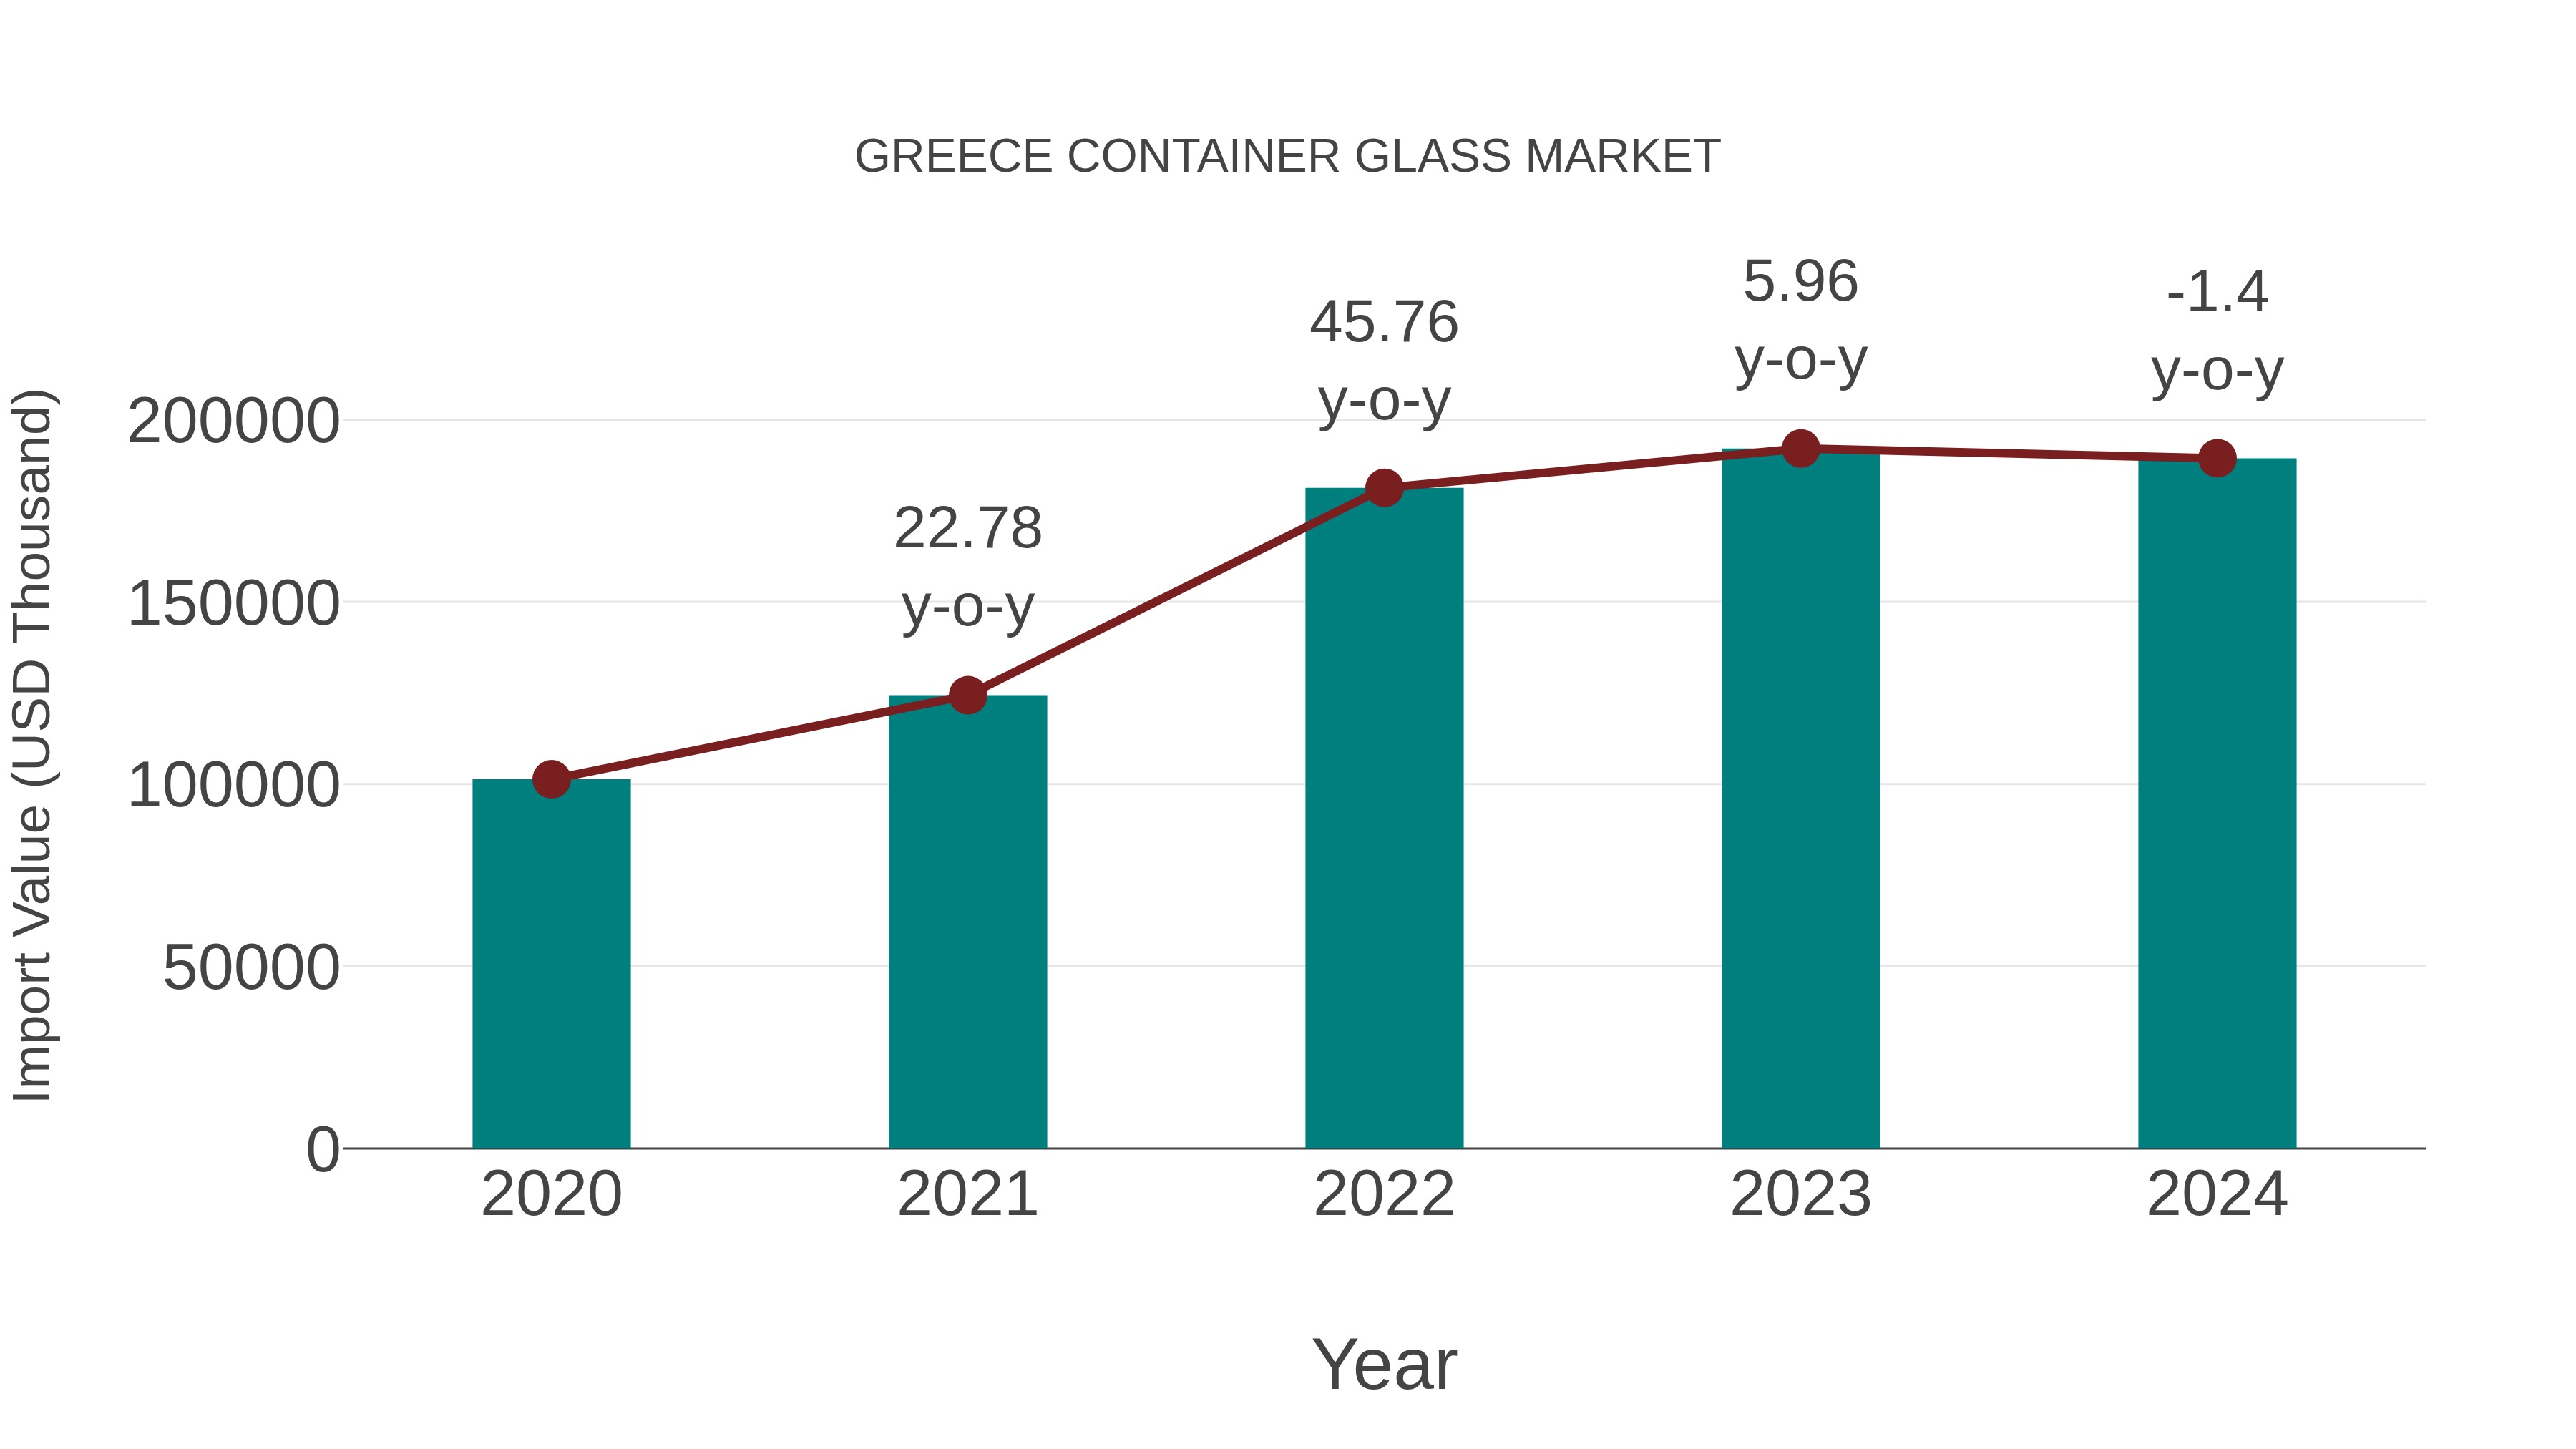
Greece Container Glass Market: Import Trend Analysis
In the Greece container glass market, the import trend experienced a -1.4% decline from 2023 to 2024, contrasting with a 16.93% compound annual growth rate (CAGR) for the period of 2020-2024. This decline in import momentum from 2023 to 2024 may be attributed to shifting demand patterns or changes in trade policies impacting market stability.
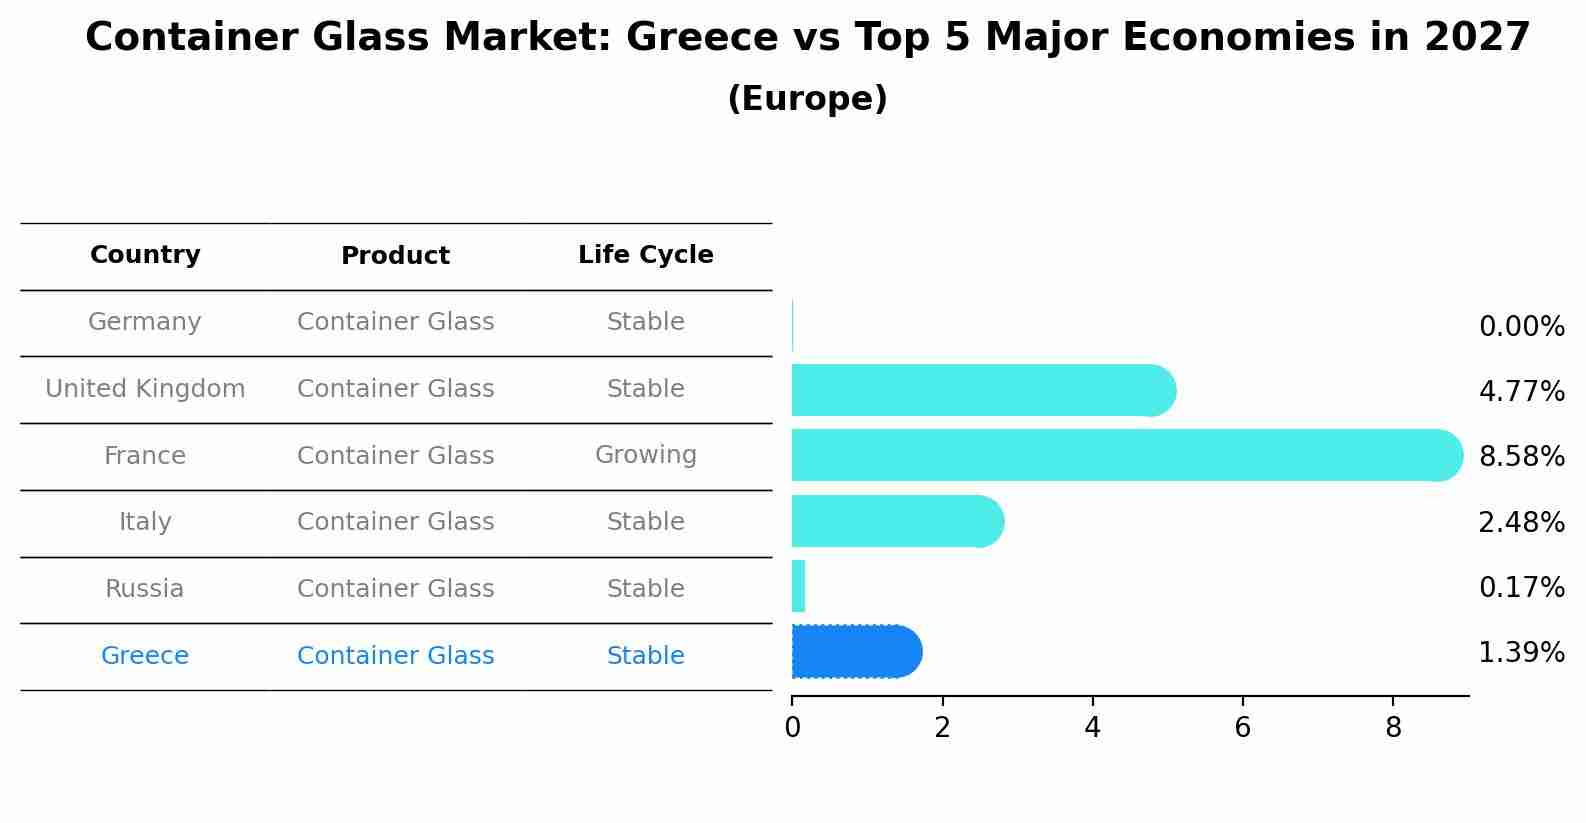
Container Glass Market: Greece vs Top 5 Major Economies in 2027 (Europe)
In the Europe region, the Container Glass market in Greece is projected to expand at a stable growth rate of 1.39% by 2027. The largest economy is Germany, followed by United Kingdom, France, Italy and Russia.
Greece Container Glass Market Overview
The container glass market in Greece is expanding, primarily driven by the demand for glass packaging in the food and beverage sector. Glass is favored for its sustainability, recyclability, and ability to preserve the quality of products. As consumer preferences shift toward eco-friendly and reusable packaging, the demand for container glass is expected to rise in Greece.
Drivers of the market
The container glass market in Greece is growing due to the increasing demand for sustainable packaging solutions, particularly in the food and beverage industry. Glass containers are favored for their recyclability, safety, and preservation qualities, making them a popular choice among manufacturers and consumers.
Challenges of the market
The container glass market in Greece faces challenges due to fluctuating raw material costs and the need to comply with stringent environmental regulations regarding recycling and energy consumption. Moreover, competition from alternative packaging materials, such as plastic and aluminum, creates pressure on the market to innovate in terms of cost-efficiency and sustainability.
Government Policy of the market
The container glass market in Greece is shaped by government regulations promoting sustainability and reducing waste in packaging. Policies that encourage the use of recyclable and environmentally friendly packaging materials drive demand for container glass products, especially in the food and beverage industry.
Key Highlights of the Report:
- Greece Container Glass Market Outlook
- Market Size of Greece Container Glass Market, 2025
- Forecast of Greece Container Glass Market, 2032
- Historical Data and Forecast of Greece Container Glass Revenues & Volume for the Period 2022-2032F
- Greece Container Glass Market Trend Evolution
- Greece Container Glass Market Drivers and Challenges
- Greece Container Glass Price Trends
- Greece Container Glass Porter`s Five Forces
- Greece Container Glass Industry Life Cycle
- Historical Data and Forecast of Greece Container Glass Market Revenues & Volume By Glass Type for the Period 2022-2032F
- Historical Data and Forecast of Greece Container Glass Market Revenues & Volume By Borosilicate-based for the Period 2022-2032F
- Historical Data and Forecast of Greece Container Glass Market Revenues & Volume By Soda-lime-silica-based for the Period 2022-2032F
- Historical Data and Forecast of Greece Container Glass Market Revenues & Volume By Forming Method for the Period 2022-2032F
- Historical Data and Forecast of Greece Container Glass Market Revenues & Volume By Blow & Blow for the Period 2022-2032F
- Historical Data and Forecast of Greece Container Glass Market Revenues & Volume By Press & Blow for the Period 2022-2032F
- Historical Data and Forecast of Greece Container Glass Market Revenues & Volume By Narrow Neck Press & Blow for the Period 2022-2032F
- Historical Data and Forecast of Greece Container Glass Market Revenues & Volume By End Use for the Period 2022-2032F
- Historical Data and Forecast of Greece Container Glass Market Revenues & Volume By Food & Beverages for the Period 2022-2032F
- Historical Data and Forecast of Greece Container Glass Market Revenues & Volume By Cosmetics & Personal Care for the Period 2022-2032F
- Historical Data and Forecast of Greece Container Glass Market Revenues & Volume By Pharmaceuticals for the Period 2022-2032F
- Historical Data and Forecast of Greece Container Glass Market Revenues & Volume By Chemical for the Period 2022-2032F
- Historical Data and Forecast of Greece Container Glass Market Revenues & Volume By Others for the Period 2022-2032F
- Greece Container Glass Import Export Trade Statistics
- Market Opportunity Assessment By Glass Type
- Market Opportunity Assessment By Forming Method
- Market Opportunity Assessment By End Use
- Greece Container Glass Top Companies Market Share
- Greece Container Glass Competitive Benchmarking By Technical and Operational Parameters
- Greece Container Glass Company Profiles
- Greece Container Glass Key Strategic Recommendations
Greece Container Glass Market (2026-2032): FAQs
6Wresearch actively monitors the Greece Container Glass Market and publishes its comprehensive annual report, highlighting emerging trends, growth drivers, revenue analysis, and forecast outlook. Our insights help businesses to make data-backed strategic decisions with ongoing market dynamics. Our analysts track relevent industries related to the Greece Container Glass Market, allowing our clients with actionable intelligence and reliable forecasts tailored to emerging regional needs.
Yes, we provide customisation as per your requirements. To learn more, feel free to contact us on sales@6wresearch.com
1 Executive Summary |
2 Introduction |
2.1 Key Highlights of the Report |
2.2 Report Description |
2.3 Market Scope & Segmentation |
2.4 Research Methodology |
2.5 Assumptions |
3 Greece Container Glass Market Overview |
3.1 Greece Country Macro Economic Indicators |
3.2 Greece Container Glass Market Revenues & Volume, 2022 & 2032F |
3.3 Greece Container Glass Market - Industry Life Cycle |
3.4 Greece Container Glass Market - Porter's Five Forces |
3.5 Greece Container Glass Market Revenues & Volume Share, By Glass Type, 2022 & 2032F |
3.6 Greece Container Glass Market Revenues & Volume Share, By Forming Method, 2022 & 2032F |
3.7 Greece Container Glass Market Revenues & Volume Share, By End Use, 2022 & 2032F |
4 Greece Container Glass Market Dynamics |
4.1 Impact Analysis |
4.2 Market Drivers |
4.2.1 Increasing demand for sustainable and eco-friendly packaging solutions |
4.2.2 Growth in the beverage industry in Greece |
4.2.3 Government initiatives promoting recycling and use of glass packaging |
4.3 Market Restraints |
4.3.1 Fluctuating raw material prices |
4.3.2 Intense competition from alternative packaging materials |
4.3.3 Impact of economic downturn on consumer spending |
5 Greece Container Glass Market Trends |
6 Greece Container Glass Market Segmentations |
6.1 Greece Container Glass Market, By Glass Type |
6.1.1 Overview and Analysis |
6.1.2 Greece Container Glass Market Revenues & Volume, By Borosilicate-based, 2022-2032F |
6.1.3 Greece Container Glass Market Revenues & Volume, By Soda-lime-silica-based, 2022-2032F |
6.2 Greece Container Glass Market, By Forming Method |
6.2.1 Overview and Analysis |
6.2.2 Greece Container Glass Market Revenues & Volume, By Blow & Blow, 2022-2032F |
6.2.3 Greece Container Glass Market Revenues & Volume, By Press & Blow, 2022-2032F |
6.2.4 Greece Container Glass Market Revenues & Volume, By Narrow Neck Press & Blow, 2022-2032F |
6.3 Greece Container Glass Market, By End Use |
6.3.1 Overview and Analysis |
6.3.2 Greece Container Glass Market Revenues & Volume, By Food & Beverages, 2022-2032F |
6.3.3 Greece Container Glass Market Revenues & Volume, By Cosmetics & Personal Care, 2022-2032F |
6.3.4 Greece Container Glass Market Revenues & Volume, By Pharmaceuticals, 2022-2032F |
6.3.5 Greece Container Glass Market Revenues & Volume, By Chemical, 2022-2032F |
6.3.6 Greece Container Glass Market Revenues & Volume, By Others, 2022-2032F |
7 Greece Container Glass Market Import-Export Trade Statistics |
7.1 Greece Container Glass Market Export to Major Countries |
7.2 Greece Container Glass Market Imports from Major Countries |
8 Greece Container Glass Market Key Performance Indicators |
8.1 Percentage of recycled glass used in production |
8.2 Energy efficiency in glass manufacturing processes |
8.3 Innovation rate in glass packaging designs |
8.4 Market penetration of glass packaging in various industries |
8.5 Customer satisfaction and loyalty towards glass packaging products |
9 Greece Container Glass Market - Opportunity Assessment |
9.1 Greece Container Glass Market Opportunity Assessment, By Glass Type, 2022 & 2032F |
9.2 Greece Container Glass Market Opportunity Assessment, By Forming Method, 2022 & 2032F |
9.3 Greece Container Glass Market Opportunity Assessment, By End Use, 2022 & 2032F |
10 Greece Container Glass Market - Competitive Landscape |
10.1 Greece Container Glass Market Revenue Share, By Companies, 2025 |
10.2 Greece Container Glass Market Competitive Benchmarking, By Operating and Technical Parameters |
11 Company Profiles |
12 Recommendations | 13 Disclaimer |
Export potential assessment - trade Analytics for 2030
Export potential enables firms to identify high-growth global markets with greater confidence by combining advanced trade intelligence with a structured quantitative methodology. The framework analyzes emerging demand trends and country-level import patterns while integrating macroeconomic and trade datasets such as GDP and population forecasts, bilateral import–export flows, tariff structures, elasticity differentials between developed and developing economies, geographic distance, and import demand projections. Using weighted trade values from 2020–2024 as the base period to project country-to-country export potential for 2030, these inputs are operationalized through calculated drivers such as gravity model parameters, tariff impact factors, and projected GDP per-capita growth. Through an analysis of hidden potentials, demand hotspots, and market conditions that are most favorable to success, this method enables firms to focus on target countries, maximize returns, and global expansion with data, backed by accuracy.
By factoring in the projected importer demand gap that is currently unmet and could be potential opportunity, it identifies the potential for the Exporter (Country) among 190 countries, against the general trade analysis, which identifies the biggest importer or exporter.
To discover high-growth global markets and optimize your business strategy:
Click Here
Pricing
- Single User License$ 1,995
- Department License$ 2,400
- Site License$ 3,120
- Global License$ 3,795

Search
Thought Leadership and Analyst Meet


Our Clients
Latest Reports
- Canada Cloud CFD Market (2026-2032) | Size & Revenue, Industry, Growth, Competitive Landscape, Forecast, Segmentation, Value, Outlook, Trends, Share, Analysis, Companies
- Taiwan Food Delivery Platform Market (2026-2032) | Companies, Outlook, Analysis, Trends, Value, Revenue, Segmentation, Share, Forecast, Competitive Landscape, Growth, Size & Forecast
- United Kingdom (UK) Long-term Care Insurance Market (2026-2032) | Growth, Share, Consumer Insights, Drivers, Opportunities, Competition, Pricing Analysis, Segments, Restraints, Companies, Competitive, Value, Outlook, Size, Demand, Analysis, Challenges, Strategic Insights, Investment Trends, Revenue, Trends, Supply, Forecast
- United Kingdom (UK) Long Term Care Market (2026-2032) | Companies, Outlook, Analysis, Trends, Value, Revenue, Segmentation, Share, Forecast, Competitive Landscape, Growth, Size & Forecast
- Iraq Insulation and Waterproofing Market (2026-2032) | Outlook, Drivers, Growth, Size, Share, Industry, Revenue, Trends, Demand, Competitive, Strategic Insights, Opportunities, Segments, Companies, Challenges, Strategy, Consumer Insights, Analysis, Investment Trends, Value, Segmentation, Forecast, Restraints
- India Switchgear Market Outlook (2026-2032) | Size, Share, Trends, Growth, Revenue, Forecast, Analysis, Value, Outlook
- Pakistan Contraceptive Implants Market (2025-2031) | Demand, Growth, Size, Share, Industry, Pricing Analysis, Competitive, Strategic Insights, Strategy, Consumer Insights, Analysis, Investment Trends, Opportunities, Revenue, Segments, Value, Segmentation, Supply, Forecast, Restraints, Outlook, Competition, Drivers, Trends, Companies, Challenges
- Sri Lanka Packaging Market (2026-2032) | Outlook, Competition, Drivers, Trends, Demand, Pricing Analysis, Competitive, Strategic Insights, Companies, Challenges, Strategy, Consumer Insights, Analysis, Investment Trends, Opportunities, Growth, Size, Share, Industry, Revenue, Segments, Value, Segmentation, Supply, Forecast, Restraints
- India Kids Watches Market (2026-2032) | Strategy, Consumer Insights, Analysis, Investment Trends, Opportunities, Growth, Size, Share, Industry, Revenue, Segments, Value, Segmentation, Supply, Forecast, Restraints, Outlook, Competition, Drivers, Trends, Demand, Pricing Analysis, Competitive, Strategic Insights, Companies, Challenges
- Saudi Arabia Core Assurance Service Market (2025-2031) | Strategy, Consumer Insights, Analysis, Investment Trends, Opportunities, Growth, Size, Share, Industry, Revenue, Segments, Value, Segmentation, Supply, Forecast, Restraints, Outlook, Competition, Drivers, Trends, Demand, Pricing Analysis, Competitive, Strategic Insights, Companies, Challenges
Industry Events and Analyst Meet

India EV Show 2026

EV tech India Expo 2026

Auto Tech Asia 2026

Battery Tech India 2026

Smart Production Solutions Guangzhou 2026
Whitepaper
- Middle East & Africa Commercial Security Market Click here to view more.
- Middle East & Africa Fire Safety Systems & Equipment Market Click here to view more.
- GCC Drone Market Click here to view more.
- Middle East Lighting Fixture Market Click here to view more.
- GCC Physical & Perimeter Security Market Click here to view more.
6WResearch In News
- Doha a strategic location for EV manufacturing hub: IPA Qatar
- Demand for luxury TVs surging in the GCC, says Samsung
- Empowering Growth: The Thriving Journey of Bangladesh’s Cable Industry
- Demand for luxury TVs surging in the GCC, says Samsung
- Video call with a traditional healer? Once unthinkable, it’s now common in South Africa
- Intelligent Buildings To Smooth GCC’s Path To Net Zero