Greece Tanning Agents Market (2026-2032) | Share, Size, Outlook, Forecast, Revenue, Companies, Growth, Value, Analysis, Industry, Trends & Segmentation
Market Forecast By Type (Inorganic Materials, Aldehyde Tanning Agents, Vegetable Tanning Agents, Other Types), By Application (Leather tanning, Sun Tanning and Personal Care Products, Other Applications) And Competitive Landscape
| Product Code: ETC5157379 | Publication Date: Nov 2023 | Updated Date: Apr 2026 | Product Type: Market Research Report | |
| Publisher: 6Wresearch | Author: Shubham Padhi | No. of Pages: 60 | No. of Figures: 30 | No. of Tables: 5 |
Greece Tanning Agents Market Size (2020-2030)
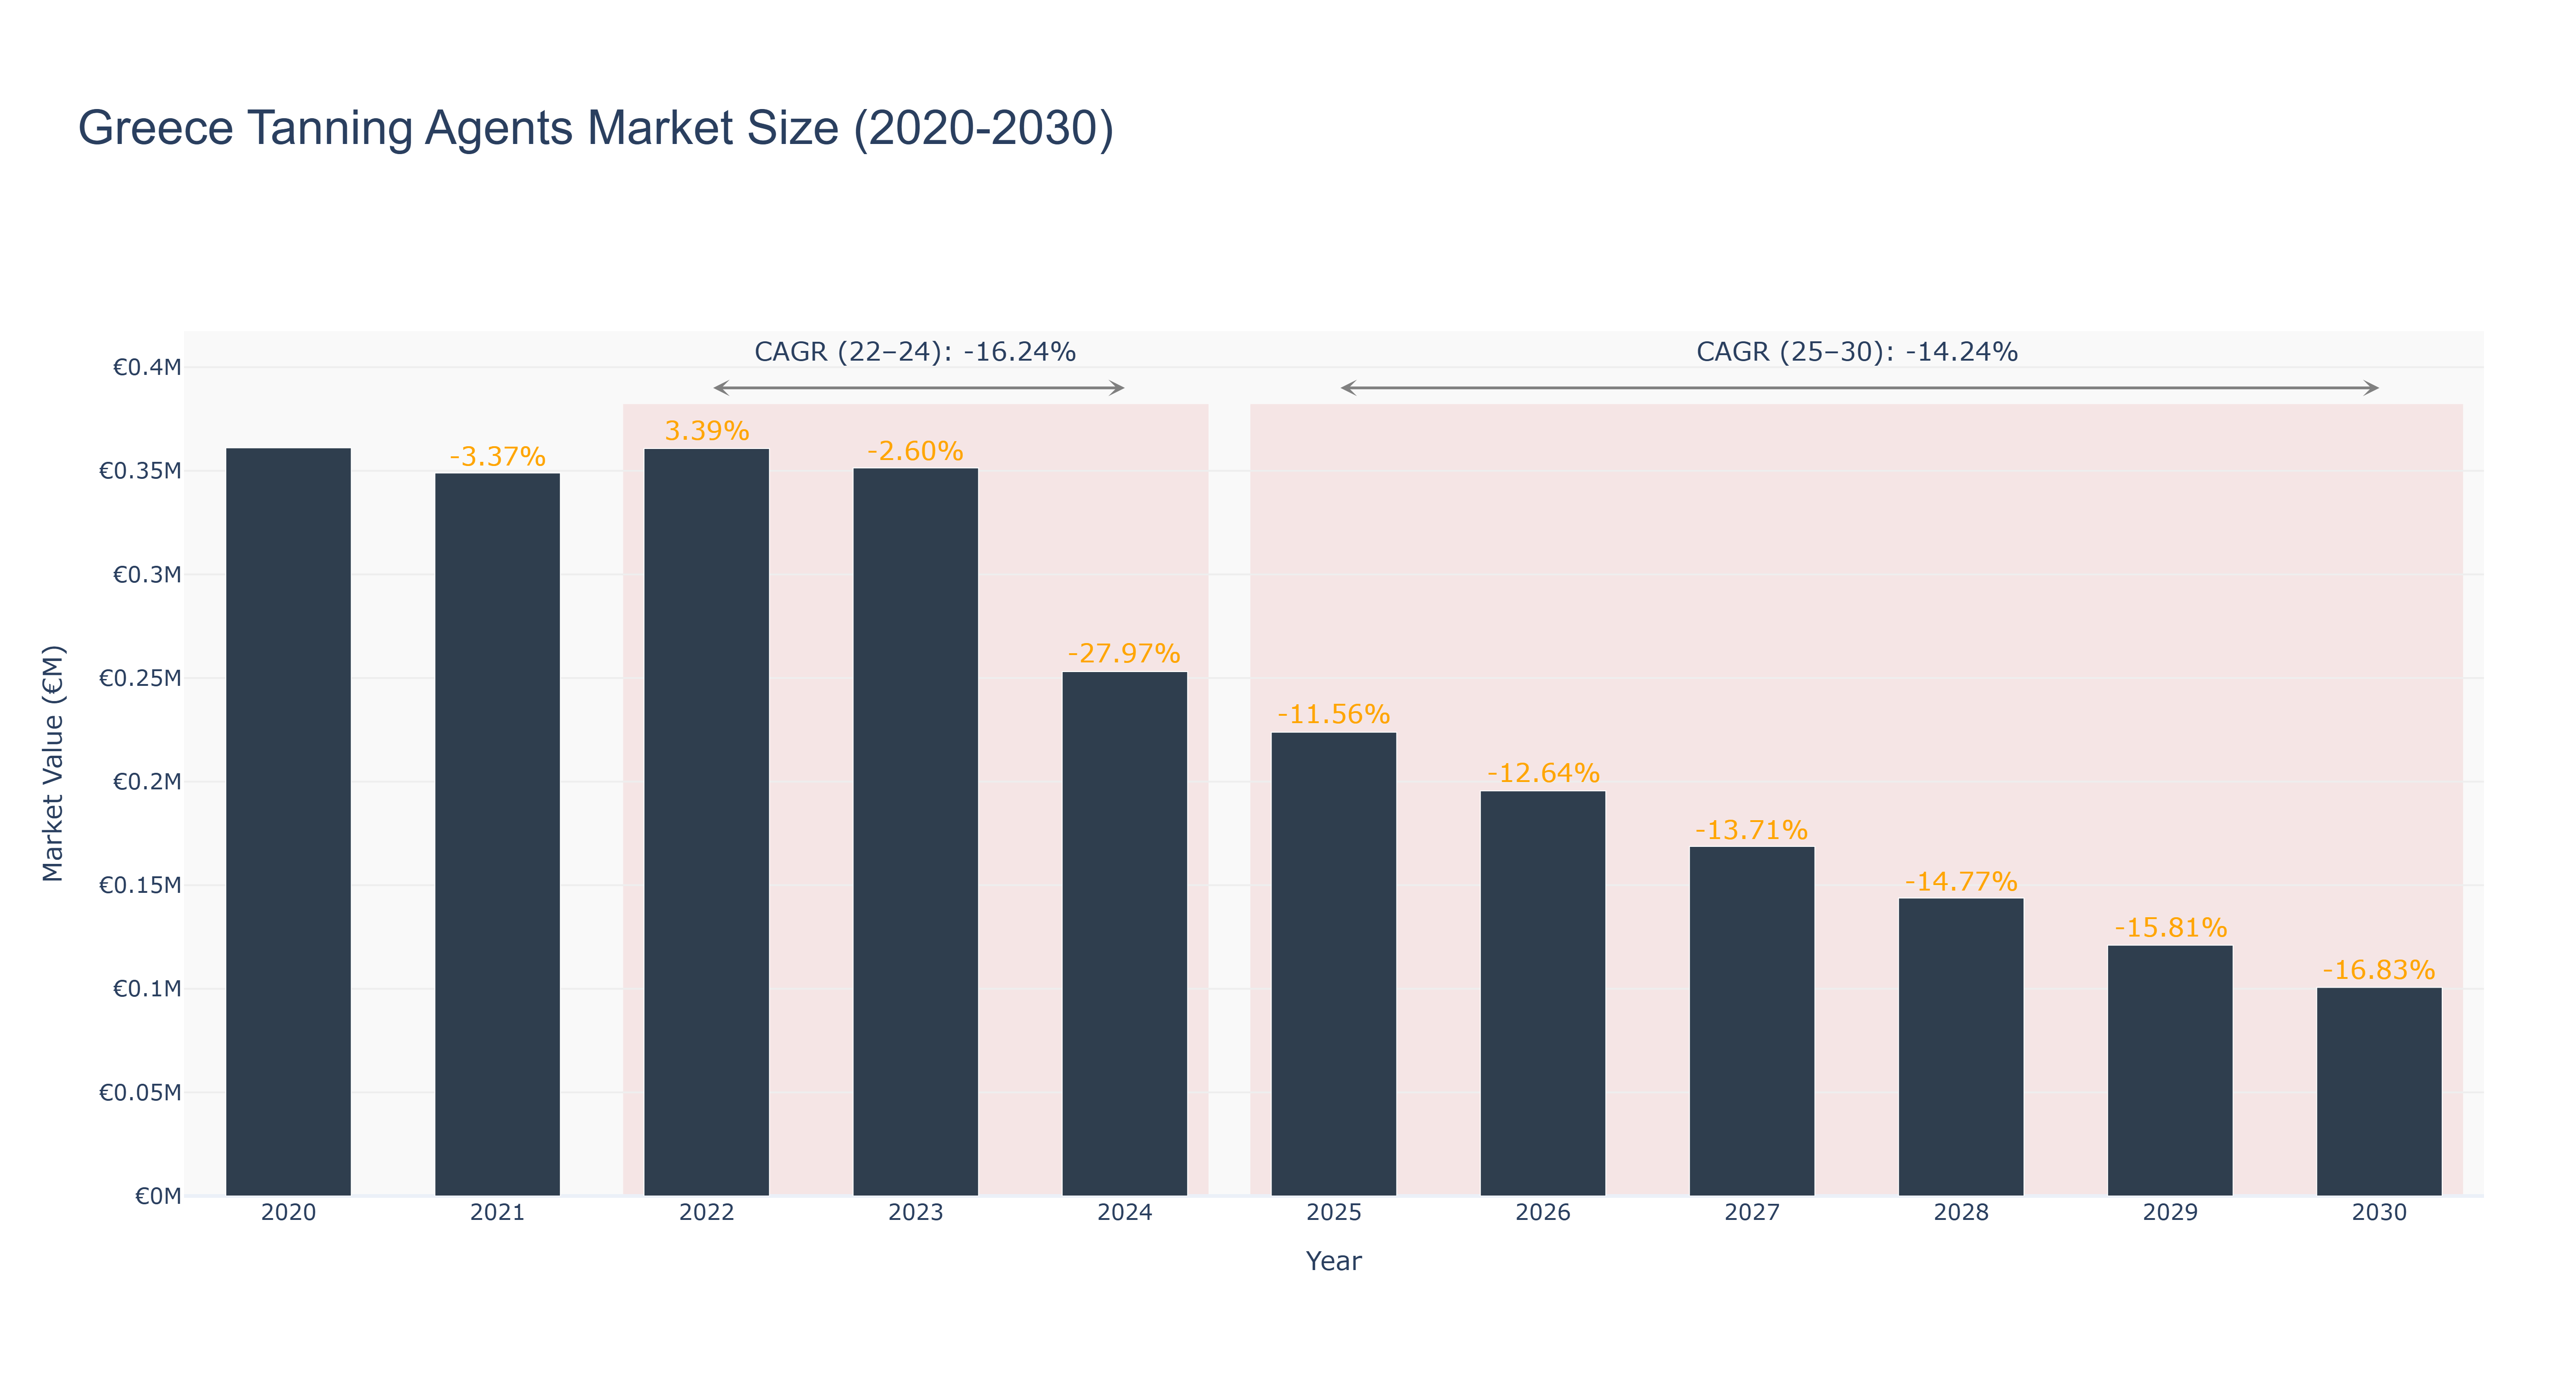
The Greece Tanning Agents Market experienced a peak size of €0.36 million in 2020. However, the market size steadily declined to €0.25 million in 2024, showcasing a negative growth trend. Forecasted market sizes from 2025 to 2030 indicate a further decrease to €0.10 million in 2030. The CAGR from 2022 to 2024 was at -16.24%, while the CAGR from 2025 to 2030 is projected at -14.24%. The market downturn can be attributed to changing consumer preferences, economic challenges, and increased competition in the industry. Looking ahead, the Greece Tanning Agents Market is expected to focus on sustainable practices, product innovation, and digital marketing strategies to revitalize growth in the coming years. Recent developments in eco-friendly tanning solutions and collaborations with fashion brands are poised to drive market recovery and expansion.
Greece Tanning Agents Market: Production & Trade Performance (2019-2025)
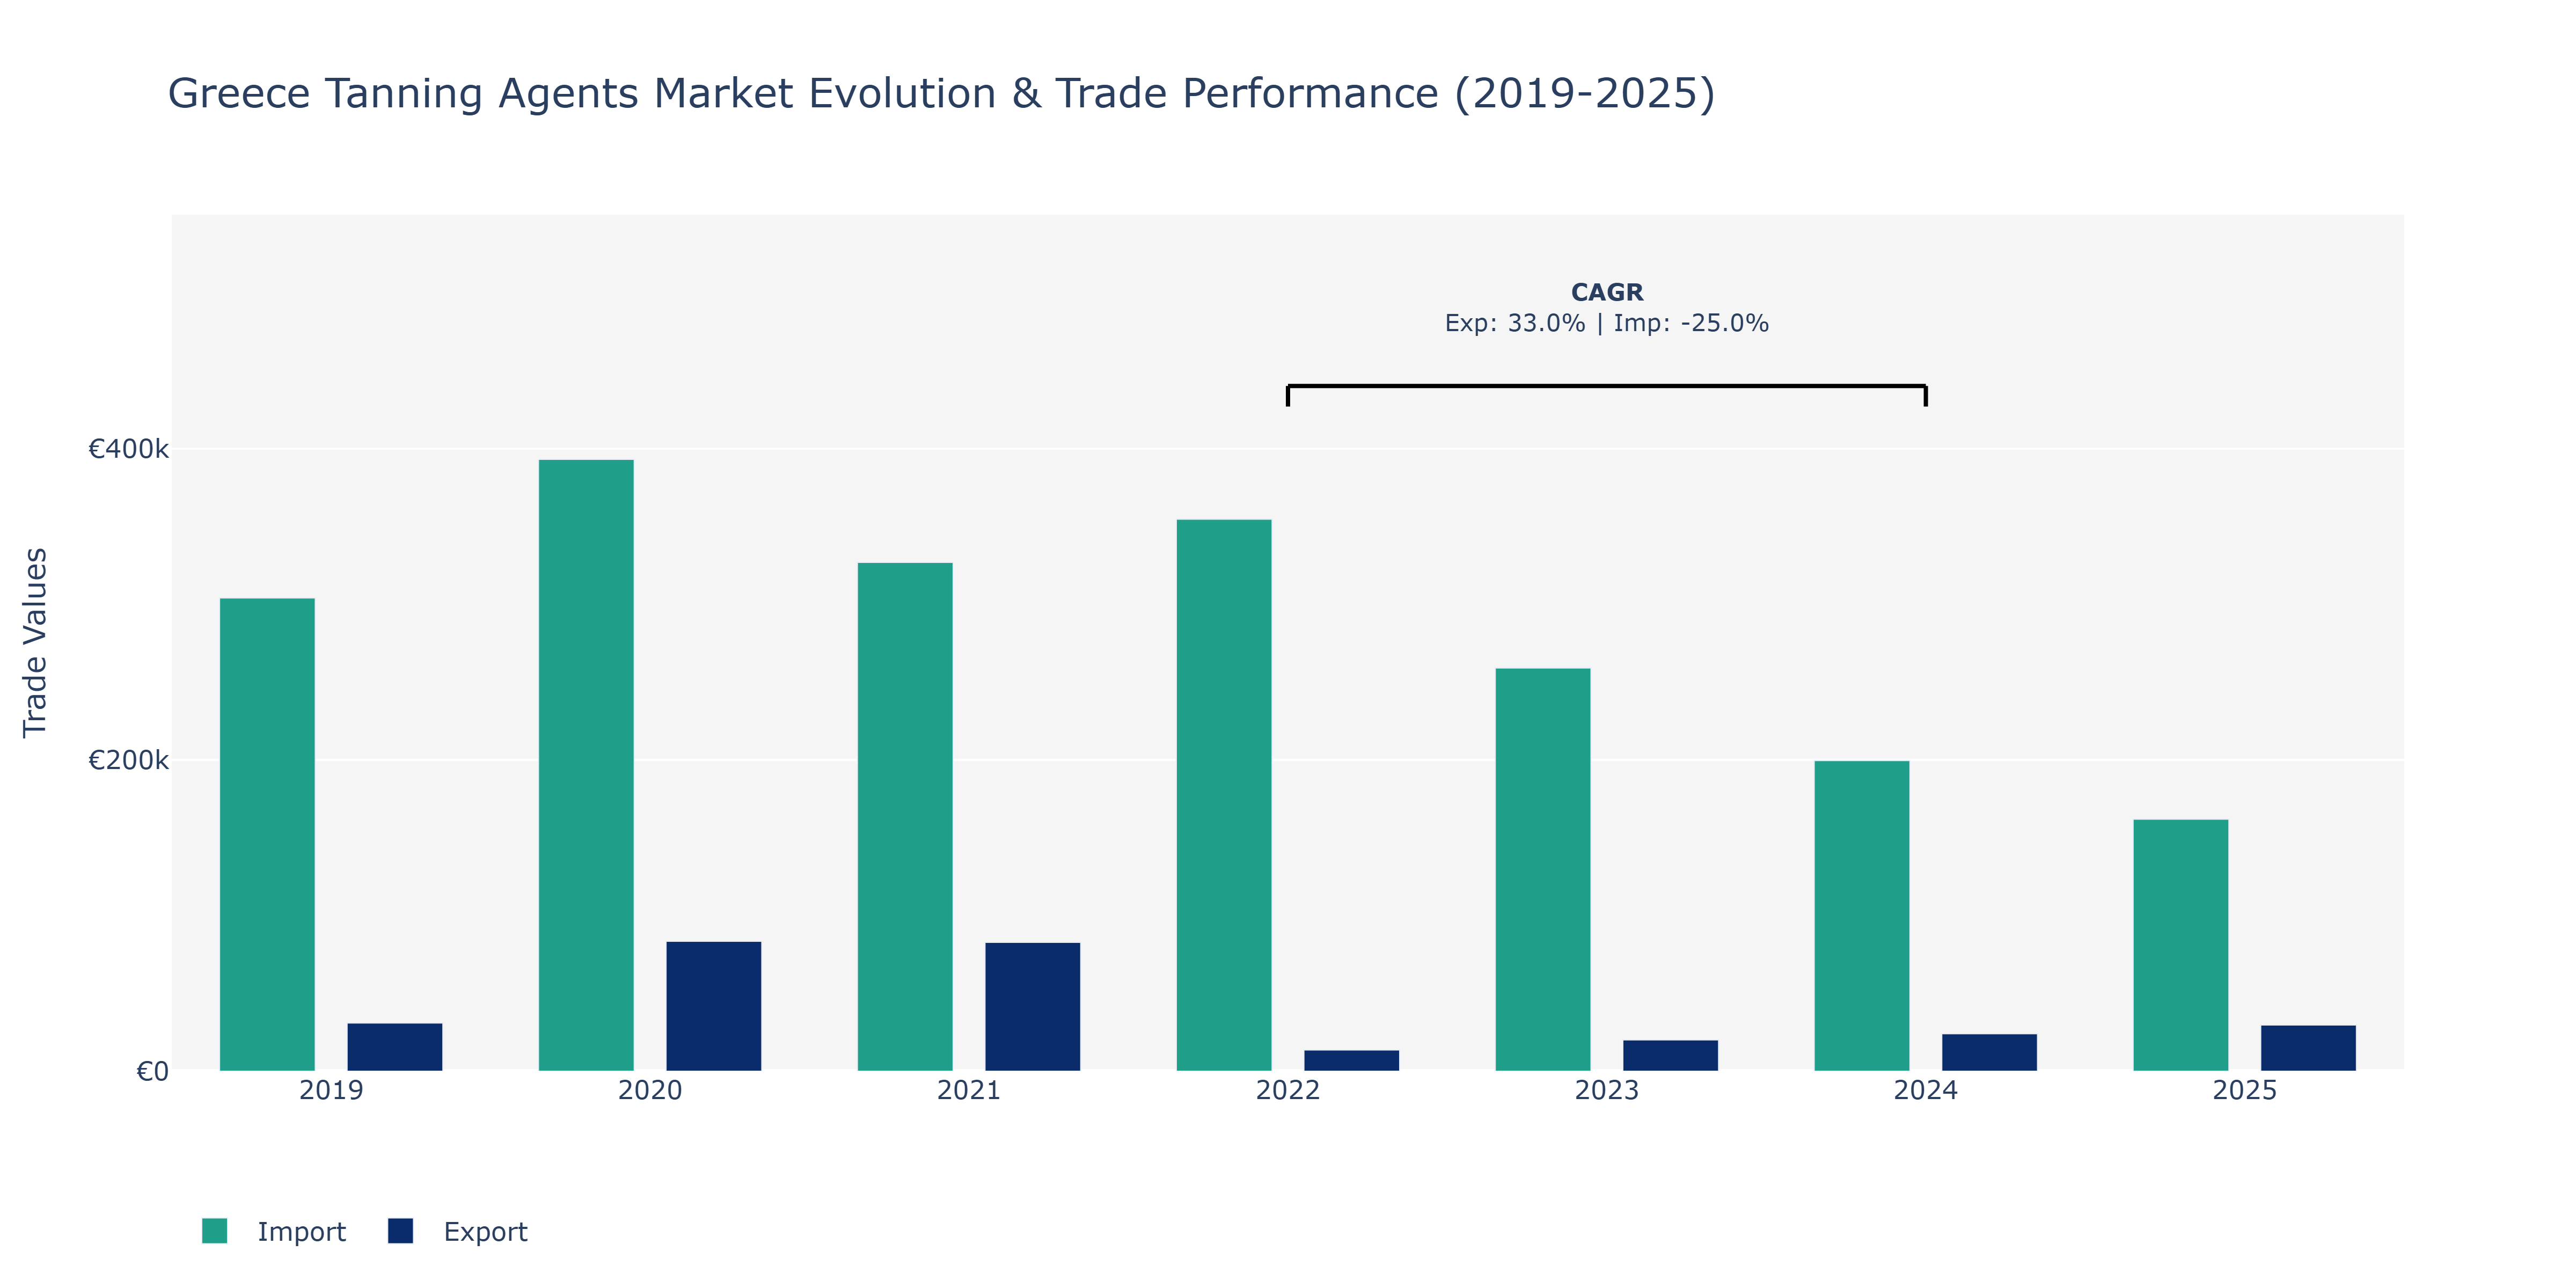
Between 2019 and 2025, the Greece Tanning Agents Market witnessed fluctuations in both exports and imports. Exports experienced growth from €30.92 thousand in 2019 to €83.44 thousand in 2020, representing a sharp increase. However, the following years saw a decline, with 2022 showing a significant decrease to €13.6 thousand but recovering slightly by 2025, reaching €29.67 thousand. Conversely, imports peaked at €393.12 thousand in 2020 before gradually decreasing to €161.92 thousand in 2025. The decline in imports from 2020 to 2025 can be attributed to various factors such as changes in consumer demand, global economic conditions, and shifts in domestic production capabilities. The fluctuations in both exports and imports emphasize the market's sensitivity to external factors, highlighting the need for market players to adapt their strategies to navigate these changes effectively.
Key Highlights of the Report:
- Greece Tanning Agents Market Outlook
- Market Size of Greece Tanning Agents Market, 2025
- Forecast of Greece Tanning Agents Market, 2032
- Historical Data and Forecast of Greece Tanning Agents Revenues & Volume for the Period 2022-2032F
- Greece Tanning Agents Market Trend Evolution
- Greece Tanning Agents Market Drivers and Challenges
- Greece Tanning Agents Price Trends
- Greece Tanning Agents Porter`s Five Forces
- Greece Tanning Agents Industry Life Cycle
- Historical Data and Forecast of Greece Tanning Agents Market Revenues & Volume By Type for the Period 2022-2032F
- Historical Data and Forecast of Greece Tanning Agents Market Revenues & Volume By Inorganic Materials for the Period 2022-2032F
- Historical Data and Forecast of Greece Tanning Agents Market Revenues & Volume By Aldehyde Tanning Agents for the Period 2022-2032F
- Historical Data and Forecast of Greece Tanning Agents Market Revenues & Volume By Vegetable Tanning Agents for the Period 2022-2032F
- Historical Data and Forecast of Greece Tanning Agents Market Revenues & Volume By Other Types for the Period 2022-2032F
- Historical Data and Forecast of Greece Tanning Agents Market Revenues & Volume By Application for the Period 2022-2032F
- Historical Data and Forecast of Greece Tanning Agents Market Revenues & Volume By Leather tanning for the Period 2022-2032F
- Historical Data and Forecast of Greece Tanning Agents Market Revenues & Volume By Sun Tanning and Personal Care Products for the Period 2022-2032F
- Historical Data and Forecast of Greece Tanning Agents Market Revenues & Volume By Other Applications for the Period 2022-2032F
- Greece Tanning Agents Import Export Trade Statistics
- Market Opportunity Assessment By Type
- Market Opportunity Assessment By Application
- Greece Tanning Agents Top Companies Market Share
- Greece Tanning Agents Competitive Benchmarking By Technical and Operational Parameters
- Greece Tanning Agents Company Profiles
- Greece Tanning Agents Key Strategic Recommendations
Frequently Asked Questions About the Market Study (FAQs):
6Wresearch actively monitors the Greece Tanning Agents Market and publishes its comprehensive annual report, highlighting emerging trends, growth drivers, revenue analysis, and forecast outlook. Our insights help businesses to make data-backed strategic decisions with ongoing market dynamics. Our analysts track relevent industries related to the Greece Tanning Agents Market, allowing our clients with actionable intelligence and reliable forecasts tailored to emerging regional needs.
Yes, we provide customisation as per your requirements. To learn more, feel free to contact us on sales@6wresearch.com
1 Executive Summary |
2 Introduction |
2.1 Key Highlights of the Report |
2.2 Report Description |
2.3 Market Scope & Segmentation |
2.4 Research Methodology |
2.5 Assumptions |
3 Greece Tanning Agents Market Overview |
3.1 Greece Country Macro Economic Indicators |
3.2 Greece Tanning Agents Market Revenues & Volume, 2022 & 2032F |
3.3 Greece Tanning Agents Market - Industry Life Cycle |
3.4 Greece Tanning Agents Market - Porter's Five Forces |
3.5 Greece Tanning Agents Market Revenues & Volume Share, By Type, 2022 & 2032F |
3.6 Greece Tanning Agents Market Revenues & Volume Share, By Application, 2022 & 2032F |
4 Greece Tanning Agents Market Dynamics |
4.1 Impact Analysis |
4.2 Market Drivers |
4.2.1 Increasing demand for leather products in various industries such as fashion, automotive, and furniture. |
4.2.2 Growing focus on sustainable and eco-friendly tanning agents to meet regulatory requirements and consumer preferences. |
4.2.3 Technological advancements leading to the development of innovative tanning agent formulations. |
4.3 Market Restraints |
4.3.1 Fluctuating raw material prices impacting the production cost of tanning agents. |
4.3.2 Stringent environmental regulations regarding the use of certain chemicals in tanning agents. |
4.3.3 Competition from alternative materials and synthetic substitutes affecting market demand. |
5 Greece Tanning Agents Market Trends |
6 Greece Tanning Agents Market Segmentations |
6.1 Greece Tanning Agents Market, By Type |
6.1.1 Overview and Analysis |
6.1.2 Greece Tanning Agents Market Revenues & Volume, By Inorganic Materials, 2022-2032F |
6.1.3 Greece Tanning Agents Market Revenues & Volume, By Aldehyde Tanning Agents, 2022-2032F | 6.1.5 Greece Tanning Agents Market Revenues & Volume, By Vegetable Tanning Agents, 2022-2032F |
6.1.5 Greece Tanning Agents Market Revenues & Volume, By Other Types, 2022-2032F |
6.2 Greece Tanning Agents Market, By Application |
6.2.1 Overview and Analysis |
6.2.2 Greece Tanning Agents Market Revenues & Volume, By Leather tanning, 2022-2032F |
6.2.3 Greece Tanning Agents Market Revenues & Volume, By Sun Tanning and Personal Care Products, 2022-2032F |
6.2.4 Greece Tanning Agents Market Revenues & Volume, By Other Applications, 2022-2032F |
7 Greece Tanning Agents Market Import-Export Trade Statistics |
7.1 Greece Tanning Agents Market Export to Major Countries |
7.2 Greece Tanning Agents Market Imports from Major Countries |
8 Greece Tanning Agents Market Key Performance Indicators |
8.1 Adoption rate of eco-friendly tanning agents in the market. |
8.2 Research and development investment in new tanning agent formulations. |
8.3 Percentage of tanneries complying with environmental regulations. |
9 Greece Tanning Agents Market - Opportunity Assessment |
9.1 Greece Tanning Agents Market Opportunity Assessment, By Type, 2022 & 2032F |
9.2 Greece Tanning Agents Market Opportunity Assessment, By Application, 2022 & 2032F |
10 Greece Tanning Agents Market - Competitive Landscape |
10.1 Greece Tanning Agents Market Revenue Share, By Companies, 2025 |
10.2 Greece Tanning Agents Market Competitive Benchmarking, By Operating and Technical Parameters |
11 Company Profiles |
12 Recommendations | 13 Disclaimer |
Global Go To Market Strategy - 2030
Export potential enables firms to identify high-growth global markets with greater confidence by combining advanced trade intelligence with a structured quantitative methodology. The framework analyzes emerging demand trends and country-level import patterns while integrating macroeconomic and trade datasets such as GDP and population forecasts, bilateral import–export flows, tariff structures, elasticity differentials between developed and developing economies, geographic distance, and import demand projections. Using weighted trade values from 2020–2024 as the base period to project country-to-country export potential for 2030, these inputs are operationalized through calculated drivers such as gravity model parameters, tariff impact factors, and projected GDP per-capita growth. Through an analysis of hidden potentials, demand hotspots, and market conditions that are most favorable to success, this method enables firms to focus on target countries, maximize returns, and global expansion with data, backed by accuracy.
By factoring in the projected importer demand gap that is currently unmet and could be potential opportunity, it identifies the potential for the Exporter (Country) among 190 countries, against the general trade analysis, which identifies the biggest importer or exporter.
To discover high-growth global markets and optimize your business strategy:
Click Here
Pricing
- Single User License$ 1,995
- Department License$ 2,400
- Site License$ 3,120
- Global License$ 3,795

Leadership Perspectives from Industry Events
Search
Thought Leadership and Analyst Meet


Our Clients
6WResearch In News
- Doha a strategic location for EV manufacturing hub: IPA Qatar
- Demand for luxury TVs surging in the GCC, says Samsung
- Empowering Growth: The Thriving Journey of Bangladesh’s Cable Industry
- Demand for luxury TVs surging in the GCC, says Samsung
- Video call with a traditional healer? Once unthinkable, it’s now common in South Africa
- Intelligent Buildings To Smooth GCC’s Path To Net Zero
Latest Reports
- Poland Fire Protection Systems Market (2026-2032)
- Cape Verde Portable Hand-Thrown Extinguisher Market (2026-2032)
- Canada Portable Hand-Thrown Extinguisher Market (2026-2032)
- Cameroon Portable Hand-Thrown Extinguisher Market (2026-2032)
- Burundi Portable Hand-Thrown Extinguisher Market (2026-2032)
- Burkina Faso Portable Hand-Thrown Extinguisher Market (2026-2032)
- Bulgaria Portable Hand-Thrown Extinguisher Market (2026-2032)
- Brunei Portable Hand-Thrown Extinguisher Market (2026-2032)
- Botswana Portable Hand-Thrown Extinguisher Market (2026-2032)
- Bosnia and Herzegovina Portable Hand-Thrown Extinguisher Market (2026-2032)
Industry Events and Analyst Meet

HIMTEX 2026

India Refining Summit 2026

India EV Show 2026

EV tech India Expo 2026

Auto Tech Asia 2026
Whitepaper
- Middle East & Africa Commercial Security Market Click here to view more.
- Middle East & Africa Fire Safety Systems & Equipment Market Click here to view more.
- GCC Drone Market Click here to view more.
- Middle East Lighting Fixture Market Click here to view more.
- GCC Physical & Perimeter Security Market Click here to view more.