Greece Vulcanization Accelerators Market (2026-2032) | Revenue, Industry, Companies, Segmentation, Size, Value, Share, Growth, Trends, Analysis, Forecast & Outlook
Market Forecast By Product Type (Thiozoles, Sulfanamides, Dithiocarbamates, Thiuram, Others), By Application (Automotive, Industrial, Medical, Consumer Goods) And Competitive Landscape
| Product Code: ETC5331476 | Publication Date: Nov 2023 | Updated Date: Apr 2026 | Product Type: Market Research Report | |
| Publisher: 6Wresearch | Author: Ravi Bhandari | No. of Pages: 60 | No. of Figures: 30 | No. of Tables: 5 |
Greece Vulcanization Accelerators Market Size (2020-2030)
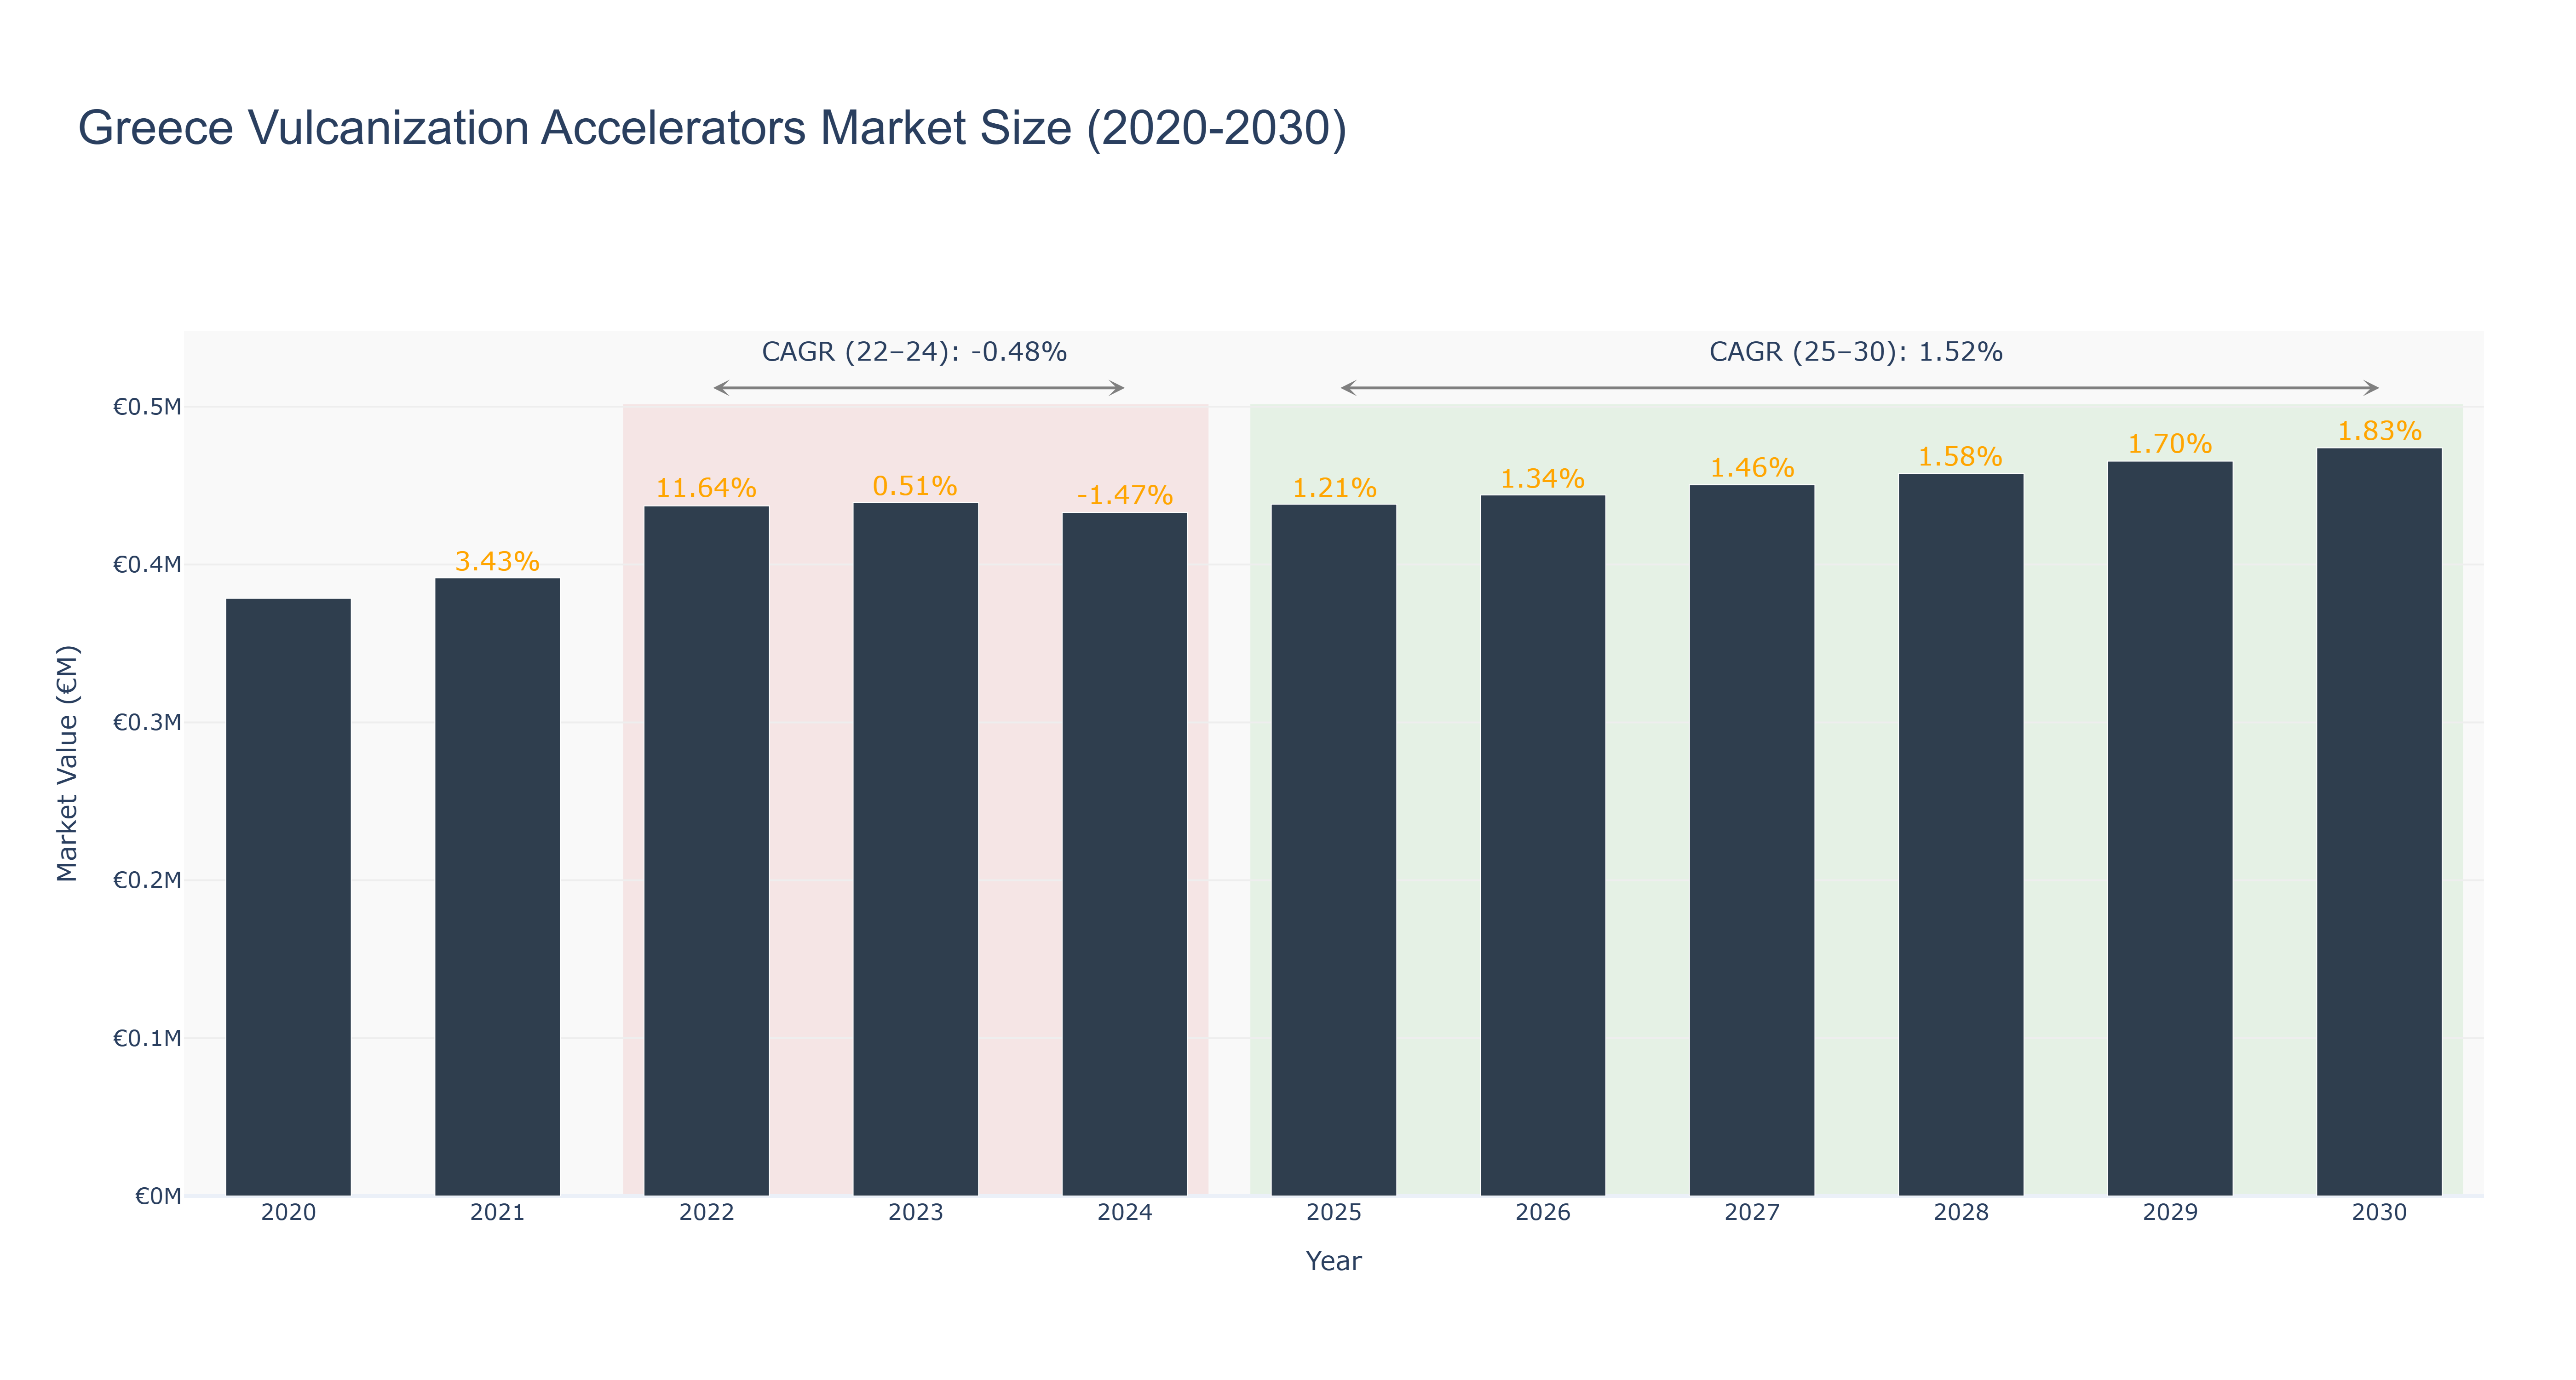
The Greece Vulcanization Accelerators Market experienced a peak market size of €0.44 million in 2022, followed by a slight decline to €0.43 million in 2024. The market is forecasted to grow steadily from €0.44 million in 2025 to €0.47 million in 2030, with a CAGR of 1.52% from 2025 to 2030. The decline in market size from 2022 to 2024 can be attributed to external factors impacting the demand for vulcanization accelerators. However, the market has shown resilience with consistent growth post-2024. Industry drivers such as increasing demand for rubber products and advancements in tire manufacturing technologies are expected to fuel market growth. Recent developments in sustainable rubber production methods and collaborations with key industry players are set to drive further expansion in the Greece Vulcanization Accelerators Market.
Greece Vulcanization Accelerators Market: Production & Trade Performance (2019-2025)
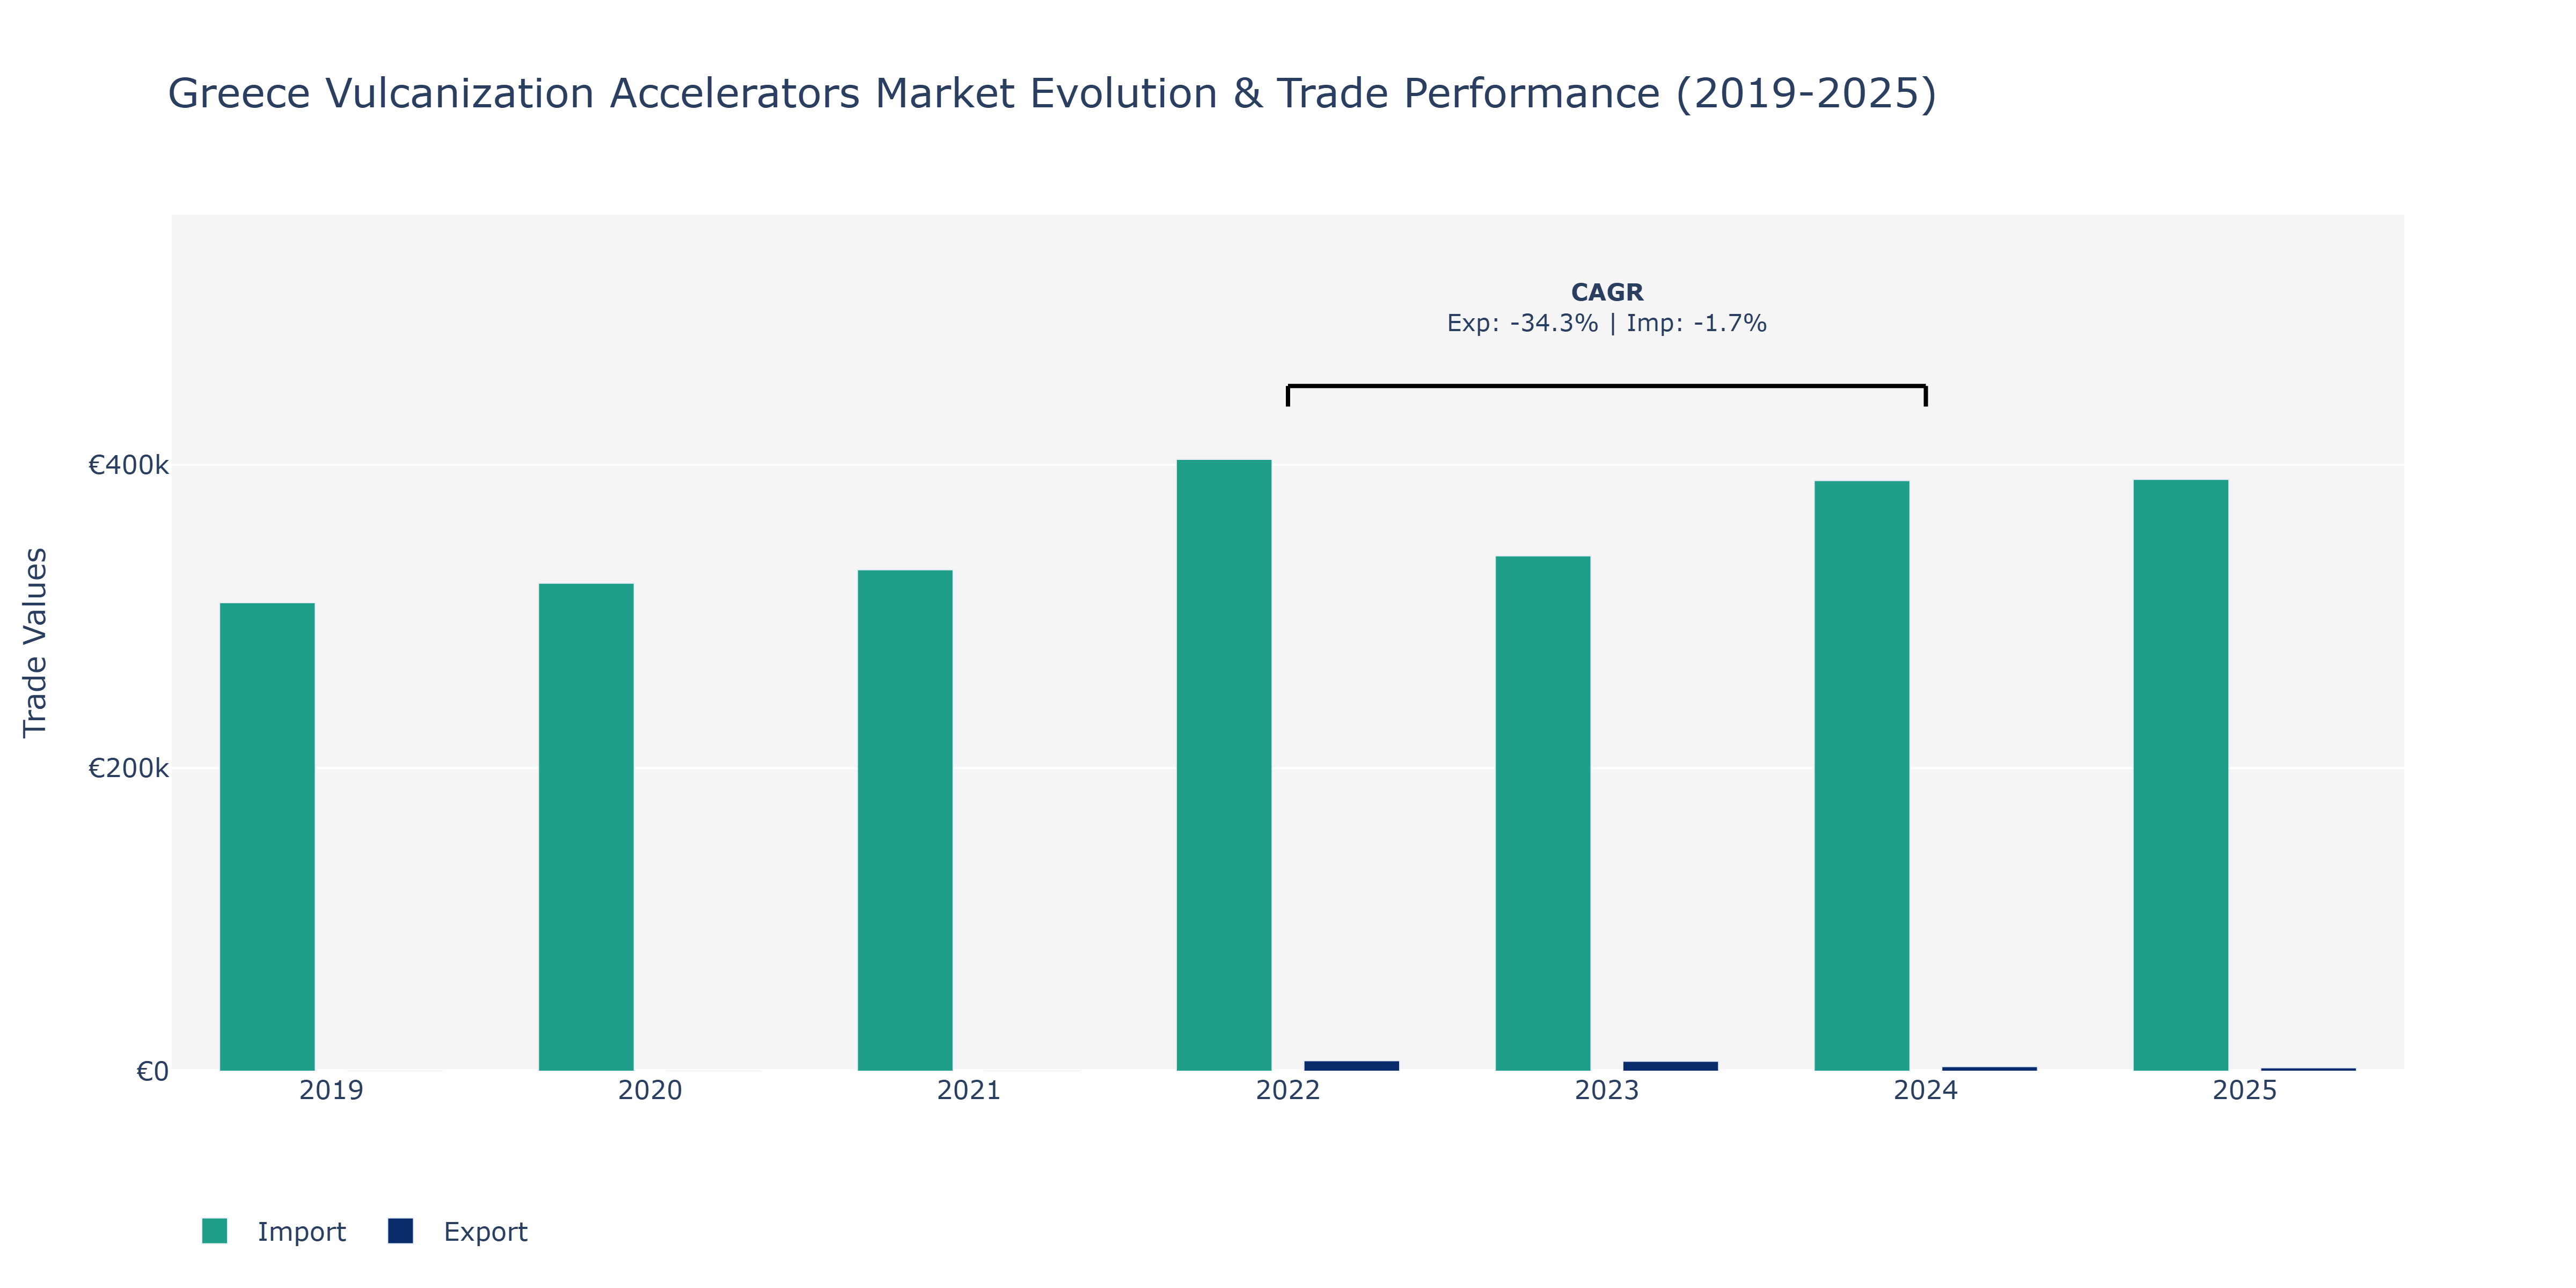
Between 2019 and 2025, Greece's Vulcanization Accelerators Market witnessed varying trends in exports and imports. The exports of Vulcanization Accelerators followed a downward trajectory, declining from €6.9 thousand in 2022 to around €2.2 thousand in 2025. In contrast, imports showed fluctuations during this period, with a peak of around €403.6 thousand in 2022. This was followed by a decrease to approximately €339.9 thousand in 2023, and subsequently an increase to around €390.4 thousand in 2025. The increase in imports could be attributed to Greece's reliance on imported raw materials for the production of Vulcanization Accelerators. On the other hand, the decline in exports might be influenced by increasing competition from other market players offering similar products at more competitive prices. These trends indicate the need for local manufacturers to enhance efficiency and competitiveness to maintain a strong position in the global market.
Key Highlights of the Report:
- Greece Vulcanization Accelerators Market Outlook
- Market Size of Greece Vulcanization Accelerators Market, 2025
- Forecast of Greece Vulcanization Accelerators Market, 2032
- Historical Data and Forecast of Greece Vulcanization Accelerators Revenues & Volume for the Period 2022-2032F
- Greece Vulcanization Accelerators Market Trend Evolution
- Greece Vulcanization Accelerators Market Drivers and Challenges
- Greece Vulcanization Accelerators Price Trends
- Greece Vulcanization Accelerators Porter`s Five Forces
- Greece Vulcanization Accelerators Industry Life Cycle
- Historical Data and Forecast of Greece Vulcanization Accelerators Market Revenues & Volume By Product Type for the Period 2022-2032F
- Historical Data and Forecast of Greece Vulcanization Accelerators Market Revenues & Volume By Thiozoles for the Period 2022-2032F
- Historical Data and Forecast of Greece Vulcanization Accelerators Market Revenues & Volume By Sulfanamides for the Period 2022-2032F
- Historical Data and Forecast of Greece Vulcanization Accelerators Market Revenues & Volume By Dithiocarbamates for the Period 2022-2032F
- Historical Data and Forecast of Greece Vulcanization Accelerators Market Revenues & Volume By Thiuram for the Period 2022-2032F
- Historical Data and Forecast of Greece Vulcanization Accelerators Market Revenues & Volume By Others for the Period 2022-2032F
- Historical Data and Forecast of Greece Vulcanization Accelerators Market Revenues & Volume By Application for the Period 2022-2032F
- Historical Data and Forecast of Greece Vulcanization Accelerators Market Revenues & Volume By Automotive for the Period 2022-2032F
- Historical Data and Forecast of Greece Vulcanization Accelerators Market Revenues & Volume By Industrial for the Period 2022-2032F
- Historical Data and Forecast of Greece Vulcanization Accelerators Market Revenues & Volume By Medical for the Period 2022-2032F
- Historical Data and Forecast of Greece Vulcanization Accelerators Market Revenues & Volume By Consumer Goods for the Period 2022-2032F
- Greece Vulcanization Accelerators Import Export Trade Statistics
- Market Opportunity Assessment By Product Type
- Market Opportunity Assessment By Application
- Greece Vulcanization Accelerators Top Companies Market Share
- Greece Vulcanization Accelerators Competitive Benchmarking By Technical and Operational Parameters
- Greece Vulcanization Accelerators Company Profiles
- Greece Vulcanization Accelerators Key Strategic Recommendations
Frequently Asked Questions About the Market Study (FAQs):
6Wresearch actively monitors the Greece Vulcanization Accelerators Market and publishes its comprehensive annual report, highlighting emerging trends, growth drivers, revenue analysis, and forecast outlook. Our insights help businesses to make data-backed strategic decisions with ongoing market dynamics. Our analysts track relevent industries related to the Greece Vulcanization Accelerators Market, allowing our clients with actionable intelligence and reliable forecasts tailored to emerging regional needs.
Yes, we provide customisation as per your requirements. To learn more, feel free to contact us on sales@6wresearch.com
1 Executive Summary |
2 Introduction |
2.1 Key Highlights of the Report |
2.2 Report Description |
2.3 Market Scope & Segmentation |
2.4 Research Methodology |
2.5 Assumptions |
3 Greece Vulcanization Accelerators Market Overview |
3.1 Greece Country Macro Economic Indicators |
3.2 Greece Vulcanization Accelerators Market Revenues & Volume, 2022 & 2032F |
3.3 Greece Vulcanization Accelerators Market - Industry Life Cycle |
3.4 Greece Vulcanization Accelerators Market - Porter's Five Forces |
3.5 Greece Vulcanization Accelerators Market Revenues & Volume Share, By Product Type, 2022 & 2032F |
3.6 Greece Vulcanization Accelerators Market Revenues & Volume Share, By Application, 2022 & 2032F |
4 Greece Vulcanization Accelerators Market Dynamics |
4.1 Impact Analysis |
4.2 Market Drivers |
4.2.1 Growing demand for rubber products across various industries in Greece |
4.2.2 Increasing focus on improving the performance and durability of rubber products |
4.2.3 Technological advancements in vulcanization accelerators leading to enhanced product offerings |
4.3 Market Restraints |
4.3.1 Fluctuating prices of raw materials used in vulcanization accelerators production |
4.3.2 Stringent regulatory standards and environmental concerns related to chemical additives in rubber products |
5 Greece Vulcanization Accelerators Market Trends |
6 Greece Vulcanization Accelerators Market Segmentations |
6.1 Greece Vulcanization Accelerators Market, By Product Type |
6.1.1 Overview and Analysis |
6.1.2 Greece Vulcanization Accelerators Market Revenues & Volume, By Thiozoles, 2022-2032F |
6.1.3 Greece Vulcanization Accelerators Market Revenues & Volume, By Sulfanamides, 2022-2032F |
6.1.4 Greece Vulcanization Accelerators Market Revenues & Volume, By Dithiocarbamates, 2022-2032F |
6.1.5 Greece Vulcanization Accelerators Market Revenues & Volume, By Thiuram, 2022-2032F |
6.1.6 Greece Vulcanization Accelerators Market Revenues & Volume, By Others, 2022-2032F |
6.2 Greece Vulcanization Accelerators Market, By Application |
6.2.1 Overview and Analysis |
6.2.2 Greece Vulcanization Accelerators Market Revenues & Volume, By Automotive, 2022-2032F |
6.2.3 Greece Vulcanization Accelerators Market Revenues & Volume, By Industrial, 2022-2032F |
6.2.4 Greece Vulcanization Accelerators Market Revenues & Volume, By Medical, 2022-2032F |
6.2.5 Greece Vulcanization Accelerators Market Revenues & Volume, By Consumer Goods, 2022-2032F |
7 Greece Vulcanization Accelerators Market Import-Export Trade Statistics |
7.1 Greece Vulcanization Accelerators Market Export to Major Countries |
7.2 Greece Vulcanization Accelerators Market Imports from Major Countries |
8 Greece Vulcanization Accelerators Market Key Performance Indicators |
8.1 Research and development investment in new vulcanization accelerator formulations |
8.2 Adoption rate of innovative vulcanization accelerator technologies in the market |
8.3 Number of partnerships and collaborations for expanding market presence and distribution channels |
8.4 Customer satisfaction and retention rates for vulcanization accelerator products |
8.5 Rate of new product introductions and successful market penetration. |
9 Greece Vulcanization Accelerators Market - Opportunity Assessment |
9.1 Greece Vulcanization Accelerators Market Opportunity Assessment, By Product Type, 2022 & 2032F |
9.2 Greece Vulcanization Accelerators Market Opportunity Assessment, By Application, 2022 & 2032F |
10 Greece Vulcanization Accelerators Market - Competitive Landscape |
10.1 Greece Vulcanization Accelerators Market Revenue Share, By Companies, 2025 |
10.2 Greece Vulcanization Accelerators Market Competitive Benchmarking, By Operating and Technical Parameters |
11 Company Profiles |
12 Recommendations | 13 Disclaimer |
Export potential assessment - trade Analytics for 2030
Export potential enables firms to identify high-growth global markets with greater confidence by combining advanced trade intelligence with a structured quantitative methodology. The framework analyzes emerging demand trends and country-level import patterns while integrating macroeconomic and trade datasets such as GDP and population forecasts, bilateral import–export flows, tariff structures, elasticity differentials between developed and developing economies, geographic distance, and import demand projections. Using weighted trade values from 2020–2024 as the base period to project country-to-country export potential for 2030, these inputs are operationalized through calculated drivers such as gravity model parameters, tariff impact factors, and projected GDP per-capita growth. Through an analysis of hidden potentials, demand hotspots, and market conditions that are most favorable to success, this method enables firms to focus on target countries, maximize returns, and global expansion with data, backed by accuracy.
By factoring in the projected importer demand gap that is currently unmet and could be potential opportunity, it identifies the potential for the Exporter (Country) among 190 countries, against the general trade analysis, which identifies the biggest importer or exporter.
To discover high-growth global markets and optimize your business strategy:
Click Here
Pricing
- Single User License$ 1,995
- Department License$ 2,400
- Site License$ 3,120
- Global License$ 3,795

Search
Thought Leadership and Analyst Meet


Our Clients
Latest Reports
- Philippines Polyhydroxybutyrate-co-Hydroxyvalerate Market (2026-2032) | Trends, Insights, Challenges, Restraints, Competition, Size, Value, Forecast, Pricing, Share, Outlook, Revenue, Investment Opportunities, Strategy, Drivers, Demand, Growth, segmentation, Analysis, Companies
- Peru Polyhydroxybutyrate-co-Hydroxyvalerate Market (2026-2032) | Growth, Demand, Challenges, Share, Trends, Analysis, Pricing, Investment Opportunities, Drivers, Value, Forecast, Competition, Size, Companies, Insights, Outlook, Restraints, segmentation, Revenue, Strategy
- Pakistan Polyhydroxybutyrate-co-Hydroxyvalerate Market (2026-2032) | Restraints, segmentation, Pricing, Forecast, Share, Strategy, Competition, Trends, Insights, Drivers, Challenges, Growth, Revenue, Outlook, Value, Investment Opportunities, Companies, Size, Analysis, Demand
- Oman Polyhydroxybutyrate-co-Hydroxyvalerate Market (2026-2032) | Drivers, segmentation, Insights, Competition, Pricing, Outlook, Size, Revenue, Challenges, Forecast, Analysis, Growth, Value, Share, Trends, Investment Opportunities, Strategy, Restraints, Companies, Demand
- Nigeria Polyhydroxybutyrate-co-Hydroxyvalerate Market (2026-2032) | Value, Investment Opportunities, Analysis, Revenue, Restraints, Pricing, Outlook, Competition, Demand, Growth, Forecast, Companies, Trends, Challenges, segmentation, Drivers, Insights, Share, Size, Strategy
- Nepal Polyhydroxybutyrate-co-Hydroxyvalerate Market (2026-2032) | Insights, Analysis, Drivers, Share, Revenue, Demand, segmentation, Investment Opportunities, Competition, Forecast, Growth, Pricing, Companies, Strategy, Trends, Restraints, Challenges, Outlook, Size, Value
- Myanmar Polyhydroxybutyrate-co-Hydroxyvalerate Market (2026-2032) | Outlook, Revenue, Strategy, Restraints, Drivers, segmentation, Share, Forecast, Competition, Insights, Growth, Pricing, Size, Demand, Value, Companies, Trends, Challenges, Investment Opportunities, Analysis
- Morocco Polyhydroxybutyrate-co-Hydroxyvalerate Market (2026-2032) | Outlook, Investment Opportunities, Restraints, Strategy, Forecast, Challenges, Drivers, Growth, Companies, segmentation, Trends, Size, Competition, Revenue, Demand, Insights, Share, Analysis, Value, Pricing
- Mexico Polyhydroxybutyrate-co-Hydroxyvalerate Market (2026-2032) | Size, Drivers, Outlook, Share, Strategy, Growth, Pricing, Challenges, Companies, Demand, Value, Investment Opportunities, Restraints, Trends, Forecast, segmentation, Analysis, Insights, Competition, Revenue
- Malaysia Polyhydroxybutyrate-co-Hydroxyvalerate Market (2026-2032) | Share, segmentation, Size, Companies, Analysis, Insights, Forecast, Value, Revenue, Drivers, Restraints, Challenges, Investment Opportunities, Trends, Competition, Strategy, Demand, Growth, Outlook, Pricing
Industry Events and Analyst Meet

HIMTEX 2026

India Refining Summit 2026

India EV Show 2026

EV tech India Expo 2026

Auto Tech Asia 2026
Whitepaper
- Middle East & Africa Commercial Security Market Click here to view more.
- Middle East & Africa Fire Safety Systems & Equipment Market Click here to view more.
- GCC Drone Market Click here to view more.
- Middle East Lighting Fixture Market Click here to view more.
- GCC Physical & Perimeter Security Market Click here to view more.
6WResearch In News
- Doha a strategic location for EV manufacturing hub: IPA Qatar
- Demand for luxury TVs surging in the GCC, says Samsung
- Empowering Growth: The Thriving Journey of Bangladesh’s Cable Industry
- Demand for luxury TVs surging in the GCC, says Samsung
- Video call with a traditional healer? Once unthinkable, it’s now common in South Africa
- Intelligent Buildings To Smooth GCC’s Path To Net Zero