Grenada Nutritional Snacks Market (2026-2032) | Investment Trends, Drivers, Revenue, Strategic Insights, Restraints, Segmentation, Companies, Consumer Insights, Pricing Analysis, Value, Competitive, Size, Challenges, Demand, Segments, Competition, Trends, Share, Outlook, Supply, Industry, Opportunities, Forecast, Analysis, Strategy, Growth
Market Forecast By Type (High-Protein, Low-Calorie, Organic, Functional Snacks), By Application Area (Post-Workout, Weight Loss, Healthy Lifestyle, Immunity Boost), By End User (Athletes, Dieters, Health Enthusiasts, General Consumers), By Product Type (Protein Bars, Baked Chips, Organic Trail Mix, Vitamin-Enriched Crackers) And Competitive Landscape
| Product Code: ETC12708070 | Publication Date: Apr 2025 | Updated Date: Apr 2026 | Product Type: Market Research Report | |
| Publisher: 6Wresearch | Author: Sachin Kumar Rai | No. of Pages: 65 | No. of Figures: 34 | No. of Tables: 19 |
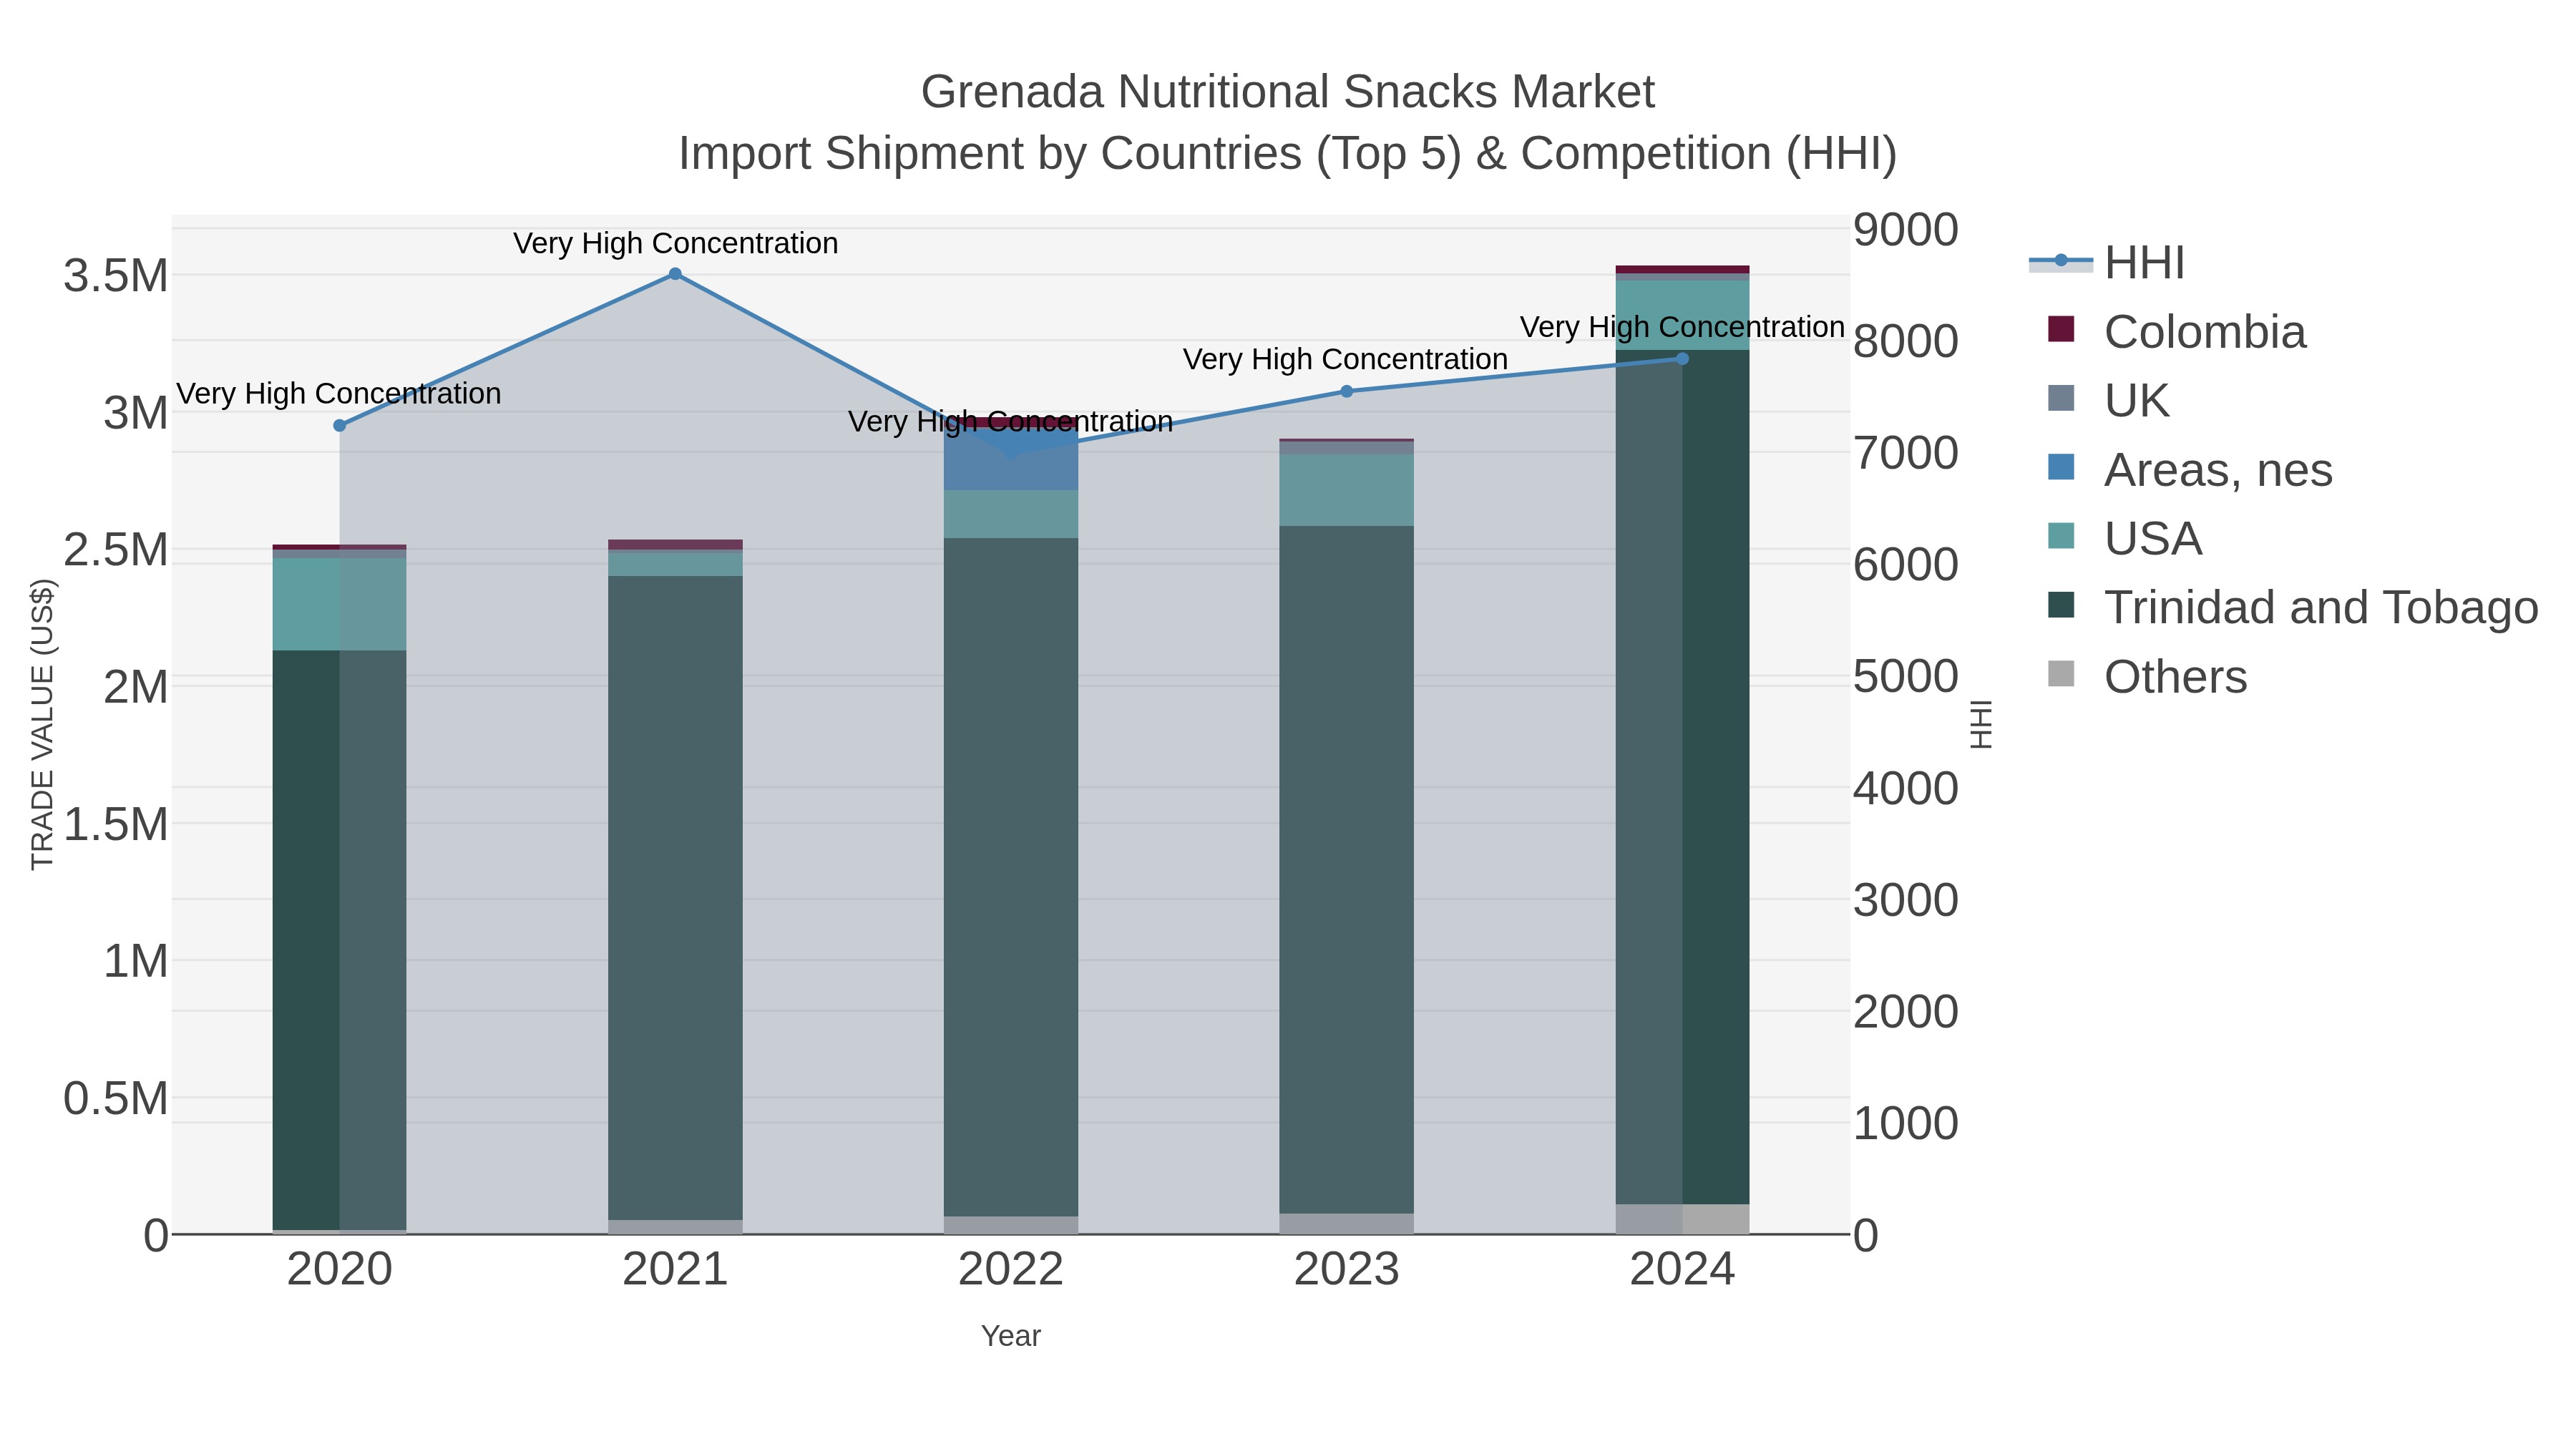
Grenada Nutritional Snacks Market Top 5 Importing Countries and Market Competition (HHI) Analysis
In 2024, Grenada continued to see significant import shipments of nutritional snacks, with top suppliers including Trinidad and Tobago, USA, Jamaica, India, and Colombia. The high Herfindahl-Hirschman Index (HHI) indicates a concentrated market, while the impressive compound annual growth rate (CAGR) of 8.85% from 2020-2024 highlights sustained expansion. Notably, the growth rate surged to 21.69% in 2024, signaling strong demand for nutritional snacks in Grenada. This data suggests a promising market for suppliers looking to capitalize on the growing appetite for healthy snack options in the country.
Key Highlights of the Report:
- Grenada Nutritional Snacks Market Outlook
- Market Size of Grenada Nutritional Snacks Market, 2025
- Forecast of Grenada Nutritional Snacks Market, 2032
- Historical Data and Forecast of Grenada Nutritional Snacks Revenues & Volume for the Period 2022 - 2032F
- Grenada Nutritional Snacks Market Trend Evolution
- Grenada Nutritional Snacks Market Drivers and Challenges
- Grenada Nutritional Snacks Price Trends
- Grenada Nutritional Snacks Porter's Five Forces
- Grenada Nutritional Snacks Industry Life Cycle
- Historical Data and Forecast of Grenada Nutritional Snacks Market Revenues & Volume By Type for the Period 2022 - 2032F
- Historical Data and Forecast of Grenada Nutritional Snacks Market Revenues & Volume By High-Protein for the Period 2022 - 2032F
- Historical Data and Forecast of Grenada Nutritional Snacks Market Revenues & Volume By Low-Calorie for the Period 2022 - 2032F
- Historical Data and Forecast of Grenada Nutritional Snacks Market Revenues & Volume By Organic for the Period 2022 - 2032F
- Historical Data and Forecast of Grenada Nutritional Snacks Market Revenues & Volume By Functional Snacks for the Period 2022 - 2032F
- Historical Data and Forecast of Grenada Nutritional Snacks Market Revenues & Volume By Application Area for the Period 2022 - 2032F
- Historical Data and Forecast of Grenada Nutritional Snacks Market Revenues & Volume By Post-Workout for the Period 2022 - 2032F
- Historical Data and Forecast of Grenada Nutritional Snacks Market Revenues & Volume By Weight Loss for the Period 2022 - 2032F
- Historical Data and Forecast of Grenada Nutritional Snacks Market Revenues & Volume By Healthy Lifestyle for the Period 2022 - 2032F
- Historical Data and Forecast of Grenada Nutritional Snacks Market Revenues & Volume By Immunity Boost for the Period 2022 - 2032F
- Historical Data and Forecast of Grenada Nutritional Snacks Market Revenues & Volume By End User for the Period 2022 - 2032F
- Historical Data and Forecast of Grenada Nutritional Snacks Market Revenues & Volume By Athletes for the Period 2022 - 2032F
- Historical Data and Forecast of Grenada Nutritional Snacks Market Revenues & Volume By Dieters for the Period 2022 - 2032F
- Historical Data and Forecast of Grenada Nutritional Snacks Market Revenues & Volume By Health Enthusiasts for the Period 2022 - 2032F
- Historical Data and Forecast of Grenada Nutritional Snacks Market Revenues & Volume By General Consumers for the Period 2022 - 2032F
- Historical Data and Forecast of Grenada Nutritional Snacks Market Revenues & Volume By Product Type for the Period 2022 - 2032F
- Historical Data and Forecast of Grenada Nutritional Snacks Market Revenues & Volume By Protein Bars for the Period 2022 - 2032F
- Historical Data and Forecast of Grenada Nutritional Snacks Market Revenues & Volume By Baked Chips for the Period 2022 - 2032F
- Historical Data and Forecast of Grenada Nutritional Snacks Market Revenues & Volume By Organic Trail Mix for the Period 2022 - 2032F
- Historical Data and Forecast of Grenada Nutritional Snacks Market Revenues & Volume By Vitamin-Enriched Crackers for the Period 2022 - 2032F
- Grenada Nutritional Snacks Import Export Trade Statistics
- Market Opportunity Assessment By Type
- Market Opportunity Assessment By Application Area
- Market Opportunity Assessment By End User
- Market Opportunity Assessment By Product Type
- Grenada Nutritional Snacks Top Companies Market Share
- Grenada Nutritional Snacks Competitive Benchmarking By Technical and Operational Parameters
- Grenada Nutritional Snacks Company Profiles
- Grenada Nutritional Snacks Key Strategic Recommendations
Frequently Asked Questions About the Market Study (FAQs):
6Wresearch actively monitors the Grenada Nutritional Snacks Market and publishes its comprehensive annual report, highlighting emerging trends, growth drivers, revenue analysis, and forecast outlook. Our insights help businesses to make data-backed strategic decisions with ongoing market dynamics. Our analysts track relevent industries related to the Grenada Nutritional Snacks Market, allowing our clients with actionable intelligence and reliable forecasts tailored to emerging regional needs.
Yes, we provide customisation as per your requirements. To learn more, feel free to contact us on sales@6wresearch.com
1 Executive Summary |
2 Introduction |
2.1 Key Highlights of the Report |
2.2 Report Description |
2.3 Market Scope & Segmentation |
2.4 Research Methodology |
2.5 Assumptions |
3 Grenada Nutritional Snacks Market Overview |
3.1 Grenada Country Macro Economic Indicators |
3.2 Grenada Nutritional Snacks Market Revenues & Volume, 2022 & 2032F |
3.3 Grenada Nutritional Snacks Market - Industry Life Cycle |
3.4 Grenada Nutritional Snacks Market - Porter's Five Forces |
3.5 Grenada Nutritional Snacks Market Revenues & Volume Share, By Type, 2022 & 2032F |
3.6 Grenada Nutritional Snacks Market Revenues & Volume Share, By Application Area, 2022 & 2032F |
3.7 Grenada Nutritional Snacks Market Revenues & Volume Share, By End User, 2022 & 2032F |
3.8 Grenada Nutritional Snacks Market Revenues & Volume Share, By Product Type, 2022 & 2032F |
4 Grenada Nutritional Snacks Market Dynamics |
4.1 Impact Analysis |
4.2 Market Drivers |
4.2.1 Increasing consumer awareness of health and wellness leading to a growing demand for nutritious snacks. |
4.2.2 Rising disposable income in Grenada, enabling consumers to spend more on premium nutritional snacks. |
4.2.3 Growing trend of snacking on-the-go, driving the demand for convenient and healthy snack options. |
4.3 Market Restraints |
4.3.1 High cost of production and raw materials, impacting the pricing of nutritional snacks. |
4.3.2 Limited availability of locally sourced ingredients, leading to dependency on imports for certain key ingredients. |
5 Grenada Nutritional Snacks Market Trends |
6 Grenada Nutritional Snacks Market, By Types |
6.1 Grenada Nutritional Snacks Market, By Type |
6.1.1 Overview and Analysis |
6.1.2 Grenada Nutritional Snacks Market Revenues & Volume, By Type, 2022 - 2032F |
6.1.3 Grenada Nutritional Snacks Market Revenues & Volume, By High-Protein, 2022 - 2032F |
6.1.4 Grenada Nutritional Snacks Market Revenues & Volume, By Low-Calorie, 2022 - 2032F |
6.1.5 Grenada Nutritional Snacks Market Revenues & Volume, By Organic, 2022 - 2032F |
6.1.6 Grenada Nutritional Snacks Market Revenues & Volume, By Functional Snacks, 2022 - 2032F |
6.2 Grenada Nutritional Snacks Market, By Application Area |
6.2.1 Overview and Analysis |
6.2.2 Grenada Nutritional Snacks Market Revenues & Volume, By Post-Workout, 2022 - 2032F |
6.2.3 Grenada Nutritional Snacks Market Revenues & Volume, By Weight Loss, 2022 - 2032F |
6.2.4 Grenada Nutritional Snacks Market Revenues & Volume, By Healthy Lifestyle, 2022 - 2032F |
6.2.5 Grenada Nutritional Snacks Market Revenues & Volume, By Immunity Boost, 2022 - 2032F |
6.3 Grenada Nutritional Snacks Market, By End User |
6.3.1 Overview and Analysis |
6.3.2 Grenada Nutritional Snacks Market Revenues & Volume, By Athletes, 2022 - 2032F |
6.3.3 Grenada Nutritional Snacks Market Revenues & Volume, By Dieters, 2022 - 2032F |
6.3.4 Grenada Nutritional Snacks Market Revenues & Volume, By Health Enthusiasts, 2022 - 2032F |
6.3.5 Grenada Nutritional Snacks Market Revenues & Volume, By General Consumers, 2022 - 2032F |
6.4 Grenada Nutritional Snacks Market, By Product Type |
6.4.1 Overview and Analysis |
6.4.2 Grenada Nutritional Snacks Market Revenues & Volume, By Protein Bars, 2022 - 2032F |
6.4.3 Grenada Nutritional Snacks Market Revenues & Volume, By Baked Chips, 2022 - 2032F |
6.4.4 Grenada Nutritional Snacks Market Revenues & Volume, By Organic Trail Mix, 2022 - 2032F |
6.4.5 Grenada Nutritional Snacks Market Revenues & Volume, By Vitamin-Enriched Crackers, 2022 - 2032F |
7 Grenada Nutritional Snacks Market Import-Export Trade Statistics |
7.1 Grenada Nutritional Snacks Market Export to Major Countries |
7.2 Grenada Nutritional Snacks Market Imports from Major Countries |
8 Grenada Nutritional Snacks Market Key Performance Indicators |
8.1 Consumer engagement metrics such as website/app visits, social media interactions, and email open rates to gauge interest and awareness. |
8.2 Number of distribution channels and partnerships established to measure market reach and accessibility of Grenada nutritional snacks. |
8.3 Percentage of repeat customers and customer retention rate to assess product satisfaction and loyalty. |
8.4 Nutritional content and ingredient transparency metrics to showcase the quality and health benefits of Grenada nutritional snacks. |
8.5 Sustainability initiatives and certifications obtained to demonstrate commitment to ethical and environmentally friendly practices. |
9 Grenada Nutritional Snacks Market - Opportunity Assessment |
9.1 Grenada Nutritional Snacks Market Opportunity Assessment, By Type, 2022 & 2032F |
9.2 Grenada Nutritional Snacks Market Opportunity Assessment, By Application Area, 2022 & 2032F |
9.3 Grenada Nutritional Snacks Market Opportunity Assessment, By End User, 2022 & 2032F |
9.4 Grenada Nutritional Snacks Market Opportunity Assessment, By Product Type, 2022 & 2032F |
10 Grenada Nutritional Snacks Market - Competitive Landscape |
10.1 Grenada Nutritional Snacks Market Revenue Share, By Companies, 2025 |
10.2 Grenada Nutritional Snacks Market Competitive Benchmarking, By Operating and Technical Parameters |
11 Company Profiles |
12 Recommendations |
13 Disclaimer |
Export potential assessment - trade Analytics for 2030
Export potential enables firms to identify high-growth global markets with greater confidence by combining advanced trade intelligence with a structured quantitative methodology. The framework analyzes emerging demand trends and country-level import patterns while integrating macroeconomic and trade datasets such as GDP and population forecasts, bilateral import–export flows, tariff structures, elasticity differentials between developed and developing economies, geographic distance, and import demand projections. Using weighted trade values from 2020–2024 as the base period to project country-to-country export potential for 2030, these inputs are operationalized through calculated drivers such as gravity model parameters, tariff impact factors, and projected GDP per-capita growth. Through an analysis of hidden potentials, demand hotspots, and market conditions that are most favorable to success, this method enables firms to focus on target countries, maximize returns, and global expansion with data, backed by accuracy.
By factoring in the projected importer demand gap that is currently unmet and could be potential opportunity, it identifies the potential for the Exporter (Country) among 190 countries, against the general trade analysis, which identifies the biggest importer or exporter.
To discover high-growth global markets and optimize your business strategy:
Click Here
Pricing
- Single User License$ 1,995
- Department License$ 2,400
- Site License$ 3,120
- Global License$ 3,795

Search
Thought Leadership and Analyst Meet


Our Clients
Latest Reports
- Philippines Polyhydroxybutyrate-co-Hydroxyvalerate Market (2026-2032) | Trends, Insights, Challenges, Restraints, Competition, Size, Value, Forecast, Pricing, Share, Outlook, Revenue, Investment Opportunities, Strategy, Drivers, Demand, Growth, segmentation, Analysis, Companies
- Peru Polyhydroxybutyrate-co-Hydroxyvalerate Market (2026-2032) | Growth, Demand, Challenges, Share, Trends, Analysis, Pricing, Investment Opportunities, Drivers, Value, Forecast, Competition, Size, Companies, Insights, Outlook, Restraints, segmentation, Revenue, Strategy
- Pakistan Polyhydroxybutyrate-co-Hydroxyvalerate Market (2026-2032) | Restraints, segmentation, Pricing, Forecast, Share, Strategy, Competition, Trends, Insights, Drivers, Challenges, Growth, Revenue, Outlook, Value, Investment Opportunities, Companies, Size, Analysis, Demand
- Oman Polyhydroxybutyrate-co-Hydroxyvalerate Market (2026-2032) | Drivers, segmentation, Insights, Competition, Pricing, Outlook, Size, Revenue, Challenges, Forecast, Analysis, Growth, Value, Share, Trends, Investment Opportunities, Strategy, Restraints, Companies, Demand
- Nigeria Polyhydroxybutyrate-co-Hydroxyvalerate Market (2026-2032) | Value, Investment Opportunities, Analysis, Revenue, Restraints, Pricing, Outlook, Competition, Demand, Growth, Forecast, Companies, Trends, Challenges, segmentation, Drivers, Insights, Share, Size, Strategy
- Nepal Polyhydroxybutyrate-co-Hydroxyvalerate Market (2026-2032) | Insights, Analysis, Drivers, Share, Revenue, Demand, segmentation, Investment Opportunities, Competition, Forecast, Growth, Pricing, Companies, Strategy, Trends, Restraints, Challenges, Outlook, Size, Value
- Myanmar Polyhydroxybutyrate-co-Hydroxyvalerate Market (2026-2032) | Outlook, Revenue, Strategy, Restraints, Drivers, segmentation, Share, Forecast, Competition, Insights, Growth, Pricing, Size, Demand, Value, Companies, Trends, Challenges, Investment Opportunities, Analysis
- Morocco Polyhydroxybutyrate-co-Hydroxyvalerate Market (2026-2032) | Outlook, Investment Opportunities, Restraints, Strategy, Forecast, Challenges, Drivers, Growth, Companies, segmentation, Trends, Size, Competition, Revenue, Demand, Insights, Share, Analysis, Value, Pricing
- Mexico Polyhydroxybutyrate-co-Hydroxyvalerate Market (2026-2032) | Size, Drivers, Outlook, Share, Strategy, Growth, Pricing, Challenges, Companies, Demand, Value, Investment Opportunities, Restraints, Trends, Forecast, segmentation, Analysis, Insights, Competition, Revenue
- Malaysia Polyhydroxybutyrate-co-Hydroxyvalerate Market (2026-2032) | Share, segmentation, Size, Companies, Analysis, Insights, Forecast, Value, Revenue, Drivers, Restraints, Challenges, Investment Opportunities, Trends, Competition, Strategy, Demand, Growth, Outlook, Pricing
Industry Events and Analyst Meet

HIMTEX 2026

India Refining Summit 2026

India EV Show 2026

EV tech India Expo 2026

Auto Tech Asia 2026
Whitepaper
- Middle East & Africa Commercial Security Market Click here to view more.
- Middle East & Africa Fire Safety Systems & Equipment Market Click here to view more.
- GCC Drone Market Click here to view more.
- Middle East Lighting Fixture Market Click here to view more.
- GCC Physical & Perimeter Security Market Click here to view more.
6WResearch In News
- Doha a strategic location for EV manufacturing hub: IPA Qatar
- Demand for luxury TVs surging in the GCC, says Samsung
- Empowering Growth: The Thriving Journey of Bangladesh’s Cable Industry
- Demand for luxury TVs surging in the GCC, says Samsung
- Video call with a traditional healer? Once unthinkable, it’s now common in South Africa
- Intelligent Buildings To Smooth GCC’s Path To Net Zero