Guatemala Soy Sauce Market (2025-2031) | Forecast, Outlook, Analysis, Companies, Growth, Size, Trends, Segmentation, Industry, Value, Share & Revenue
Market Forecast By Product Type (Brewed, Blended), By Application (Household, Food Industry) And Competitive Landscape
| Product Code: ETC4661291 | Publication Date: Nov 2023 | Updated Date: Nov 2025 | Product Type: Market Research Report | |
| Publisher: 6Wresearch | Author: Shubham Padhi | No. of Pages: 60 | No. of Figures: 30 | No. of Tables: 5 |
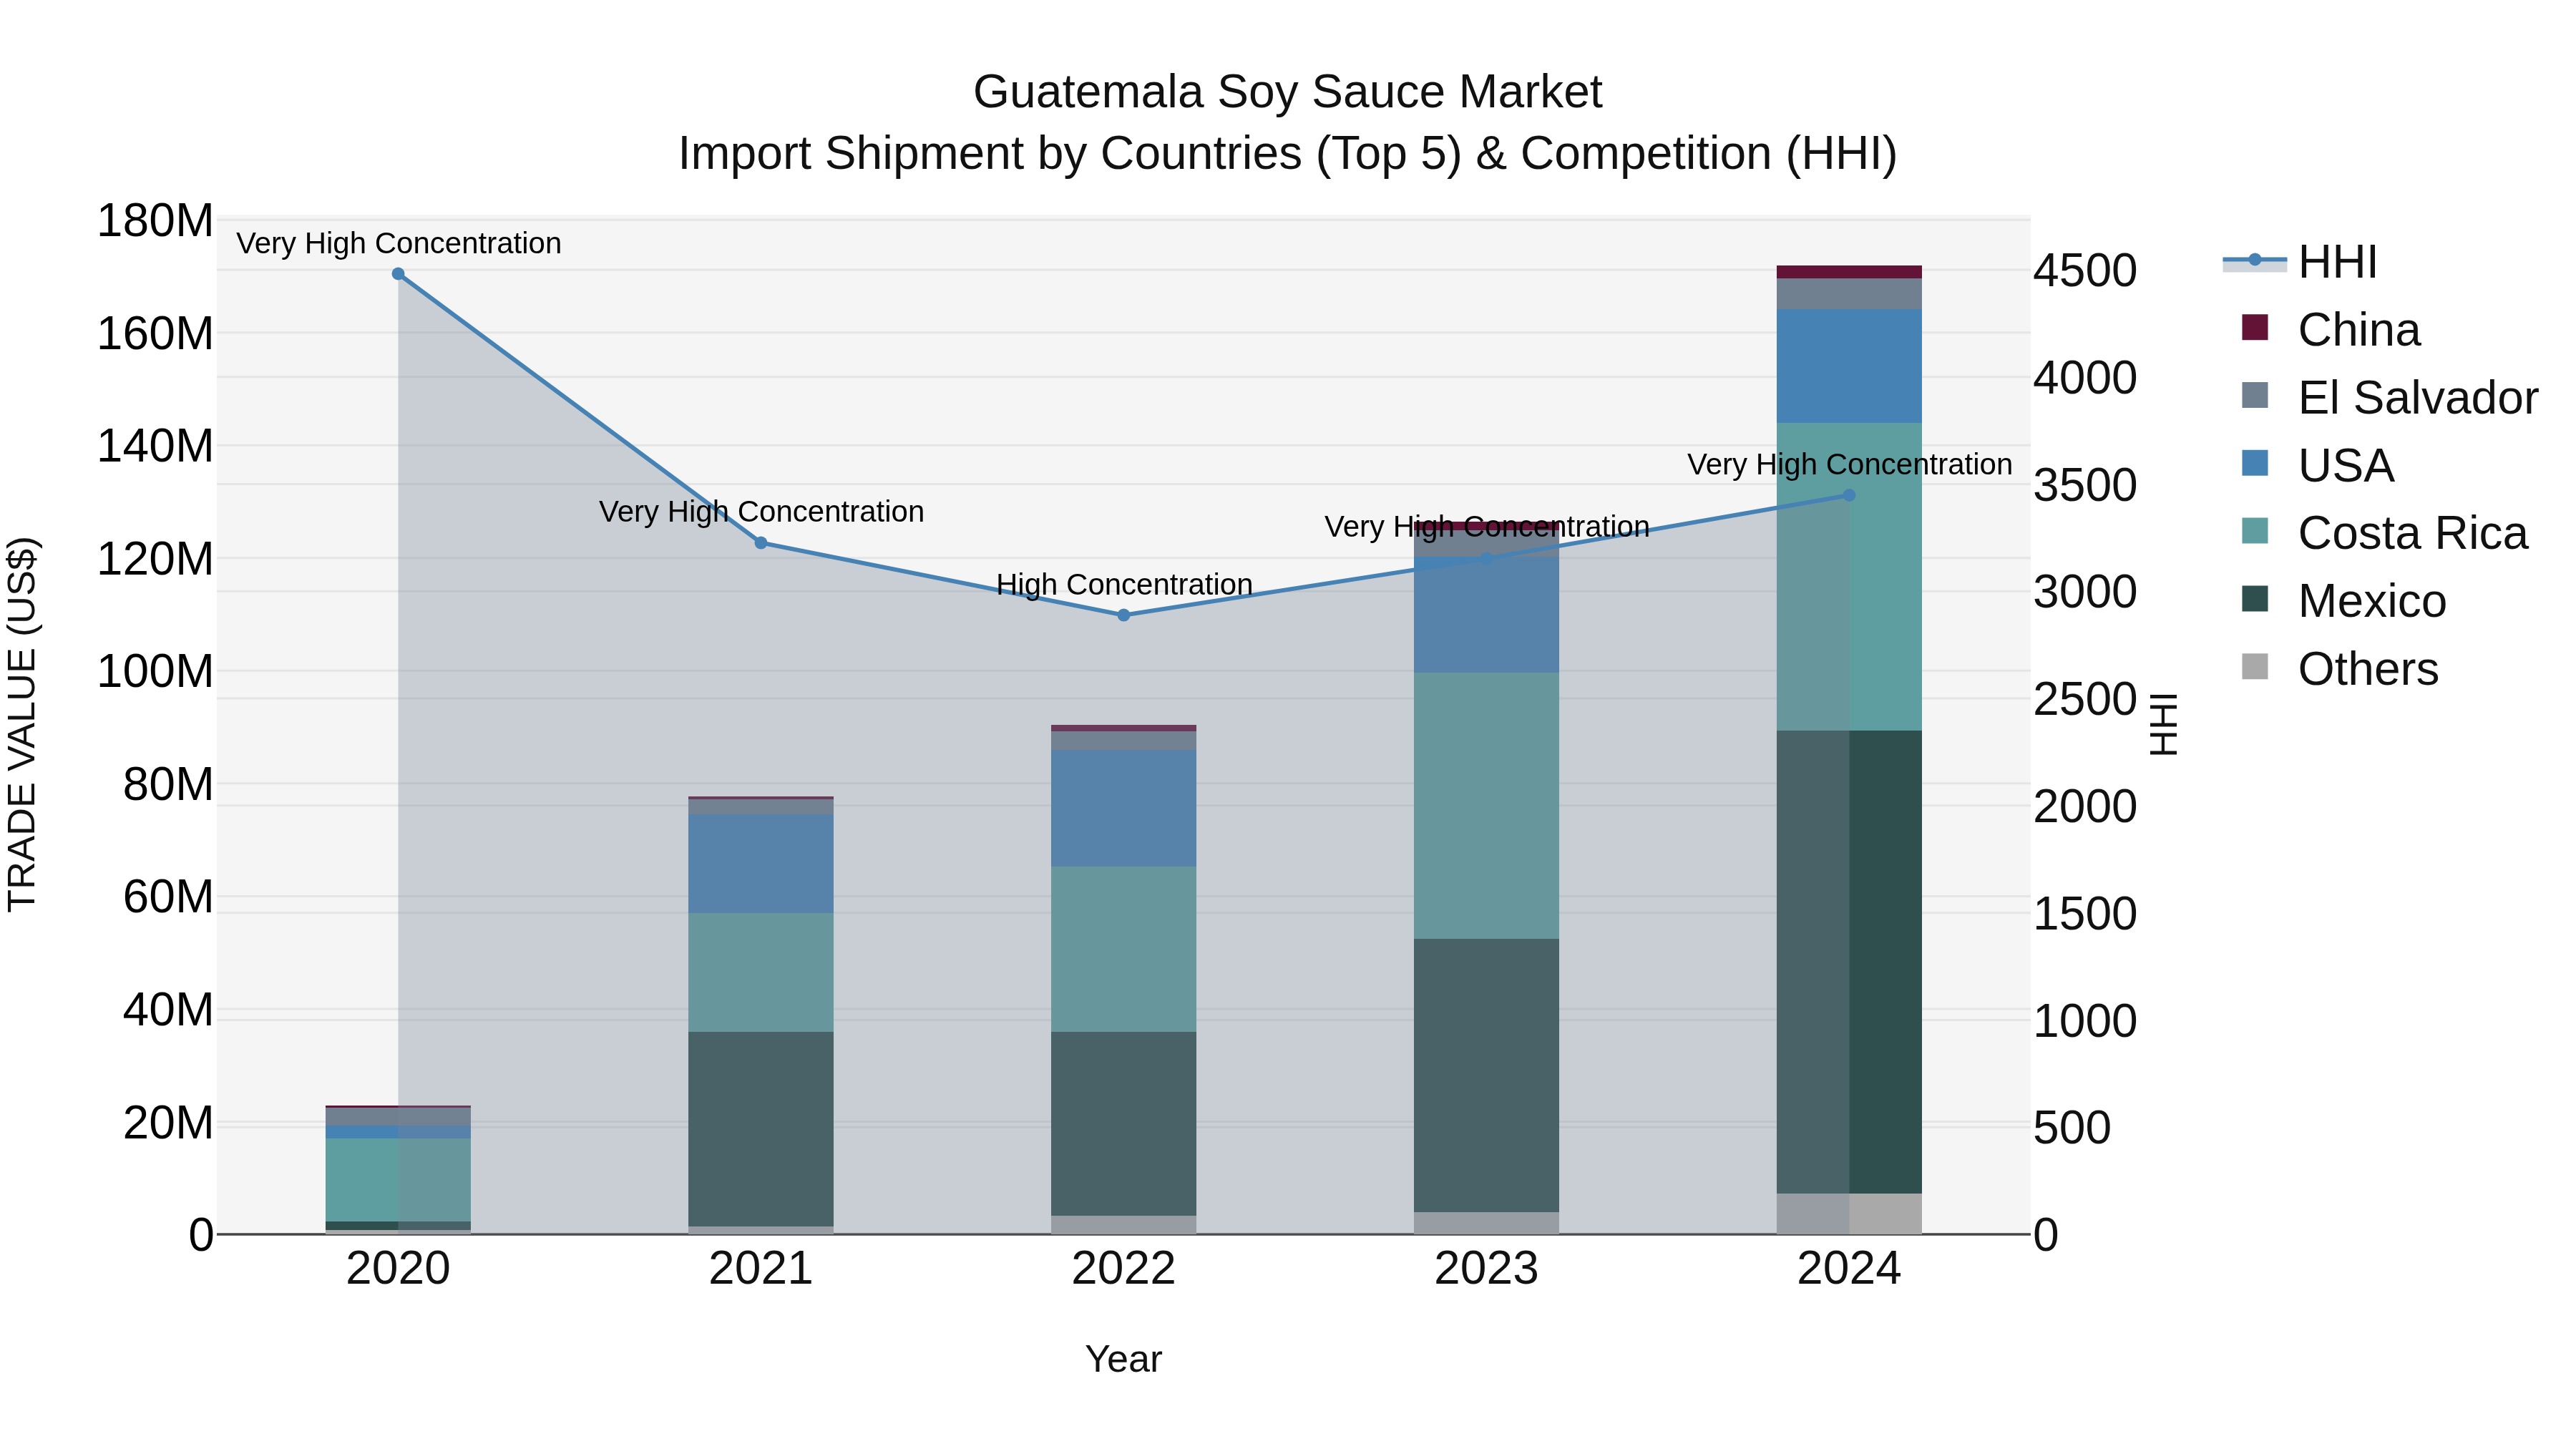
Guatemala Soy Sauce Market Top 5 Importing Countries and Market Competition (HHI) Analysis
Guatemala`s soy sauce import market continues to be dominated by key players such as Mexico, Costa Rica, USA, El Salvador, and China in 2024. The high Herfindahl-Hirschman Index (HHI) indicates a concentrated market structure. The impressive compound annual growth rate (CAGR) of 65.59% from 2020 to 2024 demonstrates a strong demand for soy sauce in Guatemala. Furthermore, the growth rate of 35.97% from 2023 to 2024 suggests a significant uptick in import shipments, highlighting the continued popularity and consumption of soy sauce in the country.
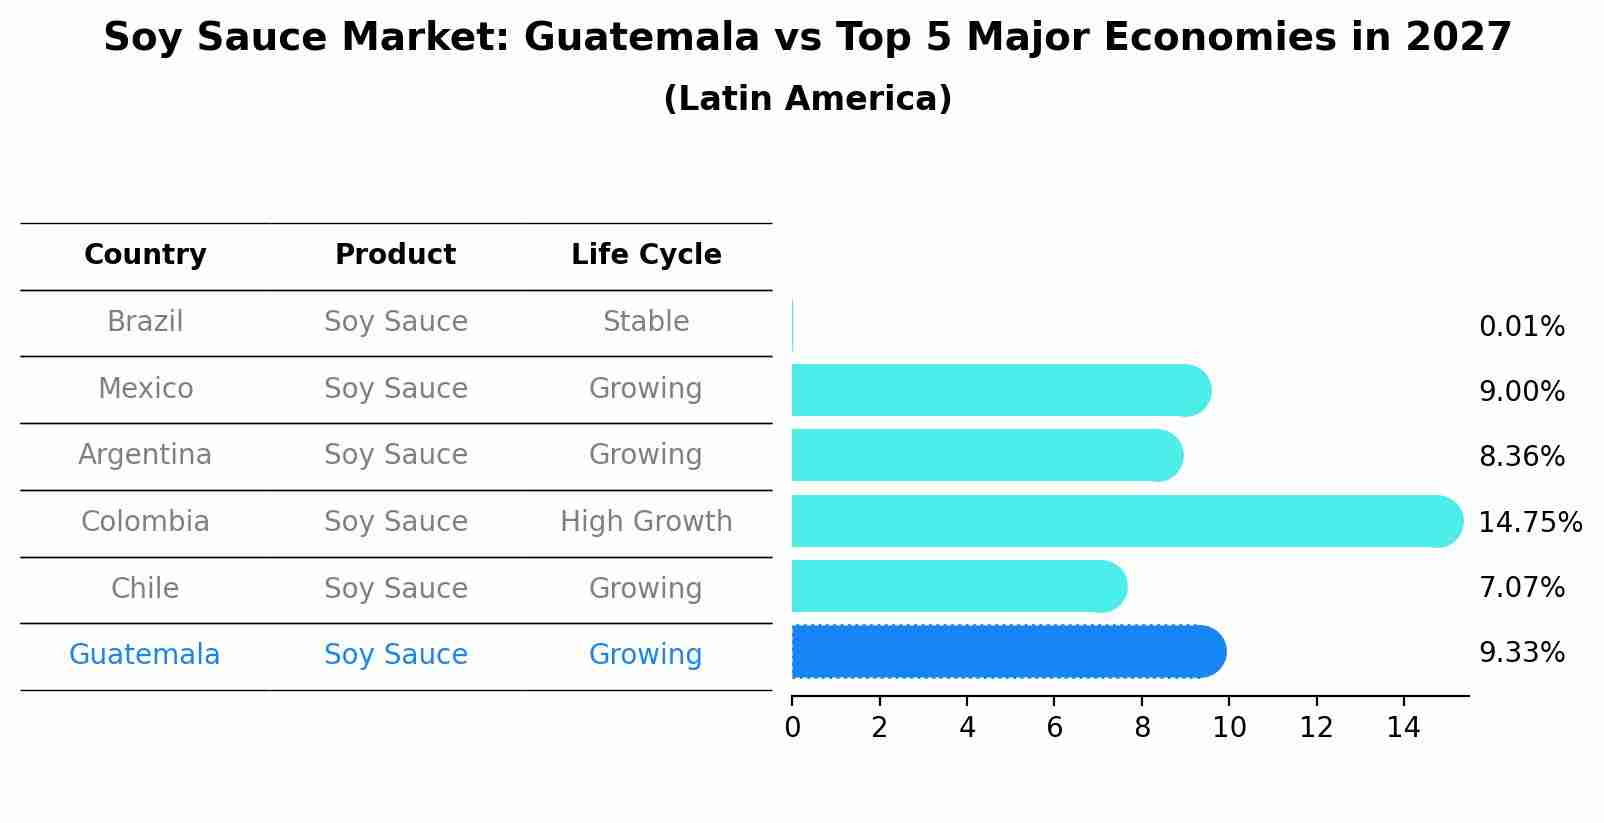
Soy Sauce Market: Guatemala vs Top 5 Major Economies in 2027 (Latin America)
The Soy Sauce market in Guatemala is projected to grow at a growing growth rate of 9.33% by 2027, within the Latin America region led by Brazil, along with other countries like Mexico, Argentina, Colombia and Chile, collectively shaping a dynamic and evolving market environment driven by innovation and increasing adoption of emerging technologies.
Key Highlights of the Report:
- Guatemala Soy Sauce Market Outlook
- Market Size of Guatemala Soy Sauce Market, 2024
- Forecast of Guatemala Soy Sauce Market, 2031
- Historical Data and Forecast of Guatemala Soy Sauce Revenues & Volume for the Period 2021-2031
- Guatemala Soy Sauce Market Trend Evolution
- Guatemala Soy Sauce Market Drivers and Challenges
- Guatemala Soy Sauce Price Trends
- Guatemala Soy Sauce Porter`s Five Forces
- Guatemala Soy Sauce Industry Life Cycle
- Historical Data and Forecast of Guatemala Soy Sauce Market Revenues & Volume By Product Type for the Period 2021-2031
- Historical Data and Forecast of Guatemala Soy Sauce Market Revenues & Volume By Brewed for the Period 2021-2031
- Historical Data and Forecast of Guatemala Soy Sauce Market Revenues & Volume By Blended for the Period 2021-2031
- Historical Data and Forecast of Guatemala Soy Sauce Market Revenues & Volume By Application for the Period 2021-2031
- Historical Data and Forecast of Guatemala Soy Sauce Market Revenues & Volume By Household for the Period 2021-2031
- Historical Data and Forecast of Guatemala Soy Sauce Market Revenues & Volume By Food Industry for the Period 2021-2031
- Guatemala Soy Sauce Import Export Trade Statistics
- Market Opportunity Assessment By Product Type
- Market Opportunity Assessment By Application
- Guatemala Soy Sauce Top Companies Market Share
- Guatemala Soy Sauce Competitive Benchmarking By Technical and Operational Parameters
- Guatemala Soy Sauce Company Profiles
- Guatemala Soy Sauce Key Strategic Recommendations
Frequently Asked Questions About the Market Study (FAQs):
6Wresearch actively monitors the Guatemala Soy Sauce Market and publishes its comprehensive annual report, highlighting emerging trends, growth drivers, revenue analysis, and forecast outlook. Our insights help businesses to make data-backed strategic decisions with ongoing market dynamics. Our analysts track relevent industries related to the Guatemala Soy Sauce Market, allowing our clients with actionable intelligence and reliable forecasts tailored to emerging regional needs.
Yes, we provide customisation as per your requirements. To learn more, feel free to contact us on sales@6wresearch.com
1 Executive Summary |
2 Introduction |
2.1 Key Highlights of the Report |
2.2 Report Description |
2.3 Market Scope & Segmentation |
2.4 Research Methodology |
2.5 Assumptions |
3 Guatemala Soy Sauce Market Overview |
3.1 Guatemala Country Macro Economic Indicators |
3.2 Guatemala Soy Sauce Market Revenues & Volume, 2021 & 2031F |
3.3 Guatemala Soy Sauce Market - Industry Life Cycle |
3.4 Guatemala Soy Sauce Market - Porter's Five Forces |
3.5 Guatemala Soy Sauce Market Revenues & Volume Share, By Product Type, 2021 & 2031F |
3.6 Guatemala Soy Sauce Market Revenues & Volume Share, By Application, 2021 & 2031F |
4 Guatemala Soy Sauce Market Dynamics |
4.1 Impact Analysis |
4.2 Market Drivers |
4.2.1 Increasing health consciousness leading to a shift towards healthier food choices, including soy sauce. |
4.2.2 Growing popularity of Asian cuisine in Guatemala, driving the demand for soy sauce. |
4.2.3 Rising disposable income levels and changing lifestyles influencing consumer preferences towards convenient and flavorful food options. |
4.3 Market Restraints |
4.3.1 Competition from alternative condiments and sauces in the market. |
4.3.2 Price sensitivity among consumers affecting purchasing decisions. |
4.3.3 Limited awareness and penetration of soy sauce in certain regions of Guatemala. |
5 Guatemala Soy Sauce Market Trends |
6 Guatemala Soy Sauce Market Segmentations |
6.1 Guatemala Soy Sauce Market, By Product Type |
6.1.1 Overview and Analysis |
6.1.2 Guatemala Soy Sauce Market Revenues & Volume, By Brewed, 2021-2031F |
6.1.3 Guatemala Soy Sauce Market Revenues & Volume, By Blended, 2021-2031F |
6.2 Guatemala Soy Sauce Market, By Application |
6.2.1 Overview and Analysis |
6.2.2 Guatemala Soy Sauce Market Revenues & Volume, By Household, 2021-2031F |
6.2.3 Guatemala Soy Sauce Market Revenues & Volume, By Food Industry, 2021-2031F |
7 Guatemala Soy Sauce Market Import-Export Trade Statistics |
7.1 Guatemala Soy Sauce Market Export to Major Countries |
7.2 Guatemala Soy Sauce Market Imports from Major Countries |
8 Guatemala Soy Sauce Market Key Performance Indicators |
8.1 Number of new product launches and innovations in the soy sauce market. |
8.2 Consumer engagement and feedback on social media platforms. |
8.3 Growth in the number of restaurants and eateries offering dishes that prominently feature soy sauce. |
8.4 Percentage increase in online searches for soy sauce recipes and usage tips. |
8.5 Participation rates in soy sauce-related cooking workshops or events. |
9 Guatemala Soy Sauce Market - Opportunity Assessment |
9.1 Guatemala Soy Sauce Market Opportunity Assessment, By Product Type, 2021 & 2031F |
9.2 Guatemala Soy Sauce Market Opportunity Assessment, By Application, 2021 & 2031F |
10 Guatemala Soy Sauce Market - Competitive Landscape |
10.1 Guatemala Soy Sauce Market Revenue Share, By Companies, 2024 |
10.2 Guatemala Soy Sauce Market Competitive Benchmarking, By Operating and Technical Parameters |
11 Company Profiles |
12 Recommendations | 13 Disclaimer |
Export potential assessment - trade Analytics for 2030
Export potential enables firms to identify high-growth global markets with greater confidence by combining advanced trade intelligence with a structured quantitative methodology. The framework analyzes emerging demand trends and country-level import patterns while integrating macroeconomic and trade datasets such as GDP and population forecasts, bilateral import–export flows, tariff structures, elasticity differentials between developed and developing economies, geographic distance, and import demand projections. Using weighted trade values from 2020–2024 as the base period to project country-to-country export potential for 2030, these inputs are operationalized through calculated drivers such as gravity model parameters, tariff impact factors, and projected GDP per-capita growth. Through an analysis of hidden potentials, demand hotspots, and market conditions that are most favorable to success, this method enables firms to focus on target countries, maximize returns, and global expansion with data, backed by accuracy.
By factoring in the projected importer demand gap that is currently unmet and could be potential opportunity, it identifies the potential for the Exporter (Country) among 190 countries, against the general trade analysis, which identifies the biggest importer or exporter.
To discover high-growth global markets and optimize your business strategy:
Click Here
Pricing
- Single User License$ 1,995
- Department License$ 2,400
- Site License$ 3,120
- Global License$ 3,795

Search
Thought Leadership and Analyst Meet


Our Clients
Related Reports
- Iraq Insulation and Waterproofing Market (2026-2032) | Outlook, Drivers, Growth, Size, Share, Industry, Revenue, Trends, Demand, Competitive, Strategic Insights, Opportunities, Segments, Companies, Challenges, Strategy, Consumer Insights, Analysis, Investment Trends, Value, Segmentation, Forecast, Restraints
- India Switchgear Market Outlook (2026 - 2032) | Size, Share, Trends, Growth, Revenue, Forecast, Analysis, Value, Outlook
- Pakistan Contraceptive Implants Market (2025-2031) | Demand, Growth, Size, Share, Industry, Pricing Analysis, Competitive, Strategic Insights, Strategy, Consumer Insights, Analysis, Investment Trends, Opportunities, Revenue, Segments, Value, Segmentation, Supply, Forecast, Restraints, Outlook, Competition, Drivers, Trends, Companies, Challenges
- Sri Lanka Packaging Market (2026-2032) | Outlook, Competition, Drivers, Trends, Demand, Pricing Analysis, Competitive, Strategic Insights, Companies, Challenges, Strategy, Consumer Insights, Analysis, Investment Trends, Opportunities, Growth, Size, Share, Industry, Revenue, Segments, Value, Segmentation, Supply, Forecast, Restraints
- India Kids Watches Market (2026-2032) | Strategy, Consumer Insights, Analysis, Investment Trends, Opportunities, Growth, Size, Share, Industry, Revenue, Segments, Value, Segmentation, Supply, Forecast, Restraints, Outlook, Competition, Drivers, Trends, Demand, Pricing Analysis, Competitive, Strategic Insights, Companies, Challenges
- Saudi Arabia Core Assurance Service Market (2025-2031) | Strategy, Consumer Insights, Analysis, Investment Trends, Opportunities, Growth, Size, Share, Industry, Revenue, Segments, Value, Segmentation, Supply, Forecast, Restraints, Outlook, Competition, Drivers, Trends, Demand, Pricing Analysis, Competitive, Strategic Insights, Companies, Challenges
- Romania Uninterruptible Power Supply (UPS) Market (2026-2032) | Industry, Analysis, Revenue, Size, Forecast, Outlook, Value, Trends, Share, Growth & Companies
- Saudi Arabia Car Window Tinting Film, Paint Protection Film (PPF), and Ceramic Coating Market (2025-2031) | Strategy, Consumer Insights, Analysis, Investment Trends, Opportunities, Growth, Size, Share, Industry, Revenue, Segments, Value, Segmentation, Supply, Forecast, Restraints, Outlook, Competition, Drivers, Trends, Demand, Pricing Analysis, Competitive, Strategic Insights, Companies, Challenges
- South Africa Stationery Market (2025-2031) | Share, Size, Industry, Value, Growth, Revenue, Analysis, Trends, Segmentation & Outlook
- Afghanistan Rocking Chairs And Adirondack Chairs Market (2026-2032) | Size & Revenue, Competitive Landscape, Share, Segmentation, Industry, Value, Outlook, Analysis, Trends, Growth, Forecast, Companies
Industry Events and Analyst Meet

India EV Show 2026

EV tech India Expo 2026

Auto Tech Asia 2026

Battery Tech India 2026

Smart Production Solutions Guangzhou 2026
Whitepaper
- Middle East & Africa Commercial Security Market Click here to view more.
- Middle East & Africa Fire Safety Systems & Equipment Market Click here to view more.
- GCC Drone Market Click here to view more.
- Middle East Lighting Fixture Market Click here to view more.
- GCC Physical & Perimeter Security Market Click here to view more.
6WResearch In News
- Doha a strategic location for EV manufacturing hub: IPA Qatar
- Demand for luxury TVs surging in the GCC, says Samsung
- Empowering Growth: The Thriving Journey of Bangladesh’s Cable Industry
- Demand for luxury TVs surging in the GCC, says Samsung
- Video call with a traditional healer? Once unthinkable, it’s now common in South Africa
- Intelligent Buildings To Smooth GCC’s Path To Net Zero