Guatemala Technical Ceramics Market (2026-2032) | Analysis, Forecast, Trends, Share, Companies, Segmentation, Size, Growth, Industry, Value, Revenue & Outlook
Market Forecast By Material Type (Oxide ceramics, Non-oxide ceramics), By Product Type (Monolithic ceramics, Ceramic matrix composites, Ceramic coatings, Others), By End-Use Industry (Electronics & semiconductor, Automotive, Energy & power, Industrial, Medical, Military & defense, Others) And Competitive Landscape
| Product Code: ETC5526969 | Publication Date: Nov 2023 | Updated Date: Apr 2026 | Product Type: Market Research Report | |
| Publisher: 6Wresearch | Author: Ravi Bhandari | No. of Pages: 60 | No. of Figures: 30 | No. of Tables: 5 |
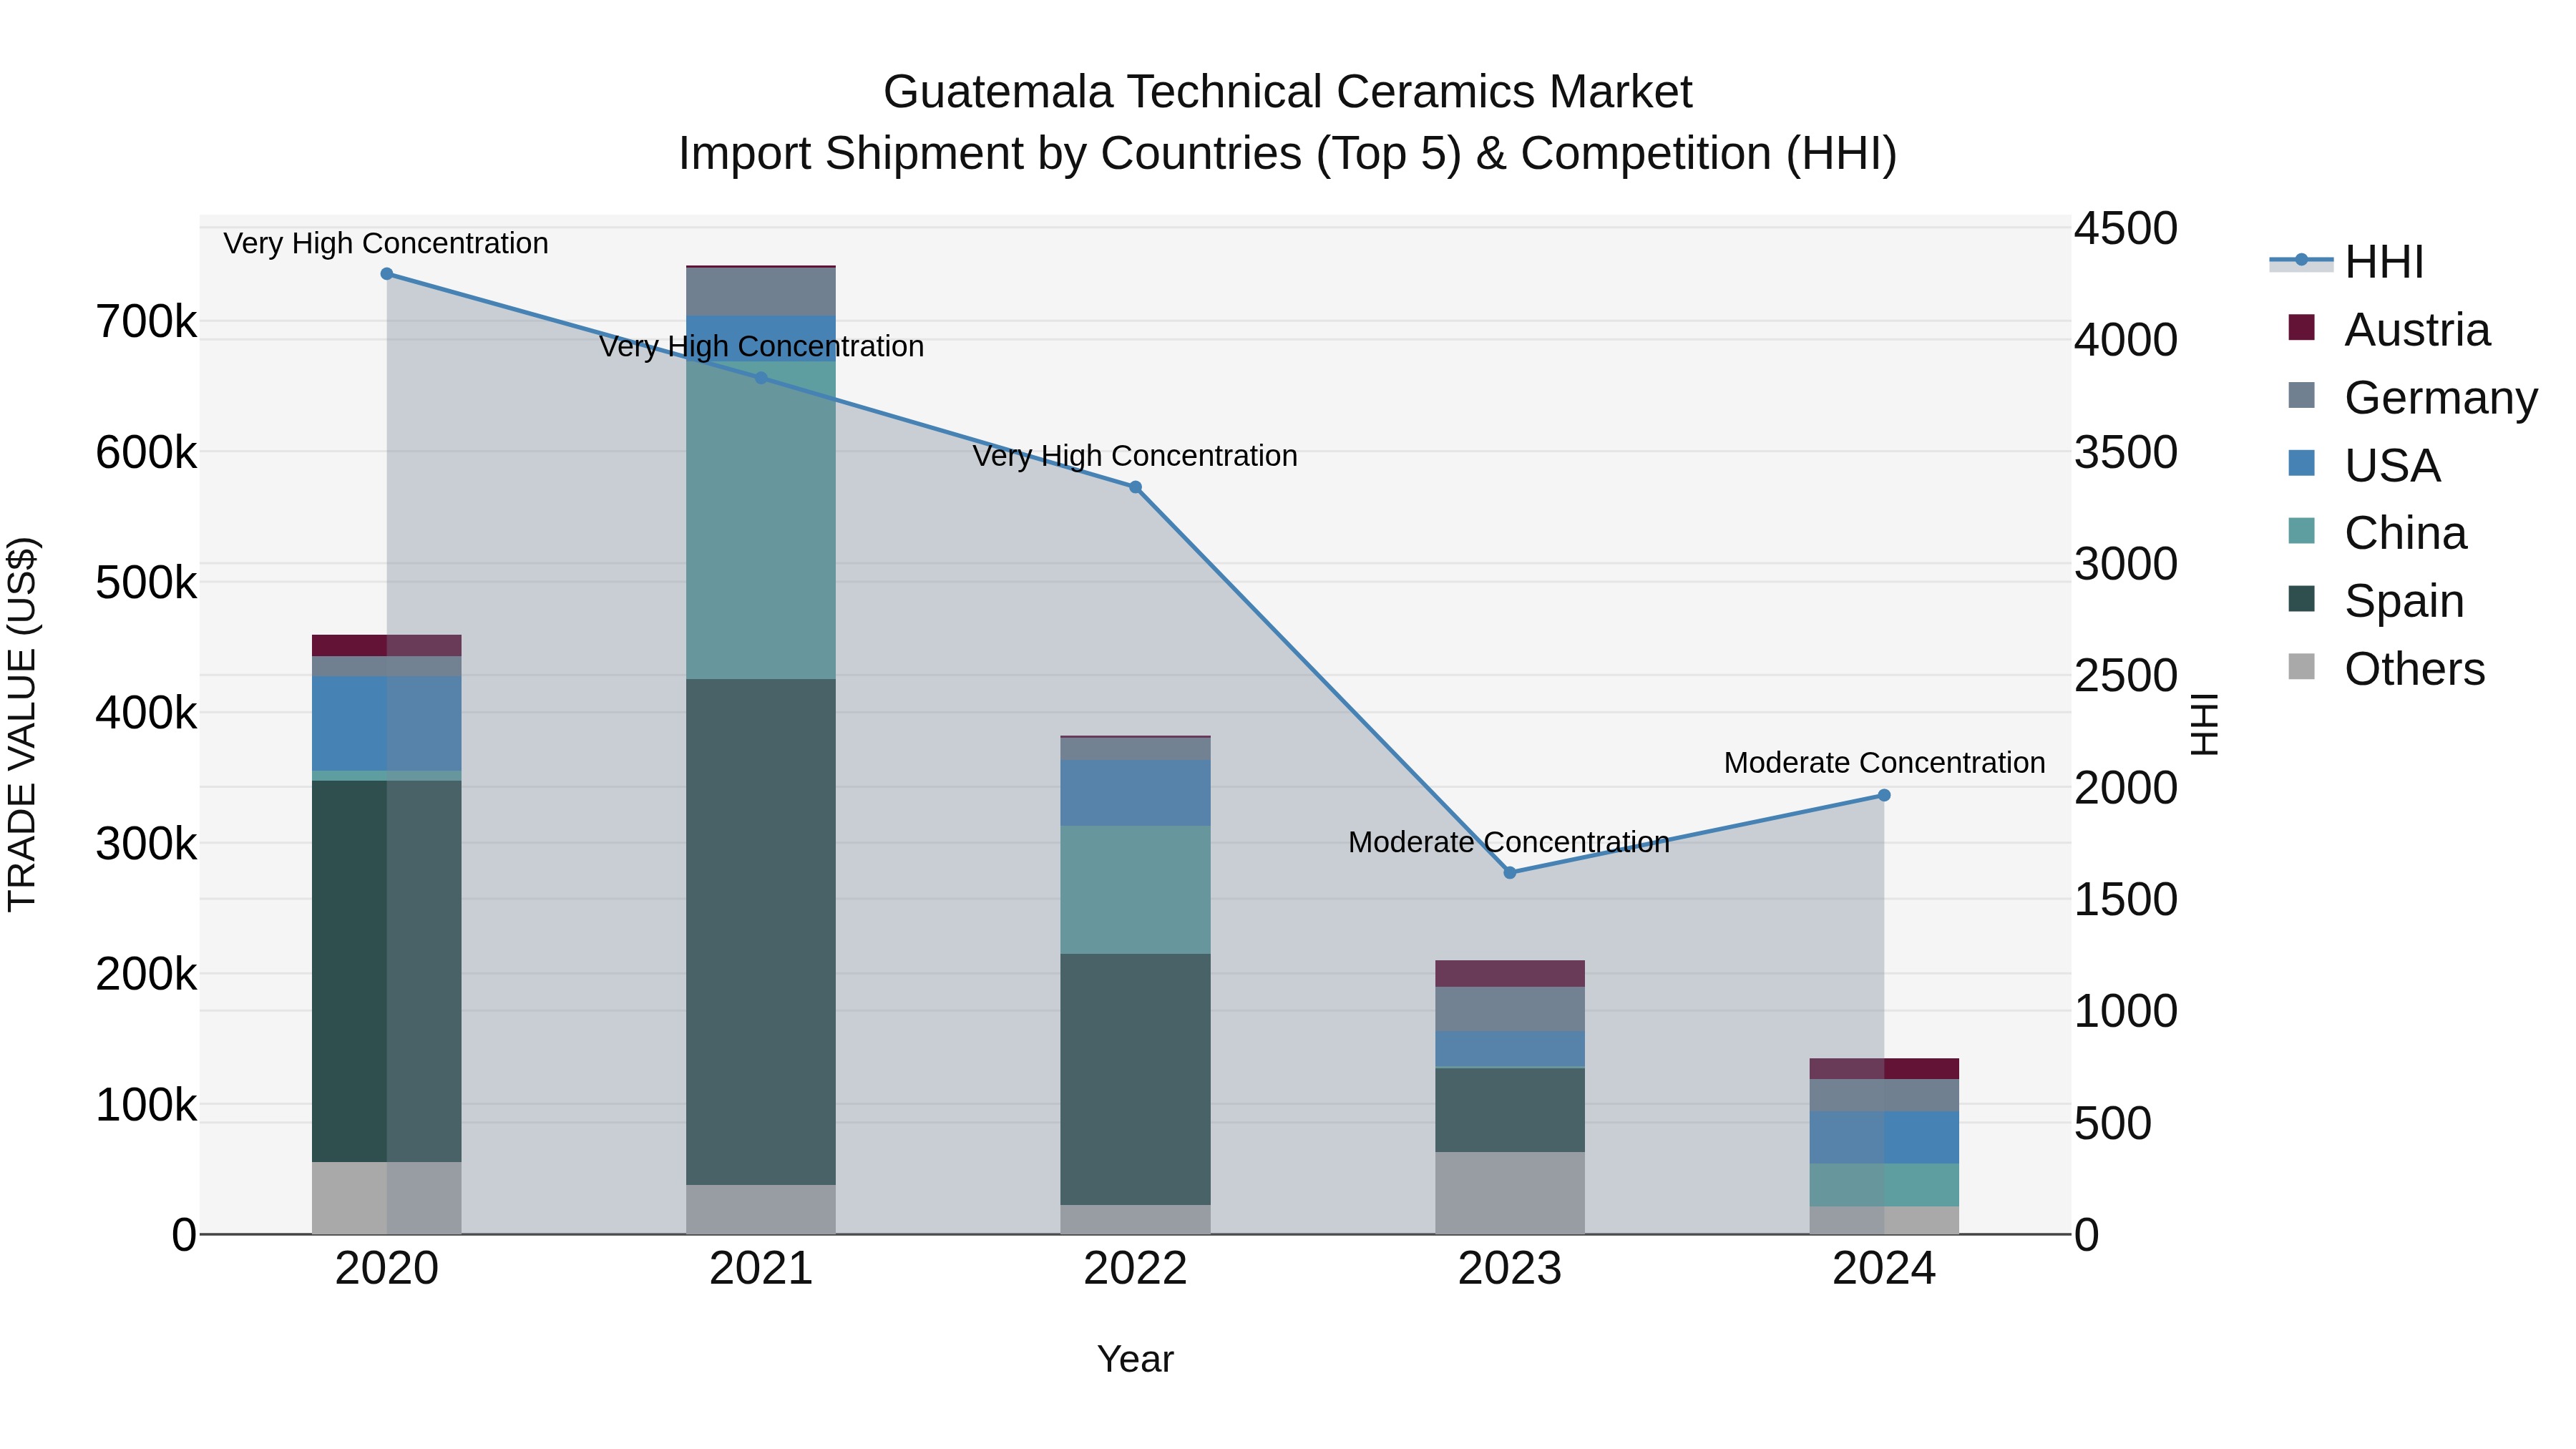
Guatemala Technical Ceramics Market Top 5 Importing Countries and Market Competition (HHI) Analysis
Guatemala`s technical ceramics import market saw a shift towards high concentration in 2024, with the USA, China, Germany, Austria, and Mexico emerging as the top exporters. The industry experienced a significant decline with a CAGR of -26.38% from 2020 to 2024, and a steep growth rate decrease of -35.74% from 2023 to 2024. This trend indicates a challenging market environment, potentially influenced by global economic conditions and shifting trade dynamics. Monitoring supply chain resilience and market diversification strategies will be essential for stakeholders in navigating these challenging times.
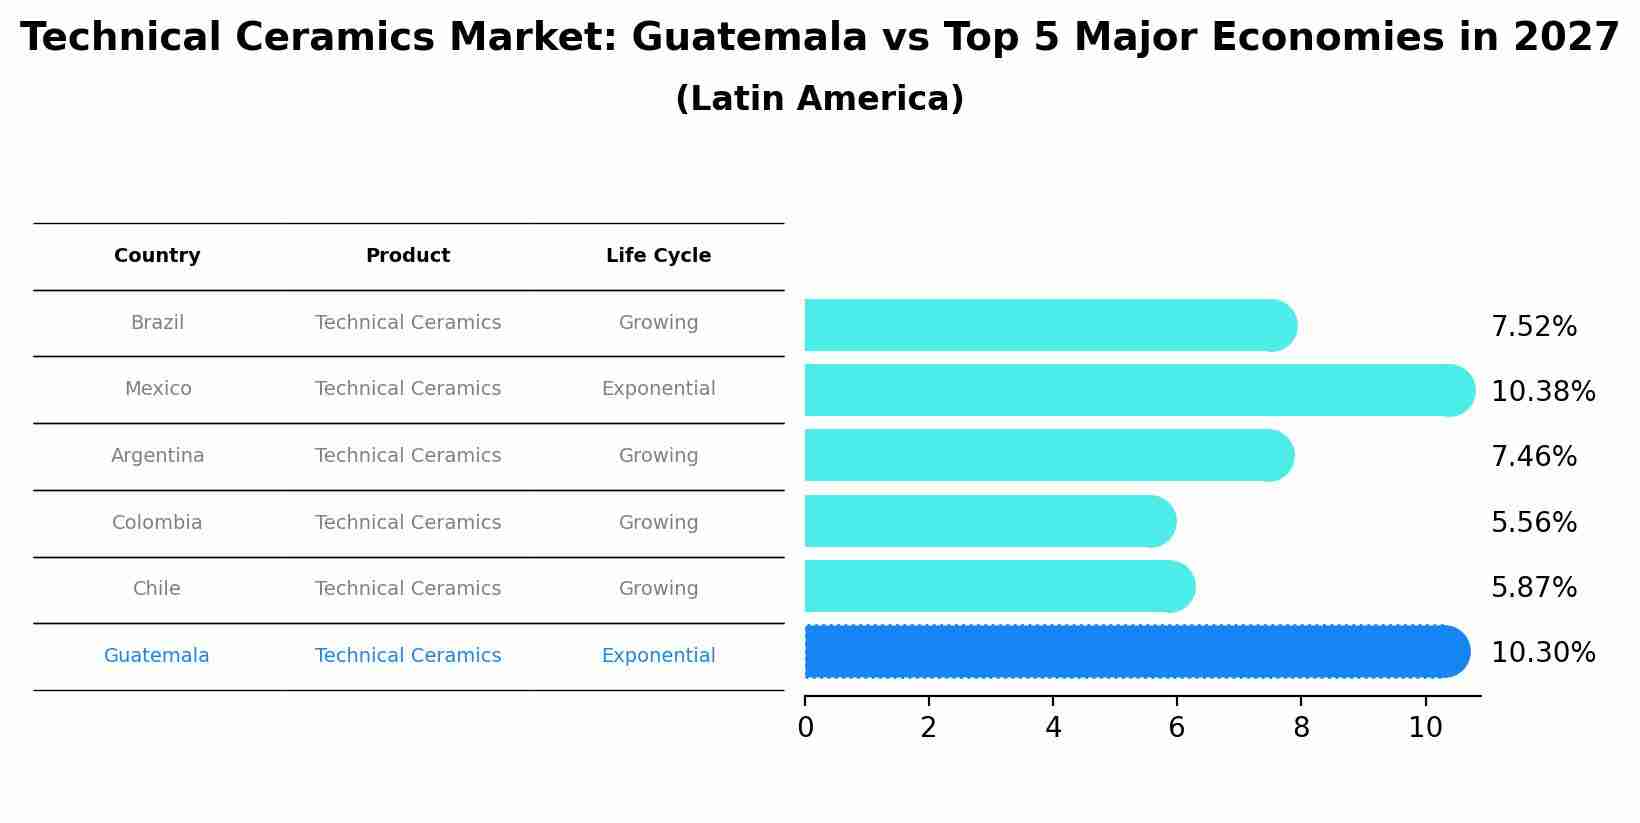
Technical Ceramics Market: Guatemala vs Top 5 Major Economies in 2027 (Latin America)
By 2027, Guatemala's Technical Ceramics market is forecasted to achieve a high growth rate of 10.30%, with Brazil leading the Latin America region, followed by Mexico, Argentina, Colombia and Chile.
Key Highlights of the Report:
- Guatemala Technical Ceramics Market Outlook
- Market Size of Guatemala Technical Ceramics Market, 2025
- Forecast of Guatemala Technical Ceramics Market, 2032
- Historical Data and Forecast of Guatemala Technical Ceramics Revenues & Volume for the Period 2022 - 2032F
- Guatemala Technical Ceramics Market Trend Evolution
- Guatemala Technical Ceramics Market Drivers and Challenges
- Guatemala Technical Ceramics Price Trends
- Guatemala Technical Ceramics Porter`s Five Forces
- Guatemala Technical Ceramics Industry Life Cycle
- Historical Data and Forecast of Guatemala Technical Ceramics Market Revenues & Volume By Material Type for the Period 2022 - 2032F
- Historical Data and Forecast of Guatemala Technical Ceramics Market Revenues & Volume By Oxide ceramics for the Period 2022 - 2032F
- Historical Data and Forecast of Guatemala Technical Ceramics Market Revenues & Volume By Non-oxide ceramics for the Period 2022 - 2032F
- Historical Data and Forecast of Guatemala Technical Ceramics Market Revenues & Volume By Product Type for the Period 2022 - 2032F
- Historical Data and Forecast of Guatemala Technical Ceramics Market Revenues & Volume By Monolithic ceramics for the Period 2022 - 2032F
- Historical Data and Forecast of Guatemala Technical Ceramics Market Revenues & Volume By Ceramic matrix composites for the Period 2022 - 2032F
- Historical Data and Forecast of Guatemala Technical Ceramics Market Revenues & Volume By Ceramic coatings for the Period 2022 - 2032F
- Historical Data and Forecast of Guatemala Technical Ceramics Market Revenues & Volume By Others for the Period 2022 - 2032F
- Historical Data and Forecast of Guatemala Technical Ceramics Market Revenues & Volume By End-Use Industry for the Period 2022 - 2032F
- Historical Data and Forecast of Guatemala Technical Ceramics Market Revenues & Volume By Electronics & semiconductor for the Period 2022 - 2032F
- Historical Data and Forecast of Guatemala Technical Ceramics Market Revenues & Volume By Automotive for the Period 2022 - 2032F
- Historical Data and Forecast of Guatemala Technical Ceramics Market Revenues & Volume By Energy & power for the Period 2022 - 2032F
- Historical Data and Forecast of Guatemala Technical Ceramics Market Revenues & Volume By Industrial for the Period 2022 - 2032F
- Historical Data and Forecast of Guatemala Technical Ceramics Market Revenues & Volume By Medical for the Period 2022 - 2032F
- Historical Data and Forecast of Guatemala Technical Ceramics Market Revenues & Volume By Military & defense for the Period 2022 - 2032F
- Historical Data and Forecast of Guatemala Technical Ceramics Market Revenues & Volume By Others for the Period 2022 - 2032F
- Guatemala Technical Ceramics Import Export Trade Statistics
- Market Opportunity Assessment By Material Type
- Market Opportunity Assessment By Product Type
- Market Opportunity Assessment By End-Use Industry
- Guatemala Technical Ceramics Top Companies Market Share
- Guatemala Technical Ceramics Competitive Benchmarking By Technical and Operational Parameters
- Guatemala Technical Ceramics Company Profiles
- Guatemala Technical Ceramics Key Strategic Recommendations
Frequently Asked Questions About the Market Study (FAQs):
6Wresearch actively monitors the Guatemala Technical Ceramics Market and publishes its comprehensive annual report, highlighting emerging trends, growth drivers, revenue analysis, and forecast outlook. Our insights help businesses to make data-backed strategic decisions with ongoing market dynamics. Our analysts track relevent industries related to the Guatemala Technical Ceramics Market, allowing our clients with actionable intelligence and reliable forecasts tailored to emerging regional needs.
Yes, we provide customisation as per your requirements. To learn more, feel free to contact us on sales@6wresearch.com
1 Executive Summary |
2 Introduction |
2.1 Key Highlights of the Report |
2.2 Report Description |
2.3 Market Scope & Segmentation |
2.4 Research Methodology |
2.5 Assumptions |
3 Guatemala Technical Ceramics Market Overview |
3.1 Guatemala Country Macro Economic Indicators |
3.2 Guatemala Technical Ceramics Market Revenues & Volume, 2022 & 2032F |
3.3 Guatemala Technical Ceramics Market - Industry Life Cycle |
3.4 Guatemala Technical Ceramics Market - Porter's Five Forces |
3.5 Guatemala Technical Ceramics Market Revenues & Volume Share, By Material Type, 2022 & 2032F |
3.6 Guatemala Technical Ceramics Market Revenues & Volume Share, By Product Type, 2022 & 2032F |
3.7 Guatemala Technical Ceramics Market Revenues & Volume Share, By End-Use Industry, 2022 & 2032F |
4 Guatemala Technical Ceramics Market Dynamics |
4.1 Impact Analysis |
4.2 Market Drivers |
4.2.1 Increasing demand for technical ceramics in various industries such as electronics, automotive, and healthcare. |
4.2.2 Growing investments in research and development activities to enhance ceramic material properties and applications. |
4.2.3 Rising focus on energy efficiency and sustainability driving the adoption of technical ceramics in Guatemala. |
4.3 Market Restraints |
4.3.1 High initial investment costs associated with technical ceramics manufacturing and processing. |
4.3.2 Limited availability of skilled labor for technical ceramics production and customization. |
4.3.3 Fluctuating raw material prices impacting the production cost and pricing of technical ceramics in Guatemala. |
5 Guatemala Technical Ceramics Market Trends |
6 Guatemala Technical Ceramics Market Segmentations |
6.1 Guatemala Technical Ceramics Market, By Material Type |
6.1.1 Overview and Analysis |
6.1.2 Guatemala Technical Ceramics Market Revenues & Volume, By Oxide ceramics, 2022 - 2032F |
6.1.3 Guatemala Technical Ceramics Market Revenues & Volume, By Non-oxide ceramics, 2022 - 2032F |
6.2 Guatemala Technical Ceramics Market, By Product Type |
6.2.1 Overview and Analysis |
6.2.2 Guatemala Technical Ceramics Market Revenues & Volume, By Monolithic ceramics, 2022 - 2032F |
6.2.3 Guatemala Technical Ceramics Market Revenues & Volume, By Ceramic matrix composites, 2022 - 2032F |
6.2.4 Guatemala Technical Ceramics Market Revenues & Volume, By Ceramic coatings, 2022 - 2032F |
6.2.5 Guatemala Technical Ceramics Market Revenues & Volume, By Others, 2022 - 2032F |
6.3 Guatemala Technical Ceramics Market, By End-Use Industry |
6.3.1 Overview and Analysis |
6.3.2 Guatemala Technical Ceramics Market Revenues & Volume, By Electronics & semiconductor, 2022 - 2032F |
6.3.3 Guatemala Technical Ceramics Market Revenues & Volume, By Automotive, 2022 - 2032F |
6.3.4 Guatemala Technical Ceramics Market Revenues & Volume, By Energy & power, 2022 - 2032F |
6.3.5 Guatemala Technical Ceramics Market Revenues & Volume, By Industrial, 2022 - 2032F |
6.3.6 Guatemala Technical Ceramics Market Revenues & Volume, By Medical, 2022 - 2032F |
6.3.7 Guatemala Technical Ceramics Market Revenues & Volume, By Military & defense, 2022 - 2032F |
7 Guatemala Technical Ceramics Market Import-Export Trade Statistics |
7.1 Guatemala Technical Ceramics Market Export to Major Countries |
7.2 Guatemala Technical Ceramics Market Imports from Major Countries |
8 Guatemala Technical Ceramics Market Key Performance Indicators |
8.1 Percentage of revenue generated from new product innovations in technical ceramics. |
8.2 Rate of adoption of technical ceramics in emerging industries in Guatemala. |
8.3 Number of partnerships and collaborations with research institutions and industry players for technical ceramics development. |
8.4 Energy efficiency improvements achieved through the use of technical ceramics in manufacturing processes. |
8.5 Percentage of waste reduction through the recycling and reusability of technical ceramics materials. |
9 Guatemala Technical Ceramics Market - Opportunity Assessment |
9.1 Guatemala Technical Ceramics Market Opportunity Assessment, By Material Type, 2022 & 2032F |
9.2 Guatemala Technical Ceramics Market Opportunity Assessment, By Product Type, 2022 & 2032F |
9.3 Guatemala Technical Ceramics Market Opportunity Assessment, By End-Use Industry, 2022 & 2032F |
10 Guatemala Technical Ceramics Market - Competitive Landscape |
10.1 Guatemala Technical Ceramics Market Revenue Share, By Companies, 2025 |
10.2 Guatemala Technical Ceramics Market Competitive Benchmarking, By Operating and Technical Parameters |
11 Company Profiles |
12 Recommendations | 13 Disclaimer |
Export potential assessment - trade Analytics for 2030
Export potential enables firms to identify high-growth global markets with greater confidence by combining advanced trade intelligence with a structured quantitative methodology. The framework analyzes emerging demand trends and country-level import patterns while integrating macroeconomic and trade datasets such as GDP and population forecasts, bilateral import–export flows, tariff structures, elasticity differentials between developed and developing economies, geographic distance, and import demand projections. Using weighted trade values from 2020–2024 as the base period to project country-to-country export potential for 2030, these inputs are operationalized through calculated drivers such as gravity model parameters, tariff impact factors, and projected GDP per-capita growth. Through an analysis of hidden potentials, demand hotspots, and market conditions that are most favorable to success, this method enables firms to focus on target countries, maximize returns, and global expansion with data, backed by accuracy.
By factoring in the projected importer demand gap that is currently unmet and could be potential opportunity, it identifies the potential for the Exporter (Country) among 190 countries, against the general trade analysis, which identifies the biggest importer or exporter.
To discover high-growth global markets and optimize your business strategy:
Click Here
Pricing
- Single User License$ 1,995
- Department License$ 2,400
- Site License$ 3,120
- Global License$ 3,795

Search
Thought Leadership and Analyst Meet


Our Clients
Latest Reports
- Philippines Polyhydroxybutyrate-co-Hydroxyvalerate Market (2026-2032) | Trends, Insights, Challenges, Restraints, Competition, Size, Value, Forecast, Pricing, Share, Outlook, Revenue, Investment Opportunities, Strategy, Drivers, Demand, Growth, segmentation, Analysis, Companies
- Peru Polyhydroxybutyrate-co-Hydroxyvalerate Market (2026-2032) | Growth, Demand, Challenges, Share, Trends, Analysis, Pricing, Investment Opportunities, Drivers, Value, Forecast, Competition, Size, Companies, Insights, Outlook, Restraints, segmentation, Revenue, Strategy
- Pakistan Polyhydroxybutyrate-co-Hydroxyvalerate Market (2026-2032) | Restraints, segmentation, Pricing, Forecast, Share, Strategy, Competition, Trends, Insights, Drivers, Challenges, Growth, Revenue, Outlook, Value, Investment Opportunities, Companies, Size, Analysis, Demand
- Oman Polyhydroxybutyrate-co-Hydroxyvalerate Market (2026-2032) | Drivers, segmentation, Insights, Competition, Pricing, Outlook, Size, Revenue, Challenges, Forecast, Analysis, Growth, Value, Share, Trends, Investment Opportunities, Strategy, Restraints, Companies, Demand
- Nigeria Polyhydroxybutyrate-co-Hydroxyvalerate Market (2026-2032) | Value, Investment Opportunities, Analysis, Revenue, Restraints, Pricing, Outlook, Competition, Demand, Growth, Forecast, Companies, Trends, Challenges, segmentation, Drivers, Insights, Share, Size, Strategy
- Nepal Polyhydroxybutyrate-co-Hydroxyvalerate Market (2026-2032) | Insights, Analysis, Drivers, Share, Revenue, Demand, segmentation, Investment Opportunities, Competition, Forecast, Growth, Pricing, Companies, Strategy, Trends, Restraints, Challenges, Outlook, Size, Value
- Myanmar Polyhydroxybutyrate-co-Hydroxyvalerate Market (2026-2032) | Outlook, Revenue, Strategy, Restraints, Drivers, segmentation, Share, Forecast, Competition, Insights, Growth, Pricing, Size, Demand, Value, Companies, Trends, Challenges, Investment Opportunities, Analysis
- Morocco Polyhydroxybutyrate-co-Hydroxyvalerate Market (2026-2032) | Outlook, Investment Opportunities, Restraints, Strategy, Forecast, Challenges, Drivers, Growth, Companies, segmentation, Trends, Size, Competition, Revenue, Demand, Insights, Share, Analysis, Value, Pricing
- Mexico Polyhydroxybutyrate-co-Hydroxyvalerate Market (2026-2032) | Size, Drivers, Outlook, Share, Strategy, Growth, Pricing, Challenges, Companies, Demand, Value, Investment Opportunities, Restraints, Trends, Forecast, segmentation, Analysis, Insights, Competition, Revenue
- Malaysia Polyhydroxybutyrate-co-Hydroxyvalerate Market (2026-2032) | Share, segmentation, Size, Companies, Analysis, Insights, Forecast, Value, Revenue, Drivers, Restraints, Challenges, Investment Opportunities, Trends, Competition, Strategy, Demand, Growth, Outlook, Pricing
Industry Events and Analyst Meet

HIMTEX 2026

India Refining Summit 2026

India EV Show 2026

EV tech India Expo 2026

Auto Tech Asia 2026
Whitepaper
- Middle East & Africa Commercial Security Market Click here to view more.
- Middle East & Africa Fire Safety Systems & Equipment Market Click here to view more.
- GCC Drone Market Click here to view more.
- Middle East Lighting Fixture Market Click here to view more.
- GCC Physical & Perimeter Security Market Click here to view more.
6WResearch In News
- Doha a strategic location for EV manufacturing hub: IPA Qatar
- Demand for luxury TVs surging in the GCC, says Samsung
- Empowering Growth: The Thriving Journey of Bangladesh’s Cable Industry
- Demand for luxury TVs surging in the GCC, says Samsung
- Video call with a traditional healer? Once unthinkable, it’s now common in South Africa
- Intelligent Buildings To Smooth GCC’s Path To Net Zero