Guyana LNG Bunkering Market (2025-2031) | Companies, Outlook, Industry, Revenue, Size, Share, Analysis, Value, Segmentation, Growth, Forecast & Trends
Market Forecast By Product Type (Truck-to-Ship, Port-to-Ship, Ship-to-Ship, Portable Tanks), By Application (Container Fleet, Tanker Fleet, Cargo Fleet, Ferries, Inland Vessels, Others) And Competitive Landscape
| Product Code: ETC4823818 | Publication Date: Nov 2023 | Updated Date: Nov 2025 | Product Type: Market Research Report | |
| Publisher: 6Wresearch | Author: Sachin Kumar Rai | No. of Pages: 60 | No. of Figures: 30 | No. of Tables: 5 |
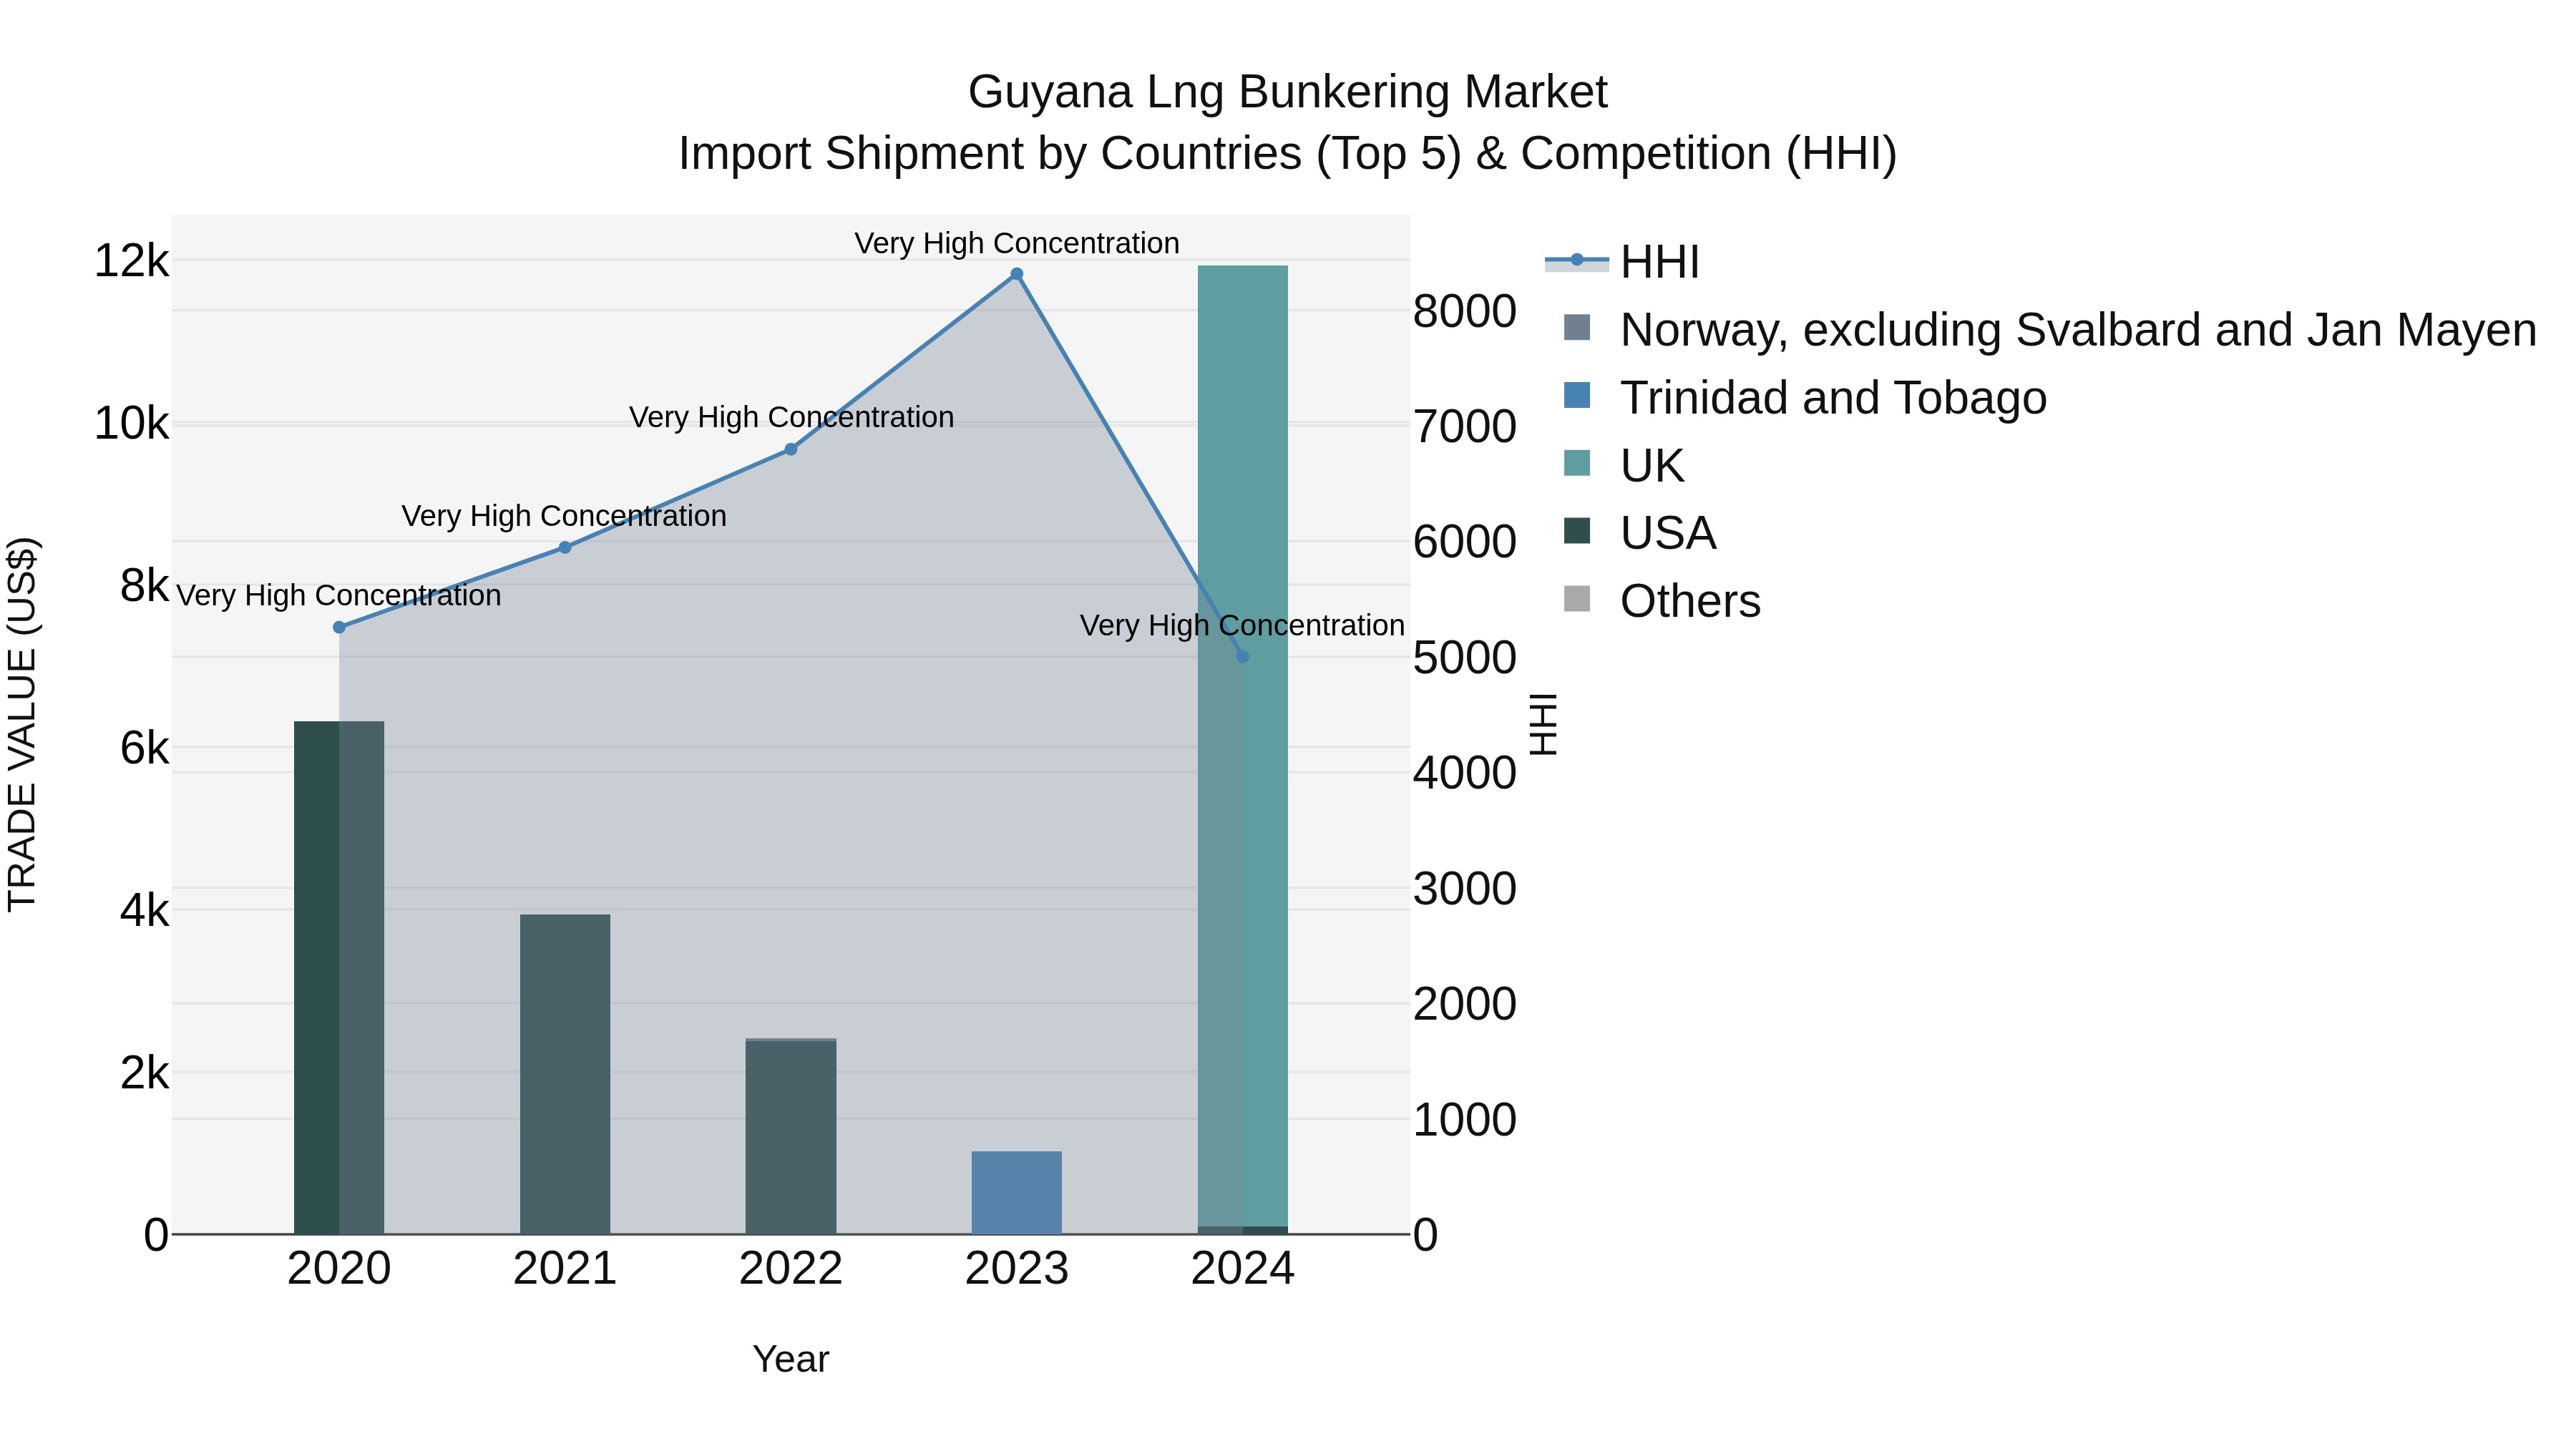
Guyana Lng Bunkering Market Top 5 Importing Countries and Market Competition (HHI) Analysis
The Guyana LNG bunkering import market saw a significant surge in 2024, with top exporting countries including the UK, USA, Trinidad and Tobago, and Norway. The high Herfindahl-Hirschman Index (HHI) concentration indicates a competitive market landscape. The impressive Compound Annual Growth Rate (CAGR) of 17.23% from 2020 to 2024 underscores the sector`s rapid expansion. Moreover, the exceptional growth rate of 1064.92% from 2023 to 2024 signals a remarkable uptrend in import shipments, portraying a promising outlook for the Guyana LNG bunkering industry.
Guyana LNG Bunkering Market Overview
The LNG bunkering market in Guyana supports the maritime industry`s shift toward cleaner fuels. The use of liquefied natural gas as a marine fuel is gaining traction due to its lower emissions and cost efficiency.
Drivers of the market
The LNG bunkering market in Guyana is being driven by the growing global demand for clean and sustainable energy sources in the shipping industry. Liquefied natural gas (LNG) is increasingly used as an alternative to traditional marine fuels due to its lower carbon emissions and environmental impact. As Guyana continues to develop its energy infrastructure and seeks to align with global sustainability goals, the demand for LNG bunkering services is rising. Additionally, the countrys strategic location as a maritime hub and the increasing adoption of LNG-powered vessels contribute to the growth of the LNG bunkering market in Guyana.
Challenges of the market
The LNG bunkering market faces hurdles such as the high initial investment required for infrastructure development and limited availability of LNG supply chains. Regulatory challenges and competition from traditional marine fuels also impact growth.
Government Policy of the market
As part of its focus on clean energy solutions, the government has encouraged the development of LNG bunkering facilities. Policies include investment in port infrastructure, tax exemptions for companies adopting LNG technologies, and incentives for vessels converting to LNG propulsion systems to reduce emissions.
Key Highlights of the Report:
- Guyana LNG Bunkering Market Outlook
- Market Size of Guyana LNG Bunkering Market, 2024
- Forecast of Guyana LNG Bunkering Market, 2031
- Historical Data and Forecast of Guyana LNG Bunkering Revenues & Volume for the Period 2021-2031
- Guyana LNG Bunkering Market Trend Evolution
- Guyana LNG Bunkering Market Drivers and Challenges
- Guyana LNG Bunkering Price Trends
- Guyana LNG Bunkering Porter`s Five Forces
- Guyana LNG Bunkering Industry Life Cycle
- Historical Data and Forecast of Guyana LNG Bunkering Market Revenues & Volume By Product Type for the Period 2021-2031
- Historical Data and Forecast of Guyana LNG Bunkering Market Revenues & Volume By Truck-to-Ship for the Period 2021-2031
- Historical Data and Forecast of Guyana LNG Bunkering Market Revenues & Volume By Port-to-Ship for the Period 2021-2031
- Historical Data and Forecast of Guyana LNG Bunkering Market Revenues & Volume By Ship-to-Ship for the Period 2021-2031
- Historical Data and Forecast of Guyana LNG Bunkering Market Revenues & Volume By Portable Tanks for the Period 2021-2031
- Historical Data and Forecast of Guyana LNG Bunkering Market Revenues & Volume By Application for the Period 2021-2031
- Historical Data and Forecast of Guyana LNG Bunkering Market Revenues & Volume By Container Fleet for the Period 2021-2031
- Historical Data and Forecast of Guyana LNG Bunkering Market Revenues & Volume By Tanker Fleet for the Period 2021-2031
- Historical Data and Forecast of Guyana LNG Bunkering Market Revenues & Volume By Cargo Fleet for the Period 2021-2031
- Historical Data and Forecast of Guyana LNG Bunkering Market Revenues & Volume By Ferries for the Period 2021-2031
- Historical Data and Forecast of Guyana LNG Bunkering Market Revenues & Volume By Inland Vessels for the Period 2021-2031
- Historical Data and Forecast of Guyana LNG Bunkering Market Revenues & Volume By Others for the Period 2021-2031
- Guyana LNG Bunkering Import Export Trade Statistics
- Market Opportunity Assessment By Product Type
- Market Opportunity Assessment By Application
- Guyana LNG Bunkering Top Companies Market Share
- Guyana LNG Bunkering Competitive Benchmarking By Technical and Operational Parameters
- Guyana LNG Bunkering Company Profiles
- Guyana LNG Bunkering Key Strategic Recommendations
Frequently Asked Questions About the Market Study (FAQs):
6Wresearch actively monitors the Guyana LNG Bunkering Market and publishes its comprehensive annual report, highlighting emerging trends, growth drivers, revenue analysis, and forecast outlook. Our insights help businesses to make data-backed strategic decisions with ongoing market dynamics. Our analysts track relevent industries related to the Guyana LNG Bunkering Market, allowing our clients with actionable intelligence and reliable forecasts tailored to emerging regional needs.
Yes, we provide customisation as per your requirements. To learn more, feel free to contact us on sales@6wresearch.com
1 Executive Summary |
2 Introduction |
2.1 Key Highlights of the Report |
2.2 Report Description |
2.3 Market Scope & Segmentation |
2.4 Research Methodology |
2.5 Assumptions |
3 Guyana LNG Bunkering Market Overview |
3.1 Guyana Country Macro Economic Indicators |
3.2 Guyana LNG Bunkering Market Revenues & Volume, 2021 & 2031F |
3.3 Guyana LNG Bunkering Market - Industry Life Cycle |
3.4 Guyana LNG Bunkering Market - Porter's Five Forces |
3.5 Guyana LNG Bunkering Market Revenues & Volume Share, By Product Type, 2021 & 2031F |
3.6 Guyana LNG Bunkering Market Revenues & Volume Share, By Application, 2021 & 2031F |
4 Guyana LNG Bunkering Market Dynamics |
4.1 Impact Analysis |
4.2 Market Drivers |
4.2.1 Increasing demand for cleaner fuel alternatives in the maritime industry |
4.2.2 Guyana's strategic location for bunkering operations, providing cost-effective solutions for shipping companies |
4.2.3 Government support and investments in the development of LNG infrastructure |
4.3 Market Restraints |
4.3.1 High initial investment costs associated with LNG bunkering infrastructure |
4.3.2 Lack of widespread awareness and adoption of LNG bunkering among shipping companies |
4.3.3 Regulatory challenges and uncertainties related to LNG bunkering operations |
5 Guyana LNG Bunkering Market Trends |
6 Guyana LNG Bunkering Market Segmentations |
6.1 Guyana LNG Bunkering Market, By Product Type |
6.1.1 Overview and Analysis |
6.1.2 Guyana LNG Bunkering Market Revenues & Volume, By Truck-to-Ship, 2021-2031F |
6.1.3 Guyana LNG Bunkering Market Revenues & Volume, By Port-to-Ship, 2021-2031F |
6.1.4 Guyana LNG Bunkering Market Revenues & Volume, By Ship-to-Ship, 2021-2031F | 6.1.6 Guyana LNG Bunkering Market Revenues & Volume, By Portable Tanks, 2021-2031F |
6.2 Guyana LNG Bunkering Market, By Application |
6.2.1 Overview and Analysis |
6.2.2 Guyana LNG Bunkering Market Revenues & Volume, By Container Fleet, 2021-2031F |
6.2.3 Guyana LNG Bunkering Market Revenues & Volume, By Tanker Fleet, 2021-2031F |
6.2.4 Guyana LNG Bunkering Market Revenues & Volume, By Cargo Fleet, 2021-2031F |
6.2.5 Guyana LNG Bunkering Market Revenues & Volume, By Ferries, 2021-2031F |
6.2.6 Guyana LNG Bunkering Market Revenues & Volume, By Inland Vessels, 2021-2031F |
6.2.7 Guyana LNG Bunkering Market Revenues & Volume, By Others, 2021-2031F |
7 Guyana LNG Bunkering Market Import-Export Trade Statistics |
7.1 Guyana LNG Bunkering Market Export to Major Countries |
7.2 Guyana LNG Bunkering Market Imports from Major Countries |
8 Guyana LNG Bunkering Market Key Performance Indicators |
8.1 Number of new LNG bunkering infrastructure projects initiated in Guyana |
8.2 Percentage increase in LNG bunkering vessels visiting Guyana ports |
8.3 Growth in the number of LNG bunkering agreements signed with shipping companies |
8.4 Reduction in emissions from ships using LNG as fuel |
8.5 Increase in the percentage of LNG bunkered fuel compared to traditional marine fuels |
9 Guyana LNG Bunkering Market - Opportunity Assessment |
9.1 Guyana LNG Bunkering Market Opportunity Assessment, By Product Type, 2021 & 2031F |
9.2 Guyana LNG Bunkering Market Opportunity Assessment, By Application, 2021 & 2031F |
10 Guyana LNG Bunkering Market - Competitive Landscape |
10.1 Guyana LNG Bunkering Market Revenue Share, By Companies, 2024 |
10.2 Guyana LNG Bunkering Market Competitive Benchmarking, By Operating and Technical Parameters |
11 Company Profiles |
12 Recommendations | 13 Disclaimer |
Global Go To Market Strategy - 2030
Export potential enables firms to identify high-growth global markets with greater confidence by combining advanced trade intelligence with a structured quantitative methodology. The framework analyzes emerging demand trends and country-level import patterns while integrating macroeconomic and trade datasets such as GDP and population forecasts, bilateral import–export flows, tariff structures, elasticity differentials between developed and developing economies, geographic distance, and import demand projections. Using weighted trade values from 2020–2024 as the base period to project country-to-country export potential for 2030, these inputs are operationalized through calculated drivers such as gravity model parameters, tariff impact factors, and projected GDP per-capita growth. Through an analysis of hidden potentials, demand hotspots, and market conditions that are most favorable to success, this method enables firms to focus on target countries, maximize returns, and global expansion with data, backed by accuracy.
By factoring in the projected importer demand gap that is currently unmet and could be potential opportunity, it identifies the potential for the Exporter (Country) among 190 countries, against the general trade analysis, which identifies the biggest importer or exporter.
To discover high-growth global markets and optimize your business strategy:
Click Here
Pricing
- Single User License$ 1,995
- Department License$ 2,400
- Site License$ 3,120
- Global License$ 3,795

Leadership Perspectives from Industry Events
Search
Thought Leadership and Analyst Meet


Our Clients
6WResearch In News
- India Export Attractiveness Tracker 2026
- India Air Conditioner Market Set for Strong Rebound in 2026 After Weather-Led Correction and GST-Driven Recovery: 6Wresearch
- ADAS in India: How Automatic Emergency Braking, Blind Spot Detection & Driver Monitoring are Transforming Road Safety
- Doha a strategic location for EV manufacturing hub: IPA Qatar
- Demand for luxury TVs surging in the GCC, says Samsung
- Empowering Growth: The Thriving Journey of Bangladesh’s Cable Industry
Latest Reports
- Nicaragua RPG Gaming Market (2026-2032)
- New Zealand RPG Gaming Market (2026-2032)
- Netherlands RPG Gaming Market (2026-2032)
- Nauru RPG Gaming Market (2026-2032)
- Namibia RPG Gaming Market (2026-2032)
- Mozambique RPG Gaming Market (2026-2032)
- Montenegro RPG Gaming Market (2026-2032)
- Mongolia RPG Gaming Market (2026-2032)
- Monaco RPG Gaming Market (2026-2032)
- Micronesia RPG Gaming Market (2026-2032)
Industry Events and Analyst Meet

EV India Expo 2026

HIMTEX 2026

India Refining Summit 2026

India EV Show 2026

EV tech India Expo 2026
Whitepaper
- Middle East & Africa Commercial Security Market Click here to view more.
- Middle East & Africa Fire Safety Systems & Equipment Market Click here to view more.
- GCC Drone Market Click here to view more.
- Middle East Lighting Fixture Market Click here to view more.
- GCC Physical & Perimeter Security Market Click here to view more.