Guyana Low Migration Inks Market (2025-2031) | Outlook, Trends, Size, Revenue, Companies, Segmentation, Growth, Share, Industry, Analysis, Forecast & Value
Market Forecast By Process (Gravure, Flexography, Off-Set, Digital), By End Use Industry (Food & Beverages, Pharmaceutical, Cosmetics) And Competitive Landscape
| Product Code: ETC5652921 | Publication Date: Nov 2023 | Updated Date: Nov 2025 | Product Type: Market Research Report | |
| Publisher: 6Wresearch | Author: Sumit Sagar | No. of Pages: 60 | No. of Figures: 30 | No. of Tables: 5 |
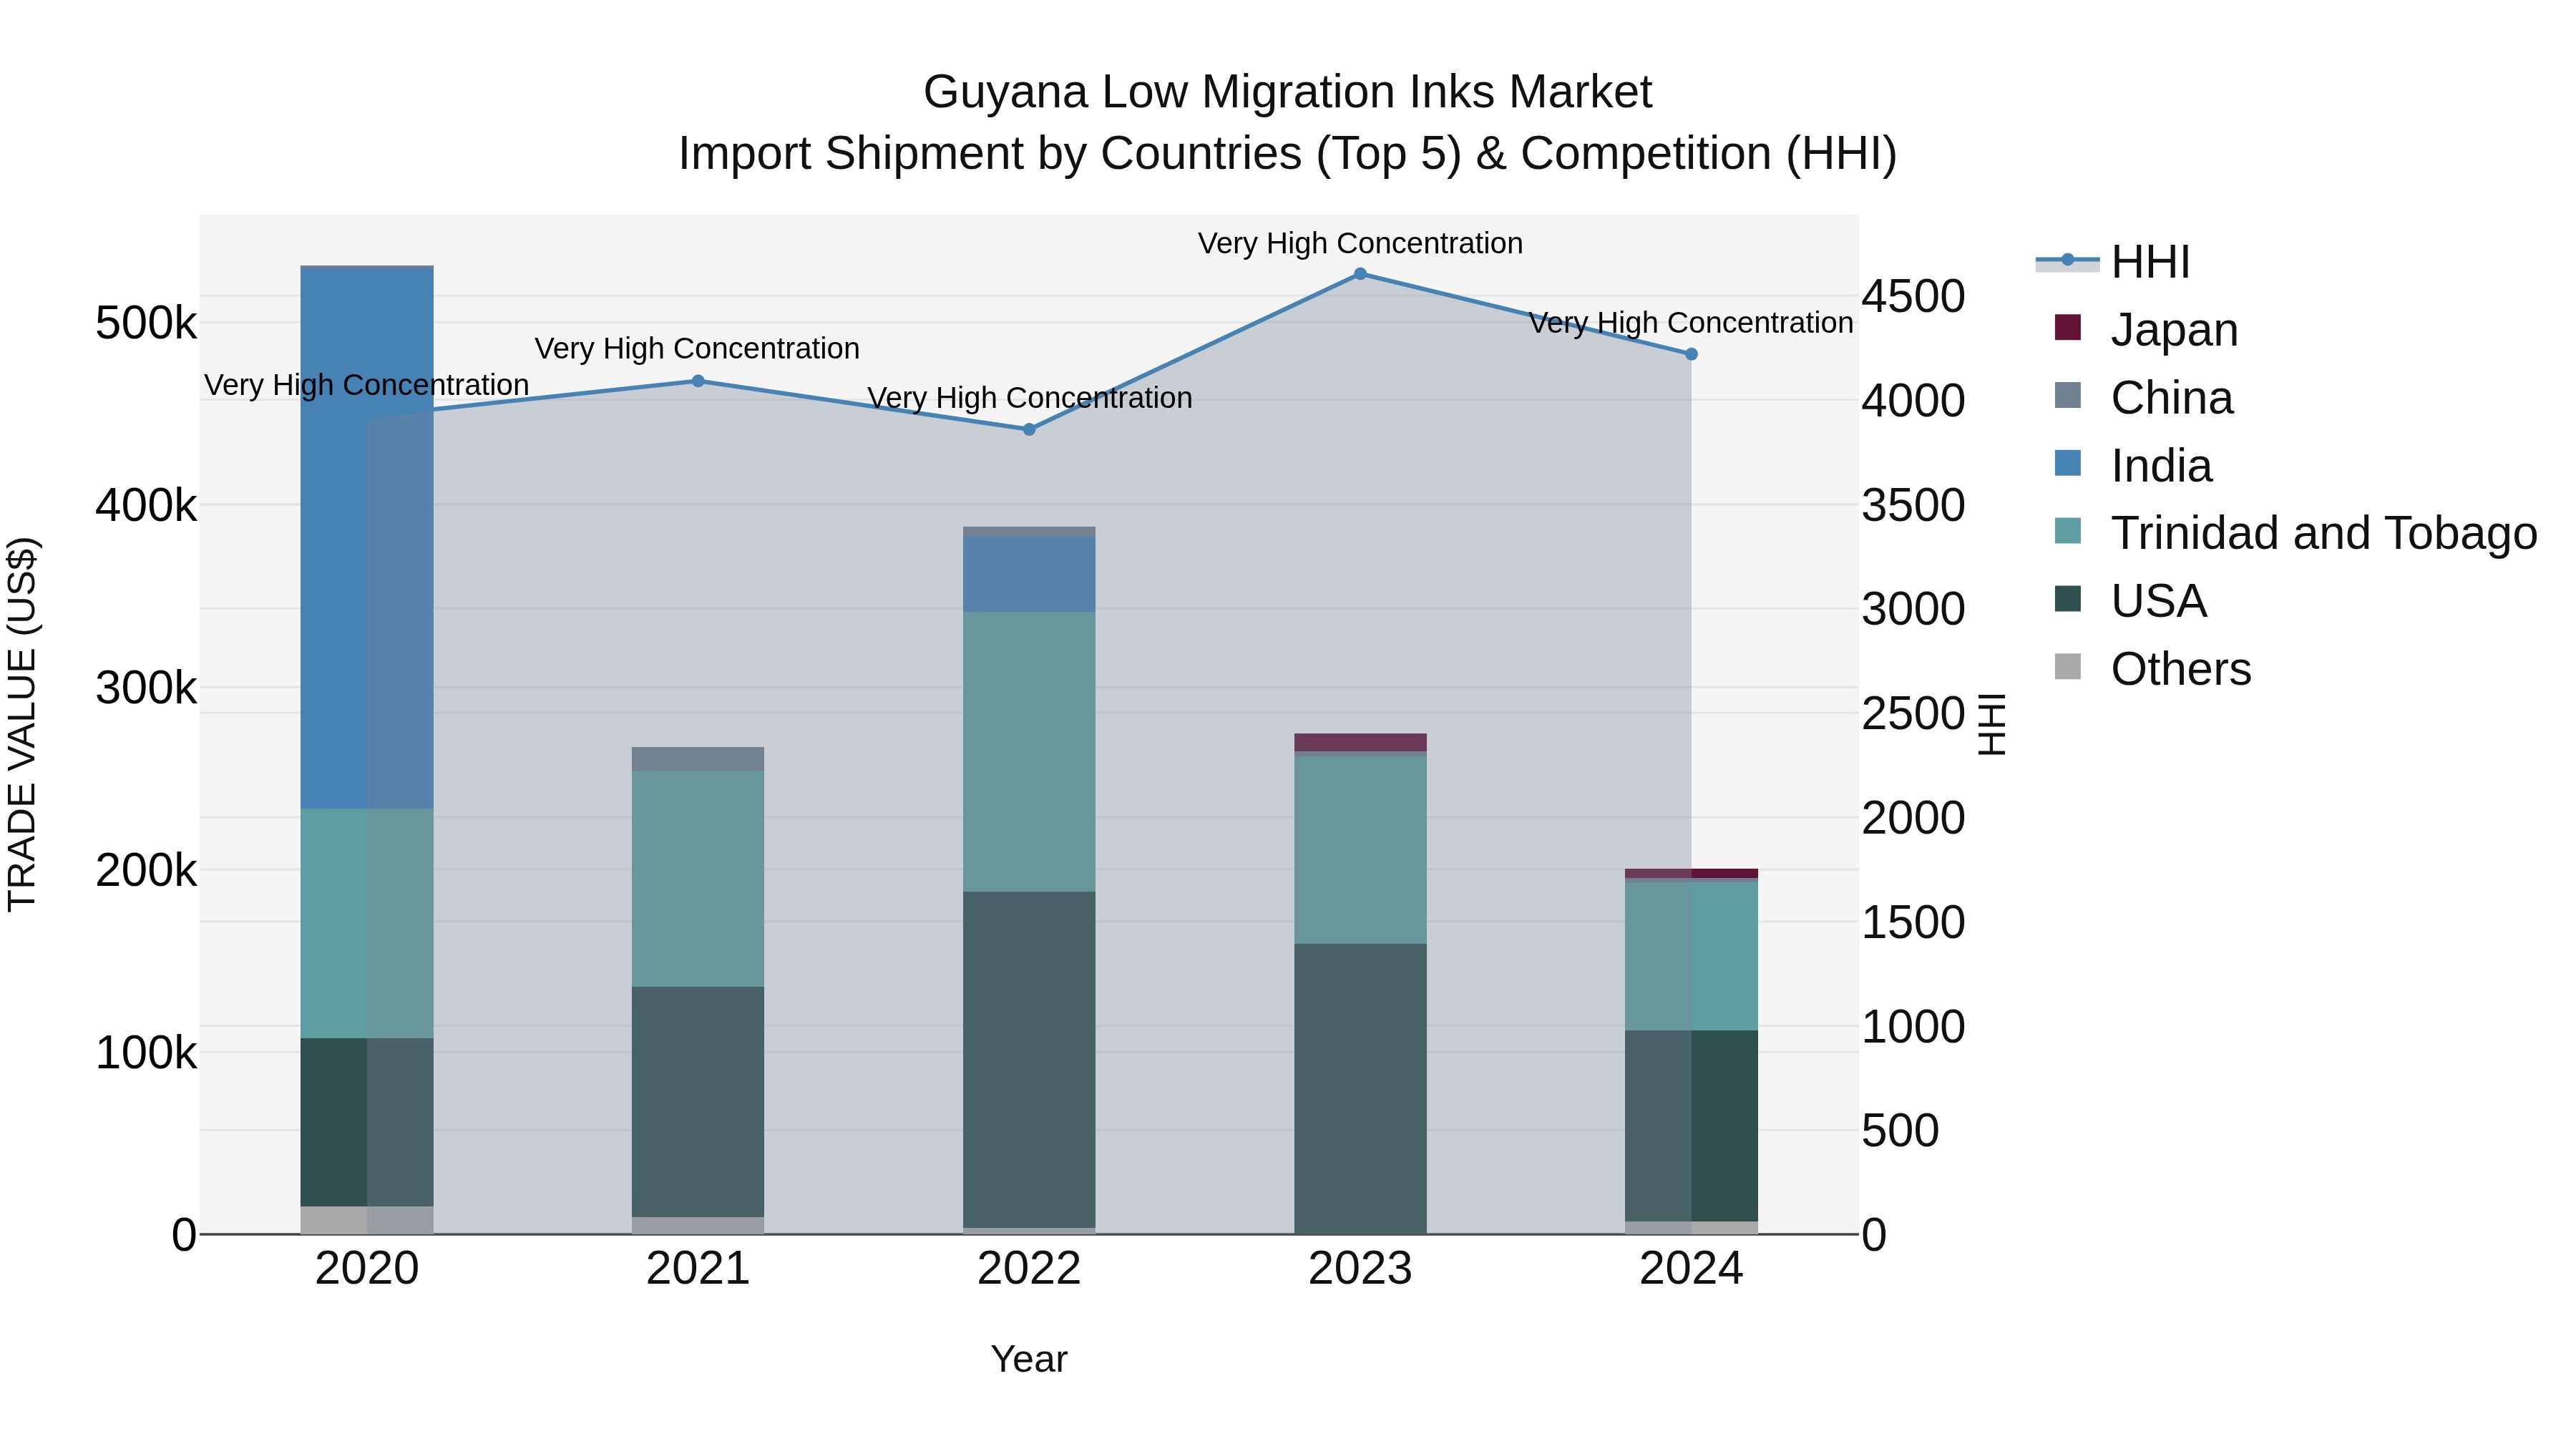
Guyana Low Migration Inks Market Top 5 Importing Countries and Market Competition (HHI) Analysis
Guyana`s low migration inks import shipments saw a decline in growth rate in 2024, with a CAGR of -21.62% from 2020 to 2024. Despite this, the market remained highly concentrated with a high Herfindahl-Hirschman Index (HHI). The top countries exporting to Guyana in 2024 were the USA, Trinidad and Tobago, Japan, Singapore, and Sweden. The negative growth rate of -27.01% from 2023 to 2024 indicates challenges in the market, suggesting a need for further analysis and strategic planning to stimulate growth in the future.
Guyana Low Migration Inks Market Overview
The low migration inks market in Guyana serves the food and beverage packaging industry, ensuring compliance with safety standards. These inks prevent the transfer of harmful substances into packaged products, meeting consumer and regulatory demands.
Drivers of the market
The low migration inks market in Guyana is growing due to the increasing demand for inks that do not transfer harmful chemicals to food or packaging materials. Low migration inks are used primarily in food and beverage packaging, where the risk of ink chemicals migrating into the product is a major concern. As consumer awareness of food safety and regulatory compliance increases, businesses in Guyana are adopting low migration inks to ensure the safety and quality of their products. The growth of the packaging industry and the need for eco-friendly alternatives are key drivers of this market.
Challenges of the market
The low migration inks market struggles with limited awareness among end-users and the high costs of production. Stringent regulatory requirements for food-safe inks also present challenges.
Government Policy of the market
The government has encouraged the use of low migration inks in packaging to meet global safety standards. Policies include offering grants to manufacturers adopting these inks and reducing import duties on raw materials required for their production.
Key Highlights of the Report:
- Guyana Low Migration Inks Market Outlook
- Market Size of Guyana Low Migration Inks Market, 2024
- Forecast of Guyana Low Migration Inks Market, 2031
- Historical Data and Forecast of Guyana Low Migration Inks Revenues & Volume for the Period 2021-2031
- Guyana Low Migration Inks Market Trend Evolution
- Guyana Low Migration Inks Market Drivers and Challenges
- Guyana Low Migration Inks Price Trends
- Guyana Low Migration Inks Porter`s Five Forces
- Guyana Low Migration Inks Industry Life Cycle
- Historical Data and Forecast of Guyana Low Migration Inks Market Revenues & Volume By Process for the Period 2021-2031
- Historical Data and Forecast of Guyana Low Migration Inks Market Revenues & Volume By Gravure for the Period 2021-2031
- Historical Data and Forecast of Guyana Low Migration Inks Market Revenues & Volume By Flexography for the Period 2021-2031
- Historical Data and Forecast of Guyana Low Migration Inks Market Revenues & Volume By Off-Set for the Period 2021-2031
- Historical Data and Forecast of Guyana Low Migration Inks Market Revenues & Volume By Digital for the Period 2021-2031
- Historical Data and Forecast of Guyana Low Migration Inks Market Revenues & Volume By End Use Industry for the Period 2021-2031
- Historical Data and Forecast of Guyana Low Migration Inks Market Revenues & Volume By Food & Beverages for the Period 2021-2031
- Historical Data and Forecast of Guyana Low Migration Inks Market Revenues & Volume By Pharmaceutical for the Period 2021-2031
- Historical Data and Forecast of Guyana Low Migration Inks Market Revenues & Volume By Cosmetics for the Period 2021-2031
- Guyana Low Migration Inks Import Export Trade Statistics
- Market Opportunity Assessment By Process
- Market Opportunity Assessment By End Use Industry
- Guyana Low Migration Inks Top Companies Market Share
- Guyana Low Migration Inks Competitive Benchmarking By Technical and Operational Parameters
- Guyana Low Migration Inks Company Profiles
- Guyana Low Migration Inks Key Strategic Recommendations
Frequently Asked Questions About the Market Study (FAQs):
6Wresearch actively monitors the Guyana Low Migration Inks Market and publishes its comprehensive annual report, highlighting emerging trends, growth drivers, revenue analysis, and forecast outlook. Our insights help businesses to make data-backed strategic decisions with ongoing market dynamics. Our analysts track relevent industries related to the Guyana Low Migration Inks Market, allowing our clients with actionable intelligence and reliable forecasts tailored to emerging regional needs.
Yes, we provide customisation as per your requirements. To learn more, feel free to contact us on sales@6wresearch.com
1 Executive Summary |
2 Introduction |
2.1 Key Highlights of the Report |
2.2 Report Description |
2.3 Market Scope & Segmentation |
2.4 Research Methodology |
2.5 Assumptions |
3 Guyana Low Migration Inks Market Overview |
3.1 Guyana Country Macro Economic Indicators |
3.2 Guyana Low Migration Inks Market Revenues & Volume, 2021 & 2031F |
3.3 Guyana Low Migration Inks Market - Industry Life Cycle |
3.4 Guyana Low Migration Inks Market - Porter's Five Forces |
3.5 Guyana Low Migration Inks Market Revenues & Volume Share, By Process, 2021 & 2031F |
3.6 Guyana Low Migration Inks Market Revenues & Volume Share, By End Use Industry, 2021 & 2031F |
4 Guyana Low Migration Inks Market Dynamics |
4.1 Impact Analysis |
4.2 Market Drivers |
4.2.1 Increasing demand for packaging solutions in industries such as food beverage, pharmaceuticals, and cosmetics |
4.2.2 Growing awareness about environmental concerns and the shift towards sustainable packaging solutions |
4.2.3 Technological advancements in low migration ink formulations leading to improved product performance |
4.3 Market Restraints |
4.3.1 Stringent regulatory requirements and compliance standards for low migration inks |
4.3.2 Limited availability of raw materials and fluctuating prices affecting production costs |
5 Guyana Low Migration Inks Market Trends |
6 Guyana Low Migration Inks Market Segmentations |
6.1 Guyana Low Migration Inks Market, By Process |
6.1.1 Overview and Analysis |
6.1.2 Guyana Low Migration Inks Market Revenues & Volume, By Gravure, 2021-2031F |
6.1.3 Guyana Low Migration Inks Market Revenues & Volume, By Flexography, 2021-2031F |
6.1.4 Guyana Low Migration Inks Market Revenues & Volume, By Off-Set, 2021-2031F |
6.1.5 Guyana Low Migration Inks Market Revenues & Volume, By Digital, 2021-2031F |
6.2 Guyana Low Migration Inks Market, By End Use Industry |
6.2.1 Overview and Analysis |
6.2.2 Guyana Low Migration Inks Market Revenues & Volume, By Food & Beverages, 2021-2031F |
6.2.3 Guyana Low Migration Inks Market Revenues & Volume, By Pharmaceutical, 2021-2031F |
6.2.4 Guyana Low Migration Inks Market Revenues & Volume, By Cosmetics, 2021-2031F |
7 Guyana Low Migration Inks Market Import-Export Trade Statistics |
7.1 Guyana Low Migration Inks Market Export to Major Countries |
7.2 Guyana Low Migration Inks Market Imports from Major Countries |
8 Guyana Low Migration Inks Market Key Performance Indicators |
8.1 Research and development investment in low migration ink technologies |
8.2 Adoption rate of low migration inks by key industries in Guyana |
8.3 Number of certifications obtained for low migration inks formulations |
8.4 Percentage of market growth attributed to low migration inks usage |
8.5 Customer satisfaction levels with the performance of low migration inks |
9 Guyana Low Migration Inks Market - Opportunity Assessment |
9.1 Guyana Low Migration Inks Market Opportunity Assessment, By Process, 2021 & 2031F |
9.2 Guyana Low Migration Inks Market Opportunity Assessment, By End Use Industry, 2021 & 2031F |
10 Guyana Low Migration Inks Market - Competitive Landscape |
10.1 Guyana Low Migration Inks Market Revenue Share, By Companies, 2024 |
10.2 Guyana Low Migration Inks Market Competitive Benchmarking, By Operating and Technical Parameters |
11 Company Profiles |
12 Recommendations | 13 Disclaimer |
Export potential assessment - trade Analytics for 2030
Export potential enables firms to identify high-growth global markets with greater confidence by combining advanced trade intelligence with a structured quantitative methodology. The framework analyzes emerging demand trends and country-level import patterns while integrating macroeconomic and trade datasets such as GDP and population forecasts, bilateral import–export flows, tariff structures, elasticity differentials between developed and developing economies, geographic distance, and import demand projections. Using weighted trade values from 2020–2024 as the base period to project country-to-country export potential for 2030, these inputs are operationalized through calculated drivers such as gravity model parameters, tariff impact factors, and projected GDP per-capita growth. Through an analysis of hidden potentials, demand hotspots, and market conditions that are most favorable to success, this method enables firms to focus on target countries, maximize returns, and global expansion with data, backed by accuracy.
By factoring in the projected importer demand gap that is currently unmet and could be potential opportunity, it identifies the potential for the Exporter (Country) among 190 countries, against the general trade analysis, which identifies the biggest importer or exporter.
To discover high-growth global markets and optimize your business strategy:
Click Here
Pricing
- Single User License$ 1,995
- Department License$ 2,400
- Site License$ 3,120
- Global License$ 3,795

Thought Leadership
Search
Thought Leadership and Analyst Meet


Our Clients
Latest Reports
- New Zealand Aseptic Manufacturing Market (2026-2032)
- Netherlands Aseptic Manufacturing Market (2026-2032)
- Nauru Aseptic Manufacturing Market (2026-2032)
- Namibia Aseptic Manufacturing Market (2026-2032)
- Mozambique Aseptic Manufacturing Market (2026-2032)
- Montenegro Aseptic Manufacturing Market (2026-2032)
- Mongolia Aseptic Manufacturing Market (2026-2032)
- Monaco Aseptic Manufacturing Market (2026-2032)
- Micronesia Aseptic Manufacturing Market (2026-2032)
- Mauritius Aseptic Manufacturing Market (2026-2032)
Industry Events and Analyst Meet

HIMTEX 2026

India Refining Summit 2026

India EV Show 2026

EV tech India Expo 2026

Auto Tech Asia 2026
Whitepaper
- Middle East & Africa Commercial Security Market Click here to view more.
- Middle East & Africa Fire Safety Systems & Equipment Market Click here to view more.
- GCC Drone Market Click here to view more.
- Middle East Lighting Fixture Market Click here to view more.
- GCC Physical & Perimeter Security Market Click here to view more.
6WResearch In News
- Doha a strategic location for EV manufacturing hub: IPA Qatar
- Demand for luxury TVs surging in the GCC, says Samsung
- Empowering Growth: The Thriving Journey of Bangladesh’s Cable Industry
- Demand for luxury TVs surging in the GCC, says Samsung
- Video call with a traditional healer? Once unthinkable, it’s now common in South Africa
- Intelligent Buildings To Smooth GCC’s Path To Net Zero