Guyana Polyurethane (PU) Microspheres Market (2025-2031) | Revenue, Size, Outlook, Growth, Analysis, Share, Forecast, Companies, Trends, Value, Segmentation & Industry
Market Forecast By Applications (Encapsulation, Paints & coatings, Adhesives films, Cosmetics, Other applications) And Competitive Landscape
| Product Code: ETC5738041 | Publication Date: Nov 2023 | Updated Date: Nov 2025 | Product Type: Market Research Report | |
| Publisher: 6Wresearch | Author: Sumit Sagar | No. of Pages: 60 | No. of Figures: 30 | No. of Tables: 5 |
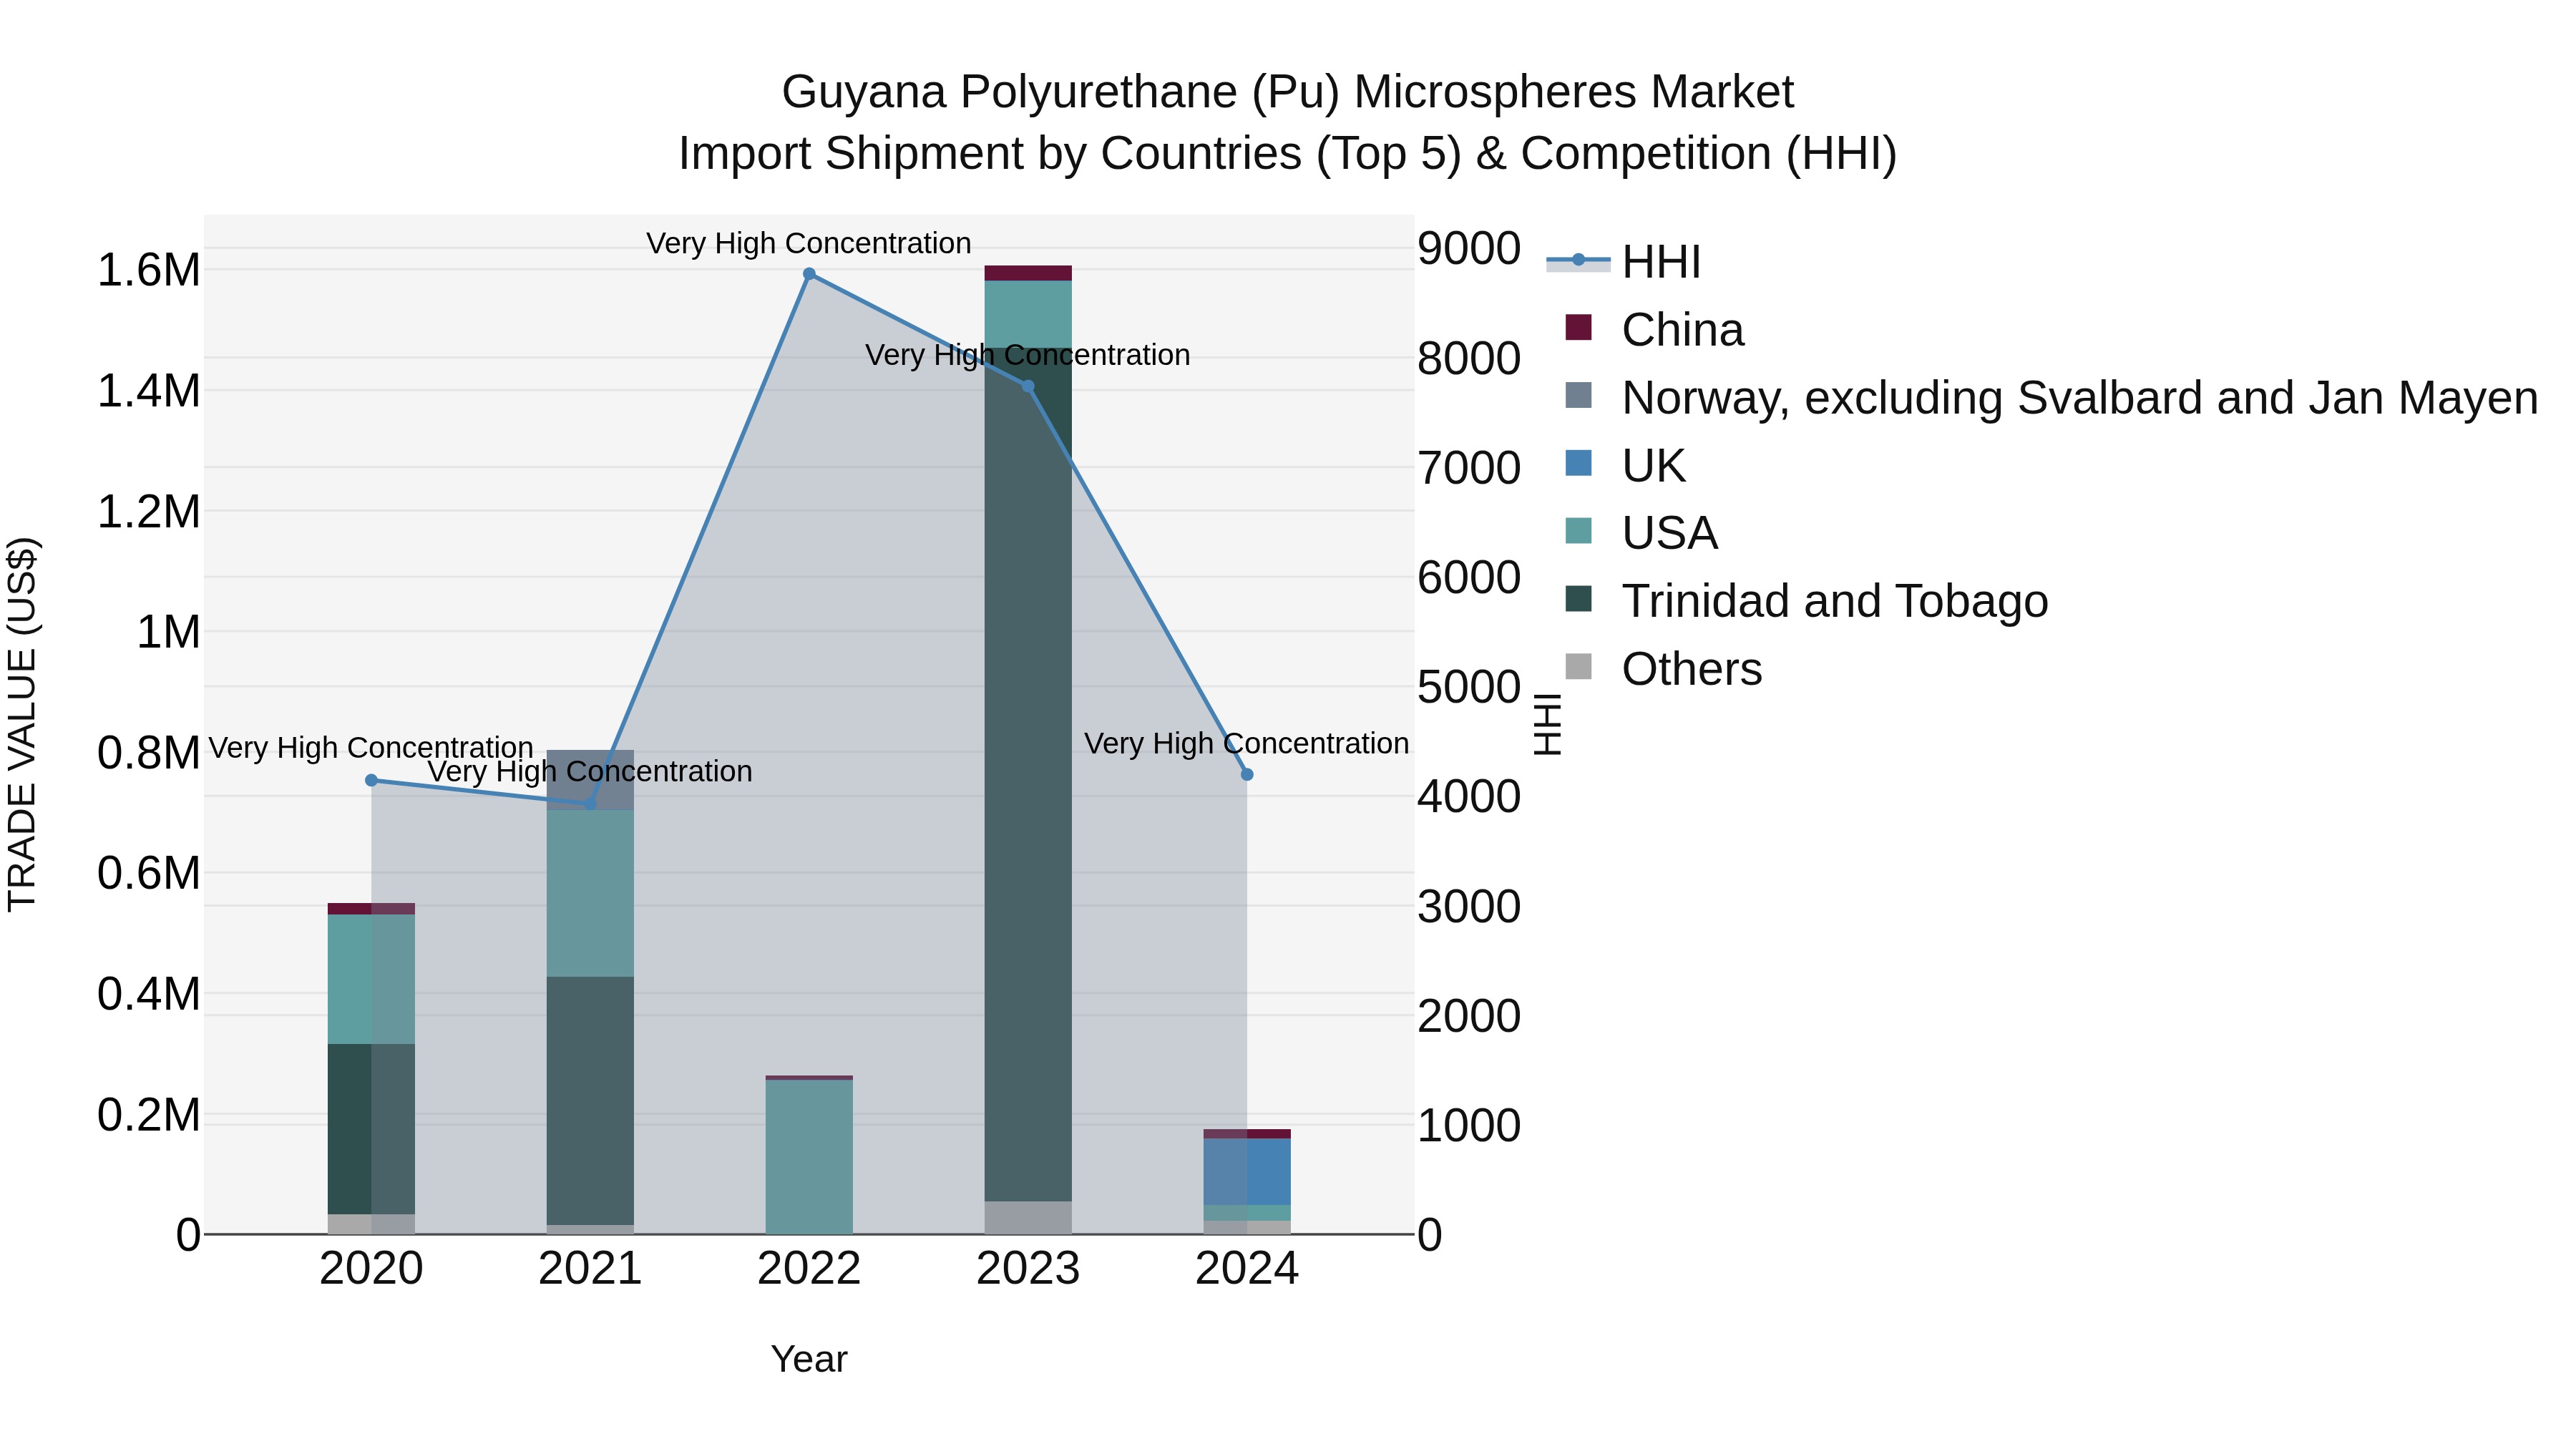
Guyana Polyurethane (Pu) Microspheres Market Top 5 Importing Countries and Market Competition (HHI) Analysis
Guyana`s import of polyurethane microspheres saw a significant decline in 2024, with the top exporting countries being the UK, USA, Brazil, China, and Norway. Despite the high Herfindahl-Hirschman Index (HHI) indicating a concentrated market, the compound annual growth rate (CAGR) for 2020-2024 was -24.96%. The steep decline in growth rate from 2023 to 2024 at -89.16% may indicate shifting trends or challenges in the market. It will be crucial for market players to closely monitor these dynamics and adapt their strategies accordingly.
Guyana Polyurethane (PU) Microspheres Market Overview
The polyurethane (PU) microspheres market in Guyana is growing due to their versatile applications in coatings, cosmetics, pharmaceuticals, and other industries. PU microspheres offer benefits such as controlled release, encapsulation, and improved texture in products like paints, cosmetics, and drug delivery systems. As the demand for innovative, high-performance materials increases, particularly in industries focused on enhancing product quality and efficiency, the PU microspheres market in Guyana is expected to see continued growth, fueled by technological advancements and consumer preferences for functional products.
Drivers of the market
The polyurethane microspheres market in Guyana is witnessing growth as industries increasingly utilize these versatile materials in applications such as coatings, adhesives, and medical diagnostics. Polyurethane microspheres are known for their lightweight, durability, and ability to form microstructures that can be used in a variety of industries, from automotive to pharmaceuticals. Their application in the automotive industry for coatings and in the medical field for drug delivery systems is expanding. The development of advanced manufacturing processes and the increasing focus on eco-friendly products are expected to further propel market growth in Guyana.
Challenges of the market
The polyurethane microspheres market in Guyana faces obstacles due to limited applications in key industries such as coatings and cosmetics. High production costs and a lack of local manufacturing capabilities restrict market growth.
Government Policy of the market
The government facilitates the growth of the polyurethane microspheres market by encouraging its applications in coatings, adhesives, and medical industries. Tax breaks for research and development and reduced tariffs for raw materials support innovation. Regulatory policies ensure that production aligns with environmental and safety standards.
Key Highlights of the Report:
- Guyana Polyurethane (PU) Microspheres Market Outlook
- Market Size of Guyana Polyurethane (PU) Microspheres Market, 2024
- Forecast of Guyana Polyurethane (PU) Microspheres Market, 2031
- Historical Data and Forecast of Guyana Polyurethane (PU) Microspheres Revenues & Volume for the Period 2021-2031
- Guyana Polyurethane (PU) Microspheres Market Trend Evolution
- Guyana Polyurethane (PU) Microspheres Market Drivers and Challenges
- Guyana Polyurethane (PU) Microspheres Price Trends
- Guyana Polyurethane (PU) Microspheres Porter`s Five Forces
- Guyana Polyurethane (PU) Microspheres Industry Life Cycle
- Historical Data and Forecast of Guyana Polyurethane (PU) Microspheres Market Revenues & Volume By Applications for the Period 2021-2031
- Historical Data and Forecast of Guyana Polyurethane (PU) Microspheres Market Revenues & Volume By Encapsulation for the Period 2021-2031
- Historical Data and Forecast of Guyana Polyurethane (PU) Microspheres Market Revenues & Volume By Paints & coatings for the Period 2021-2031
- Historical Data and Forecast of Guyana Polyurethane (PU) Microspheres Market Revenues & Volume By Adhesives films for the Period 2021-2031
- Historical Data and Forecast of Guyana Polyurethane (PU) Microspheres Market Revenues & Volume By Cosmetics for the Period 2021-2031
- Historical Data and Forecast of Guyana Polyurethane (PU) Microspheres Market Revenues & Volume By Other applications for the Period 2021-2031
- Guyana Polyurethane (PU) Microspheres Import Export Trade Statistics
- Market Opportunity Assessment By Applications
- Guyana Polyurethane (PU) Microspheres Top Companies Market Share
- Guyana Polyurethane (PU) Microspheres Competitive Benchmarking By Technical and Operational Parameters
- Guyana Polyurethane (PU) Microspheres Company Profiles
- Guyana Polyurethane (PU) Microspheres Key Strategic Recommendations
Frequently Asked Questions About the Market Study (FAQs):
6Wresearch actively monitors the Guyana Polyurethane (PU) Microspheres Market and publishes its comprehensive annual report, highlighting emerging trends, growth drivers, revenue analysis, and forecast outlook. Our insights help businesses to make data-backed strategic decisions with ongoing market dynamics. Our analysts track relevent industries related to the Guyana Polyurethane (PU) Microspheres Market, allowing our clients with actionable intelligence and reliable forecasts tailored to emerging regional needs.
Yes, we provide customisation as per your requirements. To learn more, feel free to contact us on sales@6wresearch.com
1 Executive Summary |
2 Introduction |
2.1 Key Highlights of the Report |
2.2 Report Description |
2.3 Market Scope & Segmentation |
2.4 Research Methodology |
2.5 Assumptions |
3 Guyana Polyurethane (PU) Microspheres Market Overview |
3.1 Guyana Country Macro Economic Indicators |
3.2 Guyana Polyurethane (PU) Microspheres Market Revenues & Volume, 2021 & 2031F |
3.3 Guyana Polyurethane (PU) Microspheres Market - Industry Life Cycle |
3.4 Guyana Polyurethane (PU) Microspheres Market - Porter's Five Forces |
3.5 Guyana Polyurethane (PU) Microspheres Market Revenues & Volume Share, By Applications, 2021 & 2031F |
4 Guyana Polyurethane (PU) Microspheres Market Dynamics |
4.1 Impact Analysis |
4.2 Market Drivers |
4.2.1 Increasing demand for lightweight materials in various industries such as automotive, construction, and packaging |
4.2.2 Growing awareness about the benefits of polyurethane microspheres in reducing weight and enhancing performance of end products |
4.2.3 Rising investment in research and development activities to innovate new applications for polyurethane microspheres |
4.3 Market Restraints |
4.3.1 Fluctuating raw material prices impacting production costs |
4.3.2 Stringent regulations regarding the use of certain chemicals in polyurethane microspheres production |
4.3.3 Competition from substitute materials like glass microspheres and ceramic microspheres |
5 Guyana Polyurethane (PU) Microspheres Market Trends |
6 Guyana Polyurethane (PU) Microspheres Market Segmentations |
6.1 Guyana Polyurethane (PU) Microspheres Market, By Applications |
6.1.1 Overview and Analysis |
6.1.2 Guyana Polyurethane (PU) Microspheres Market Revenues & Volume, By Encapsulation, 2021-2031F |
6.1.3 Guyana Polyurethane (PU) Microspheres Market Revenues & Volume, By Paints & coatings, 2021-2031F |
6.1.4 Guyana Polyurethane (PU) Microspheres Market Revenues & Volume, By Adhesives films, 2021-2031F |
6.1.5 Guyana Polyurethane (PU) Microspheres Market Revenues & Volume, By Cosmetics, 2021-2031F |
6.1.6 Guyana Polyurethane (PU) Microspheres Market Revenues & Volume, By Other applications, 2021-2031F |
7 Guyana Polyurethane (PU) Microspheres Market Import-Export Trade Statistics |
7.1 Guyana Polyurethane (PU) Microspheres Market Export to Major Countries |
7.2 Guyana Polyurethane (PU) Microspheres Market Imports from Major Countries |
8 Guyana Polyurethane (PU) Microspheres Market Key Performance Indicators |
8.1 Research and development investment in new applications for polyurethane microspheres |
8.2 Number of patents filed for innovations in polyurethane microspheres technology |
8.3 Adoption rate of polyurethane microspheres in key industries such as automotive and construction |
9 Guyana Polyurethane (PU) Microspheres Market - Opportunity Assessment |
9.1 Guyana Polyurethane (PU) Microspheres Market Opportunity Assessment, By Applications, 2021 & 2031F |
10 Guyana Polyurethane (PU) Microspheres Market - Competitive Landscape |
10.1 Guyana Polyurethane (PU) Microspheres Market Revenue Share, By Companies, 2024 |
10.2 Guyana Polyurethane (PU) Microspheres Market Competitive Benchmarking, By Operating and Technical Parameters |
11 Company Profiles |
12 Recommendations | 13 Disclaimer |
Global Go To Market Strategy - 2030
Export potential enables firms to identify high-growth global markets with greater confidence by combining advanced trade intelligence with a structured quantitative methodology. The framework analyzes emerging demand trends and country-level import patterns while integrating macroeconomic and trade datasets such as GDP and population forecasts, bilateral import–export flows, tariff structures, elasticity differentials between developed and developing economies, geographic distance, and import demand projections. Using weighted trade values from 2020–2024 as the base period to project country-to-country export potential for 2030, these inputs are operationalized through calculated drivers such as gravity model parameters, tariff impact factors, and projected GDP per-capita growth. Through an analysis of hidden potentials, demand hotspots, and market conditions that are most favorable to success, this method enables firms to focus on target countries, maximize returns, and global expansion with data, backed by accuracy.
By factoring in the projected importer demand gap that is currently unmet and could be potential opportunity, it identifies the potential for the Exporter (Country) among 190 countries, against the general trade analysis, which identifies the biggest importer or exporter.
To discover high-growth global markets and optimize your business strategy:
Click Here
Pricing
- Single User License$ 1,995
- Department License$ 2,400
- Site License$ 3,120
- Global License$ 3,795

Leadership Perspectives from Industry Events
Search
Thought Leadership and Analyst Meet


Our Clients
6WResearch In News
- Doha a strategic location for EV manufacturing hub: IPA Qatar
- Demand for luxury TVs surging in the GCC, says Samsung
- Empowering Growth: The Thriving Journey of Bangladesh’s Cable Industry
- Demand for luxury TVs surging in the GCC, says Samsung
- Video call with a traditional healer? Once unthinkable, it’s now common in South Africa
- Intelligent Buildings To Smooth GCC’s Path To Net Zero
Latest Reports
- Cape Verde Portable Hand-Thrown Extinguisher Market (2026-2032)
- Canada Portable Hand-Thrown Extinguisher Market (2026-2032)
- Cameroon Portable Hand-Thrown Extinguisher Market (2026-2032)
- Burundi Portable Hand-Thrown Extinguisher Market (2026-2032)
- Burkina Faso Portable Hand-Thrown Extinguisher Market (2026-2032)
- Bulgaria Portable Hand-Thrown Extinguisher Market (2026-2032)
- Brunei Portable Hand-Thrown Extinguisher Market (2026-2032)
- Botswana Portable Hand-Thrown Extinguisher Market (2026-2032)
- Bosnia and Herzegovina Portable Hand-Thrown Extinguisher Market (2026-2032)
- Bolivia Portable Hand-Thrown Extinguisher Market (2026-2032)
Industry Events and Analyst Meet

HIMTEX 2026

India Refining Summit 2026

India EV Show 2026

EV tech India Expo 2026

Auto Tech Asia 2026
Whitepaper
- Middle East & Africa Commercial Security Market Click here to view more.
- Middle East & Africa Fire Safety Systems & Equipment Market Click here to view more.
- GCC Drone Market Click here to view more.
- Middle East Lighting Fixture Market Click here to view more.
- GCC Physical & Perimeter Security Market Click here to view more.