Guyana Print Label Market (2026-2032) | Share, Segmentation, Trends, Size, Value, Growth, Revenue, Analysis, Companies, Forecast, Outlook & Industry
Market Forecast By Print Process (Offset lithography, Gravure, Flexography, Screen, Letterpress, Electrophotography, Inkjet), By Label Format (Wet-glue labels, Pressure-sensitive labels, Linerless labels, Multi-part tracking labels, In-mold labels, Sleeves), By End-User (Food, Beverage, Healthcare, Cosmetics, Household, Industrial, Logistics, Other) And Competitive Landscape
| Product Code: ETC5054839 | Publication Date: Nov 2023 | Updated Date: Apr 2026 | Product Type: Market Research Report | |
| Publisher: 6Wresearch | Author: Shubham Padhi | No. of Pages: 60 | No. of Figures: 30 | No. of Tables: 5 |
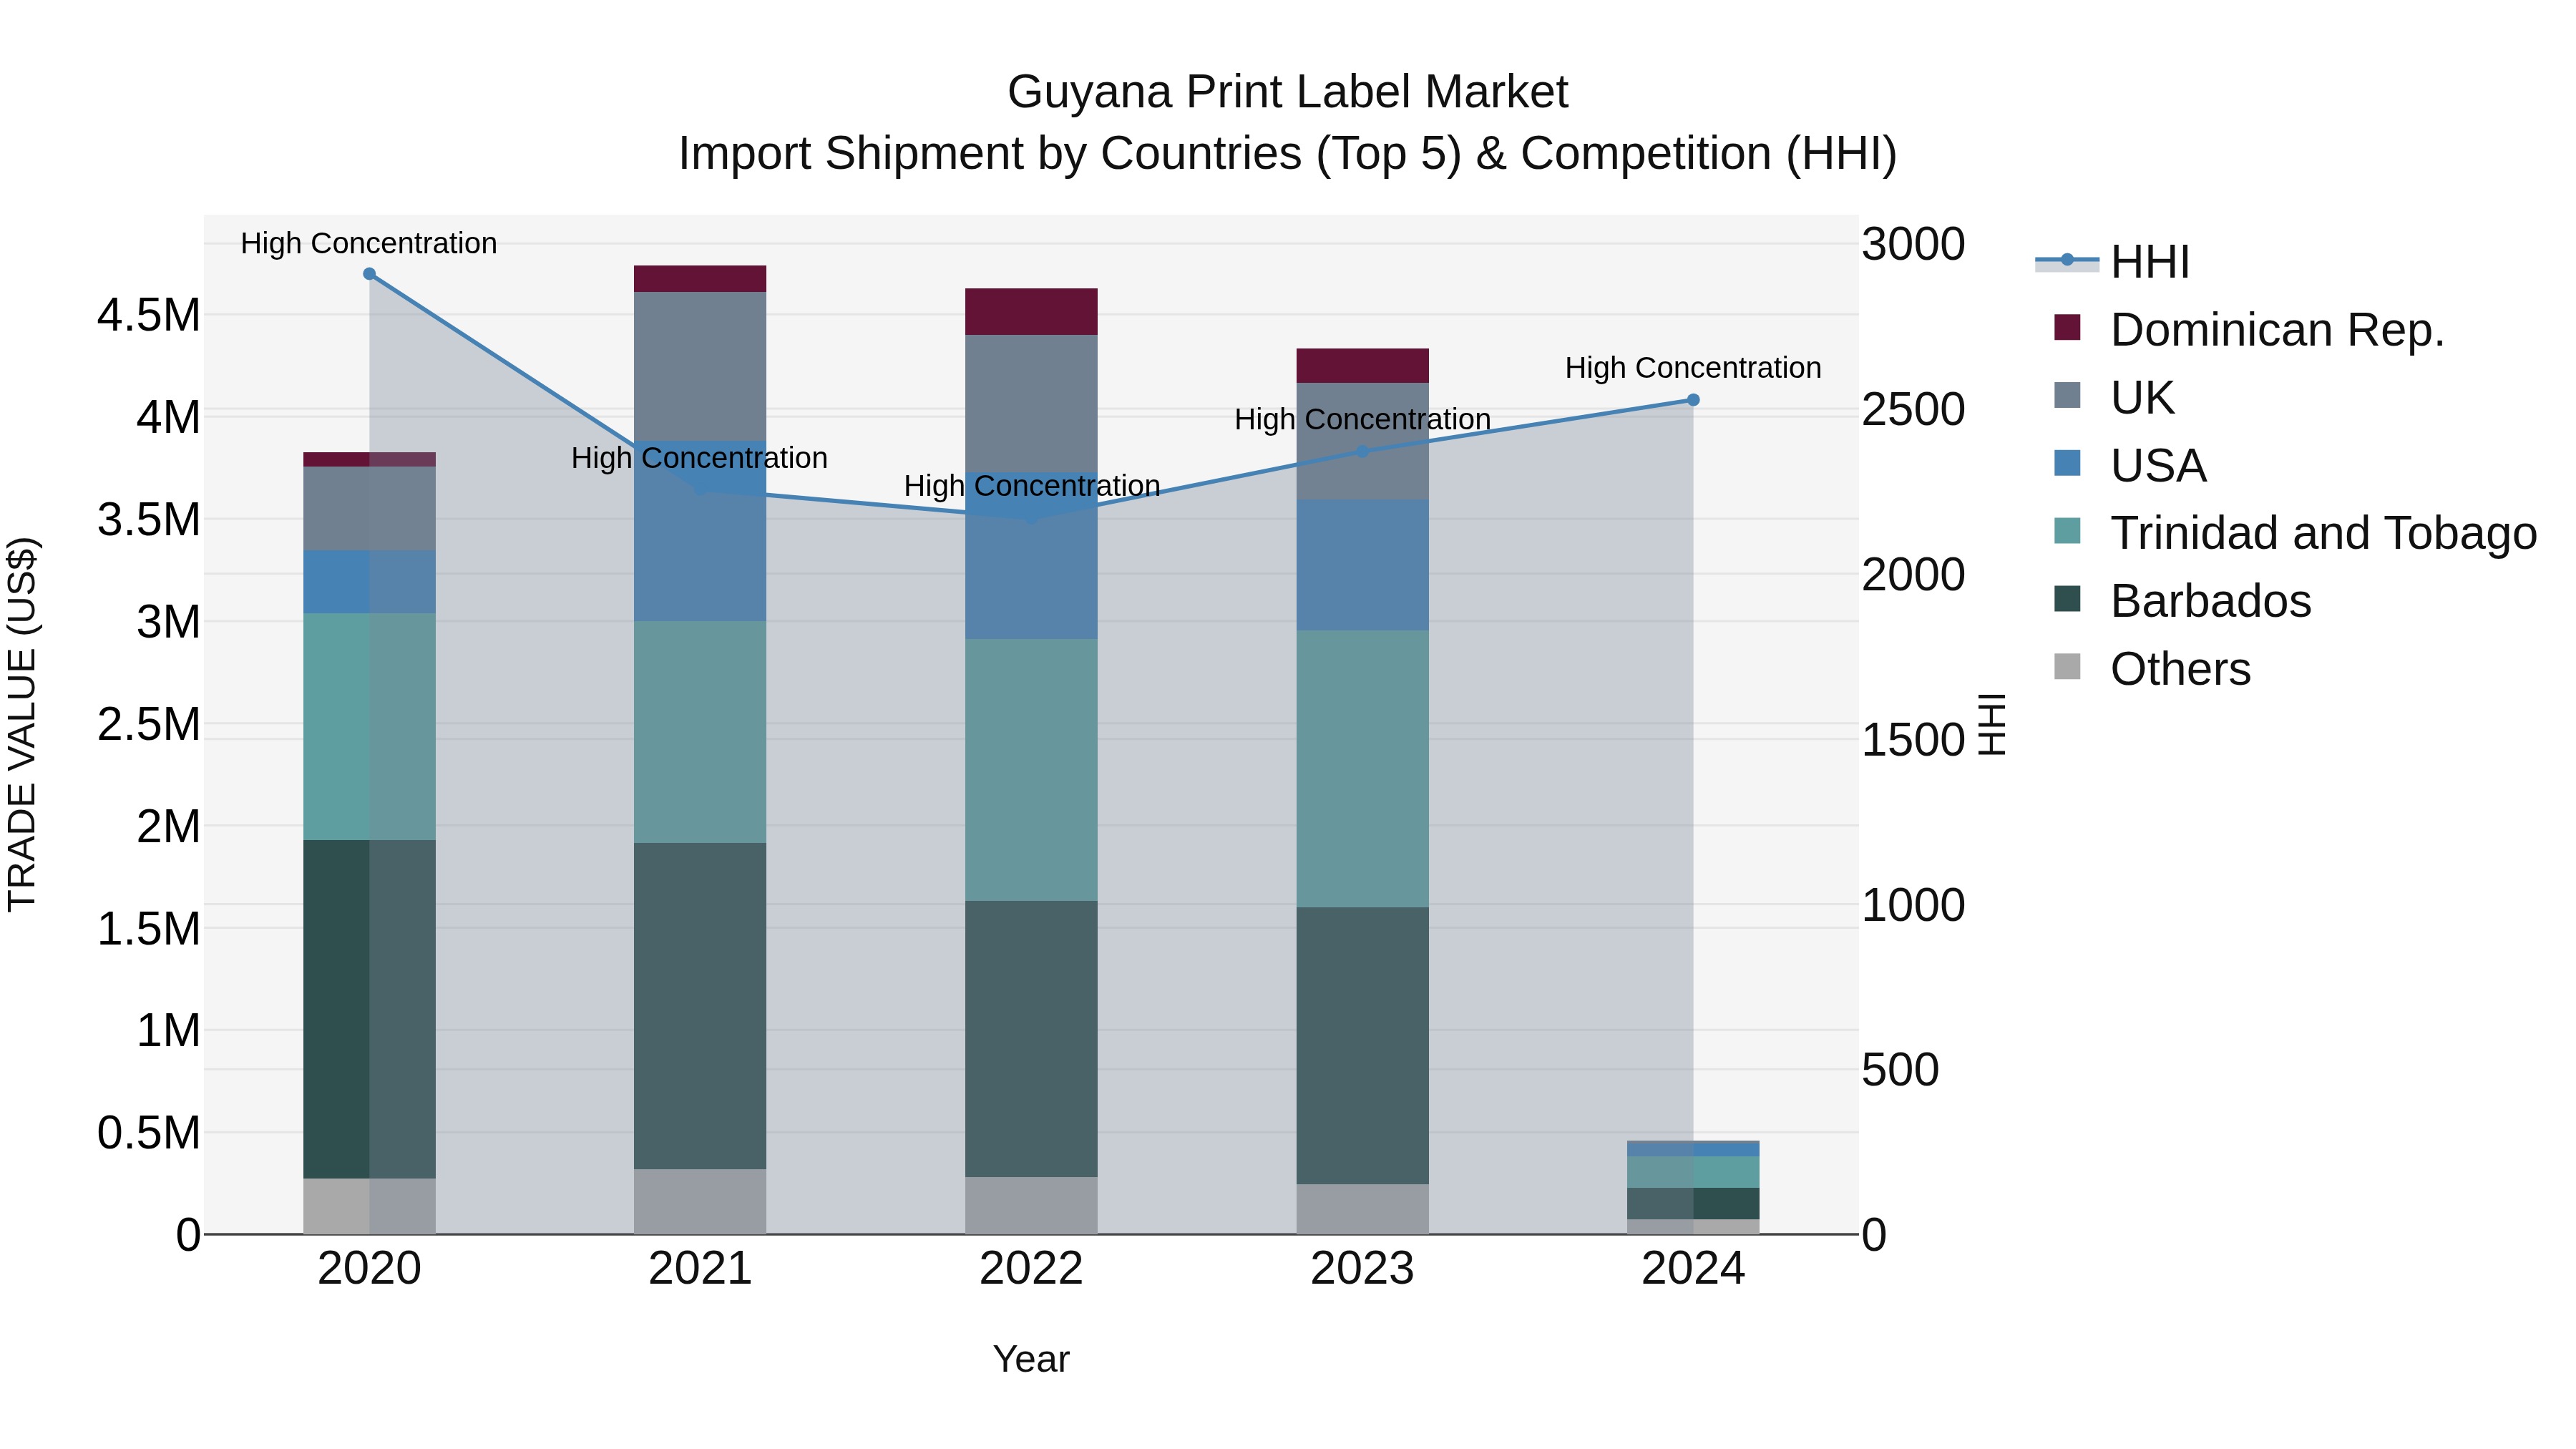
Guyana Print Label Market Top 5 Importing Countries and Market Competition (HHI) Analysis
Guyana`s print label import market in 2024 continued to see a high level of concentration, with top exporting countries including Barbados, Trinidad and Tobago, USA, New Zealand, and China. Despite the challenging market conditions, the Compound Annual Growth Rate (CAGR) for the period 2020-2024 was -41.22%. The growth rate from 2023 to 2024 experienced a significant decline of -89.46%, reflecting the impact of various factors on the import shipments in the industry. As the market dynamics evolve, it will be crucial for stakeholders to adapt and strategize effectively to navigate the changing landscape.
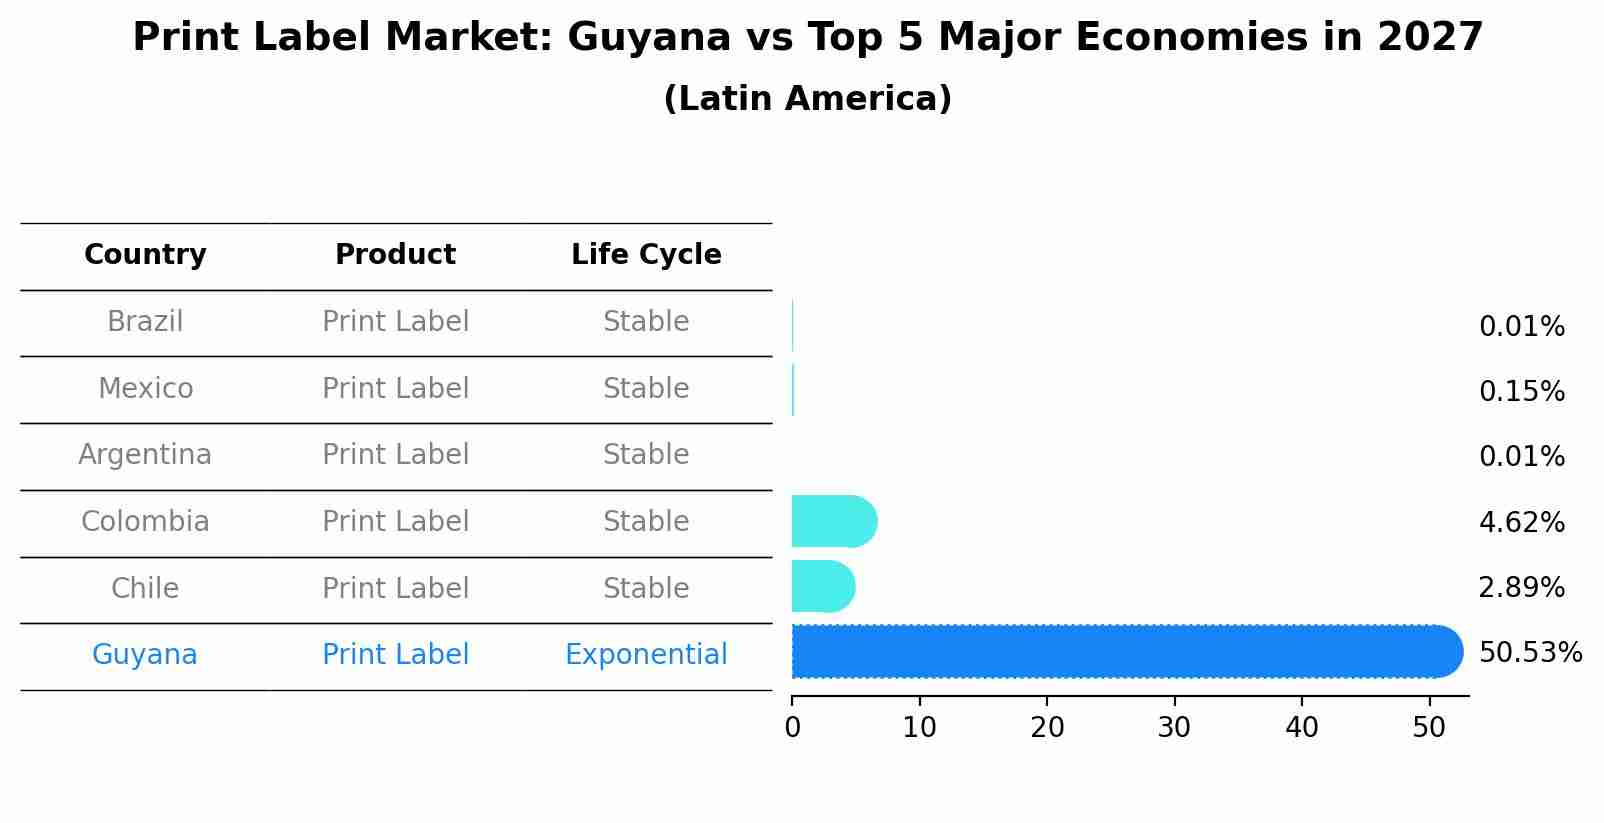
Print Label Market: Guyana vs Top 5 Major Economies in 2027 (Latin America)
In the Latin America region, the Print Label market in Guyana is projected to expand at a exponential growth rate of 50.53% by 2027. The largest economy is Brazil, followed by Mexico, Argentina, Colombia and Chile.
Key Highlights of the Report:
- Guyana Print Label Market Outlook
- Market Size of Guyana Print Label Market, 2025
- Forecast of Guyana Print Label Market, 2032
- Historical Data and Forecast of Guyana Print Label Revenues & Volume for the Period 2022 - 2032F
- Guyana Print Label Market Trend Evolution
- Guyana Print Label Market Drivers and Challenges
- Guyana Print Label Price Trends
- Guyana Print Label Porter`s Five Forces
- Guyana Print Label Industry Life Cycle
- Historical Data and Forecast of Guyana Print Label Market Revenues & Volume By Print Process for the Period 2022 - 2032F
- Historical Data and Forecast of Guyana Print Label Market Revenues & Volume By Offset lithography for the Period 2022 - 2032F
- Historical Data and Forecast of Guyana Print Label Market Revenues & Volume By Gravure for the Period 2022 - 2032F
- Historical Data and Forecast of Guyana Print Label Market Revenues & Volume By Flexography for the Period 2022 - 2032F
- Historical Data and Forecast of Guyana Print Label Market Revenues & Volume By Screen for the Period 2022 - 2032F
- Historical Data and Forecast of Guyana Print Label Market Revenues & Volume By Letterpress for the Period 2022 - 2032F
- Historical Data and Forecast of Guyana Print Label Market Revenues & Volume By Electrophotography for the Period 2022 - 2032F
- Historical Data and Forecast of Guyana Print Label Market Revenues & Volume By Inkjet for the Period 2022 - 2032F
- Historical Data and Forecast of Guyana Print Label Market Revenues & Volume By Label Format for the Period 2022 - 2032F
- Historical Data and Forecast of Guyana Print Label Market Revenues & Volume By Wet-glue labels for the Period 2022 - 2032F
- Historical Data and Forecast of Guyana Print Label Market Revenues & Volume By Pressure-sensitive labels for the Period 2022 - 2032F
- Historical Data and Forecast of Guyana Print Label Market Revenues & Volume By Linerless labels for the Period 2022 - 2032F
- Historical Data and Forecast of Guyana Print Label Market Revenues & Volume By Multi-part tracking labels for the Period 2022 - 2032F
- Historical Data and Forecast of Guyana Print Label Market Revenues & Volume By In-mold labels for the Period 2022 - 2032F
- Historical Data and Forecast of Guyana Print Label Market Revenues & Volume By Sleeves for the Period 2022 - 2032F
- Historical Data and Forecast of Guyana Print Label Market Revenues & Volume By End-User for the Period 2022 - 2032F
- Historical Data and Forecast of Guyana Print Label Market Revenues & Volume By Food for the Period 2022 - 2032F
- Historical Data and Forecast of Guyana Print Label Market Revenues & Volume By Beverage for the Period 2022 - 2032F
- Historical Data and Forecast of Guyana Print Label Market Revenues & Volume By Healthcare for the Period 2022 - 2032F
- Historical Data and Forecast of Guyana Print Label Market Revenues & Volume By Cosmetics for the Period 2022 - 2032F
- Historical Data and Forecast of Guyana Print Label Market Revenues & Volume By Household for the Period 2022 - 2032F
- Historical Data and Forecast of Guyana Print Label Market Revenues & Volume By Industrial for the Period 2022 - 2032F
- Historical Data and Forecast of Guyana Print Label Market Revenues & Volume By Logistics for the Period 2022 - 2032F
- Historical Data and Forecast of Guyana Print Label Market Revenues & Volume By Other for the Period 2022 - 2032F
- Guyana Print Label Import Export Trade Statistics
- Market Opportunity Assessment By Print Process
- Market Opportunity Assessment By Label Format
- Market Opportunity Assessment By End-User
- Guyana Print Label Top Companies Market Share
- Guyana Print Label Competitive Benchmarking By Technical and Operational Parameters
- Guyana Print Label Company Profiles
- Guyana Print Label Key Strategic Recommendations
Frequently Asked Questions About the Market Study (FAQs):
6Wresearch actively monitors the Guyana Print Label Market and publishes its comprehensive annual report, highlighting emerging trends, growth drivers, revenue analysis, and forecast outlook. Our insights help businesses to make data-backed strategic decisions with ongoing market dynamics. Our analysts track relevent industries related to the Guyana Print Label Market, allowing our clients with actionable intelligence and reliable forecasts tailored to emerging regional needs.
Yes, we provide customisation as per your requirements. To learn more, feel free to contact us on sales@6wresearch.com
1 Executive Summary |
2 Introduction |
2.1 Key Highlights of the Report |
2.2 Report Description |
2.3 Market Scope & Segmentation |
2.4 Research Methodology |
2.5 Assumptions |
3 Guyana Print Label Market Overview |
3.1 Guyana Country Macro Economic Indicators |
3.2 Guyana Print Label Market Revenues & Volume, 2022 & 2032F |
3.3 Guyana Print Label Market - Industry Life Cycle |
3.4 Guyana Print Label Market - Porter's Five Forces |
3.5 Guyana Print Label Market Revenues & Volume Share, By Print Process, 2022 & 2032F |
3.6 Guyana Print Label Market Revenues & Volume Share, By Label Format, 2022 & 2032F |
3.7 Guyana Print Label Market Revenues & Volume Share, By End-User, 2022 & 2032F |
4 Guyana Print Label Market Dynamics |
4.1 Impact Analysis |
4.2 Market Drivers |
4.2.1 Increasing demand for customized and high-quality label printing solutions in sectors such as food and beverage, pharmaceuticals, and cosmetics. |
4.2.2 Growing adoption of advanced printing technologies and materials in the label industry. |
4.2.3 Government initiatives promoting local manufacturing and consumption of products, leading to a rise in the demand for printed labels. |
4.3 Market Restraints |
4.3.1 High initial investment costs associated with setting up printing infrastructure and acquiring advanced printing technologies. |
4.3.2 Intense competition in the market leading to pricing pressures and margin erosion. |
4.3.3 Dependence on imported raw materials and fluctuating exchange rates affecting production costs. |
5 Guyana Print Label Market Trends |
6 Guyana Print Label Market Segmentations |
6.1 Guyana Print Label Market, By Print Process |
6.1.1 Overview and Analysis |
6.1.2 Guyana Print Label Market Revenues & Volume, By Offset lithography, 2022 - 2032F |
6.1.3 Guyana Print Label Market Revenues & Volume, By Gravure, 2022 - 2032F |
6.1.4 Guyana Print Label Market Revenues & Volume, By Flexography, 2022 - 2032F |
6.1.5 Guyana Print Label Market Revenues & Volume, By Screen, 2022 - 2032F |
6.1.6 Guyana Print Label Market Revenues & Volume, By Letterpress, 2022 - 2032F |
6.1.7 Guyana Print Label Market Revenues & Volume, By Electrophotography, 2022 - 2032F |
6.2 Guyana Print Label Market, By Label Format |
6.2.1 Overview and Analysis |
6.2.2 Guyana Print Label Market Revenues & Volume, By Wet-glue labels, 2022 - 2032F |
6.2.3 Guyana Print Label Market Revenues & Volume, By Pressure-sensitive labels, 2022 - 2032F |
6.2.4 Guyana Print Label Market Revenues & Volume, By Linerless labels, 2022 - 2032F |
6.2.5 Guyana Print Label Market Revenues & Volume, By Multi-part tracking labels, 2022 - 2032F |
6.2.6 Guyana Print Label Market Revenues & Volume, By In-mold labels, 2022 - 2032F |
6.2.7 Guyana Print Label Market Revenues & Volume, By Sleeves, 2022 - 2032F |
6.3 Guyana Print Label Market, By End-User |
6.3.1 Overview and Analysis |
6.3.2 Guyana Print Label Market Revenues & Volume, By Food, 2022 - 2032F |
6.3.3 Guyana Print Label Market Revenues & Volume, By Beverage, 2022 - 2032F |
6.3.4 Guyana Print Label Market Revenues & Volume, By Healthcare, 2022 - 2032F |
6.3.5 Guyana Print Label Market Revenues & Volume, By Cosmetics, 2022 - 2032F |
6.3.6 Guyana Print Label Market Revenues & Volume, By Household, 2022 - 2032F |
6.3.7 Guyana Print Label Market Revenues & Volume, By Industrial, 2022 - 2032F |
6.3.8 Guyana Print Label Market Revenues & Volume, By Other, 2022 - 2032F |
6.3.9 Guyana Print Label Market Revenues & Volume, By Other, 2022 - 2032F |
7 Guyana Print Label Market Import-Export Trade Statistics |
7.1 Guyana Print Label Market Export to Major Countries |
7.2 Guyana Print Label Market Imports from Major Countries |
8 Guyana Print Label Market Key Performance Indicators |
8.1 Percentage increase in demand for specialized label printing solutions. |
8.2 Adoption rate of advanced printing technologies within the Guyana print label market. |
8.3 Percentage of local sourcing of raw materials for label production. |
8.4 Efficiency and utilization rate of printing infrastructure and technologies. |
8.5 Customer satisfaction index with the quality and customization of printed labels. |
9 Guyana Print Label Market - Opportunity Assessment |
9.1 Guyana Print Label Market Opportunity Assessment, By Print Process, 2022 & 2032F |
9.2 Guyana Print Label Market Opportunity Assessment, By Label Format, 2022 & 2032F |
9.3 Guyana Print Label Market Opportunity Assessment, By End-User, 2022 & 2032F |
10 Guyana Print Label Market - Competitive Landscape |
10.1 Guyana Print Label Market Revenue Share, By Companies, 2025 |
10.2 Guyana Print Label Market Competitive Benchmarking, By Operating and Technical Parameters |
11 Company Profiles |
12 Recommendations | 13 Disclaimer |
Global Go To Market Strategy - 2030
Export potential enables firms to identify high-growth global markets with greater confidence by combining advanced trade intelligence with a structured quantitative methodology. The framework analyzes emerging demand trends and country-level import patterns while integrating macroeconomic and trade datasets such as GDP and population forecasts, bilateral import–export flows, tariff structures, elasticity differentials between developed and developing economies, geographic distance, and import demand projections. Using weighted trade values from 2020–2024 as the base period to project country-to-country export potential for 2030, these inputs are operationalized through calculated drivers such as gravity model parameters, tariff impact factors, and projected GDP per-capita growth. Through an analysis of hidden potentials, demand hotspots, and market conditions that are most favorable to success, this method enables firms to focus on target countries, maximize returns, and global expansion with data, backed by accuracy.
By factoring in the projected importer demand gap that is currently unmet and could be potential opportunity, it identifies the potential for the Exporter (Country) among 190 countries, against the general trade analysis, which identifies the biggest importer or exporter.
To discover high-growth global markets and optimize your business strategy:
Click Here
Pricing
- Single User License$ 1,995
- Department License$ 2,400
- Site License$ 3,120
- Global License$ 3,795

Leadership Perspectives from Industry Events
Search
Thought Leadership and Analyst Meet


Our Clients
6WResearch In News
- Doha a strategic location for EV manufacturing hub: IPA Qatar
- Demand for luxury TVs surging in the GCC, says Samsung
- Empowering Growth: The Thriving Journey of Bangladesh’s Cable Industry
- Demand for luxury TVs surging in the GCC, says Samsung
- Video call with a traditional healer? Once unthinkable, it’s now common in South Africa
- Intelligent Buildings To Smooth GCC’s Path To Net Zero
Latest Reports
- Taiwan Airport Wireless Infrastructure Market (2026-2032)
- Vietnam Airport Wireless Infrastructure Market (2026-2032)
- Thailand Airport Wireless Infrastructure Market (2026-2032)
- South Korea Airport Wireless Infrastructure Market (2026-2032)
- Romania Airport Wireless Infrastructure Market (2026-2032)
- Qatar Airport Wireless Infrastructure Market (2026-2032)
- Philippines Airport Wireless Infrastructure Market (2026-2032)
- Japan Airport Wireless Infrastructure Market (2026-2032)
- Taiwan Airport Winter Services Market (2026-2032)
- Vietnam Airport Winter Services Market (2026-2032)
Industry Events and Analyst Meet

HIMTEX 2026

India Refining Summit 2026

India EV Show 2026

EV tech India Expo 2026

Auto Tech Asia 2026
Whitepaper
- Middle East & Africa Commercial Security Market Click here to view more.
- Middle East & Africa Fire Safety Systems & Equipment Market Click here to view more.
- GCC Drone Market Click here to view more.
- Middle East Lighting Fixture Market Click here to view more.
- GCC Physical & Perimeter Security Market Click here to view more.