Guyana Propionic acid Market (2025-2031) | Size, Forecast, Value, Industry, Growth, Trends, Outlook, Segmentation, Companies, Analysis, Revenue & Share
Market Forecast By Application (Herbicides, Rubber Products, Plasticizers, Food Preservatives, Others), By End use Industry (Pharmaceuticals, Personal Care, Food & Beverage, Agriculture, Others) And Competitive Landscape
| Product Code: ETC4746279 | Publication Date: Nov 2023 | Updated Date: Nov 2025 | Product Type: Market Research Report | |
| Publisher: 6Wresearch | Author: Sachin Kumar Rai | No. of Pages: 60 | No. of Figures: 30 | No. of Tables: 5 |
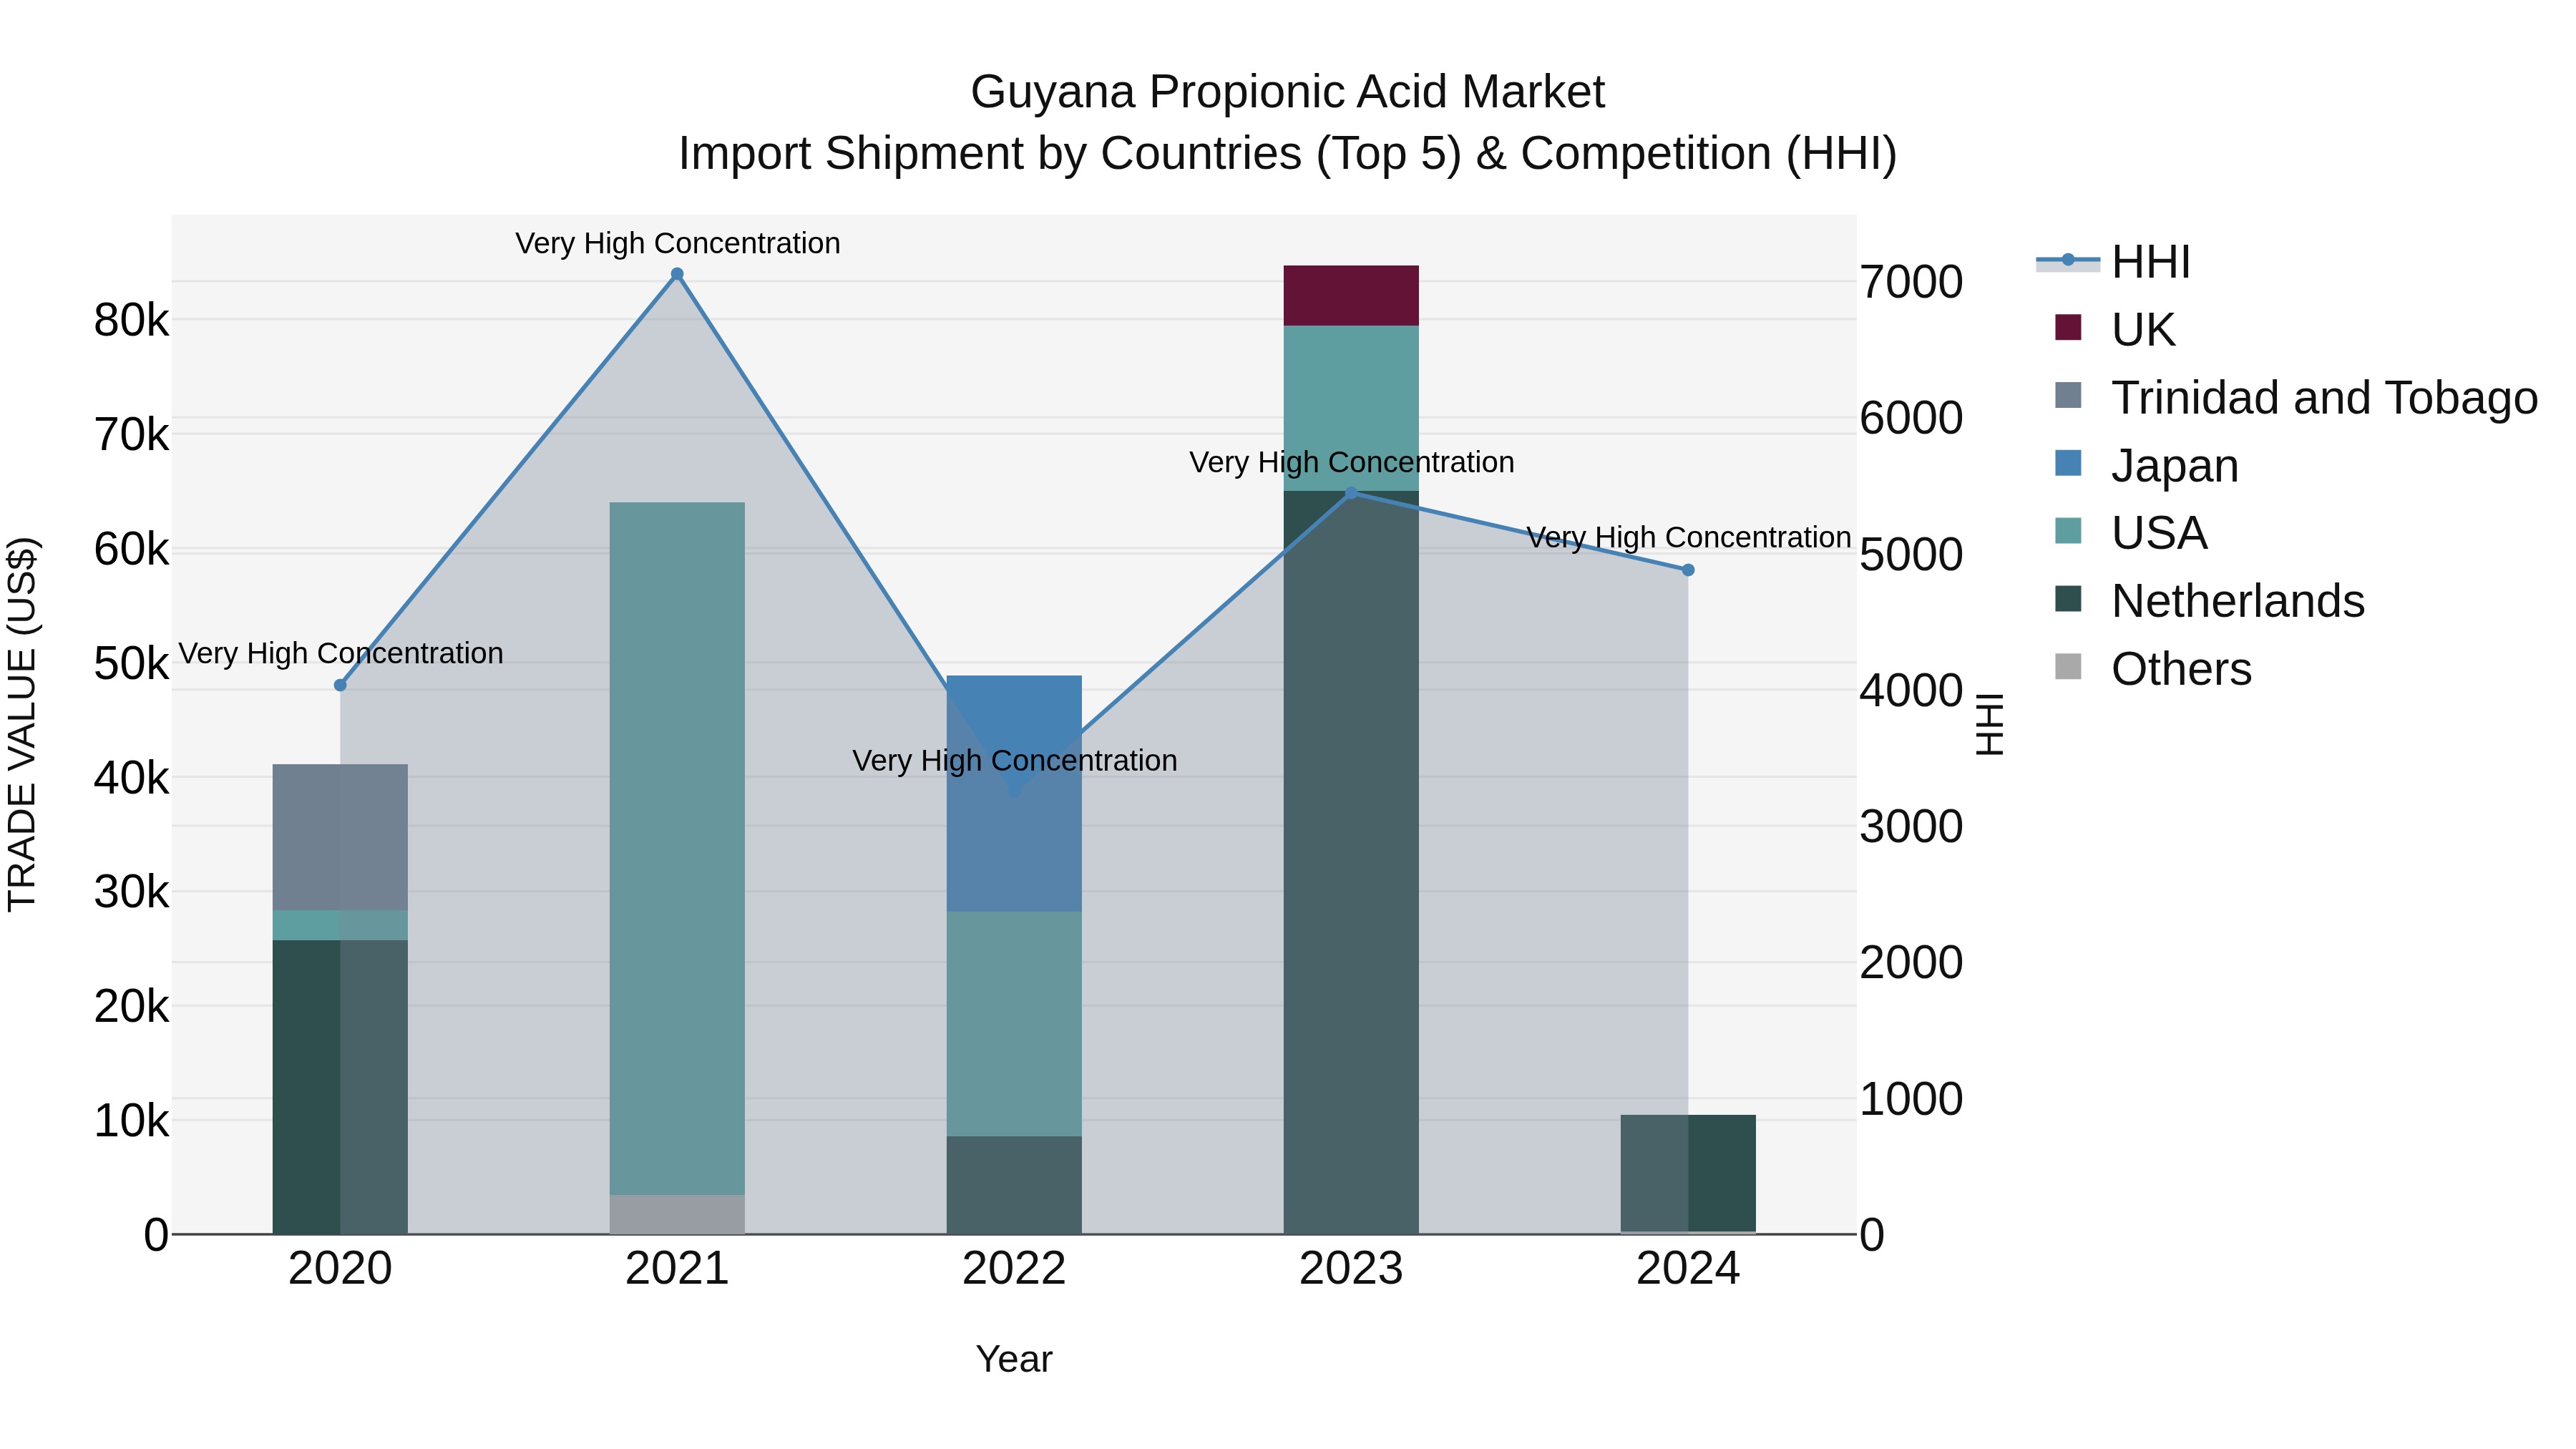
Guyana Propionic Acid Market Top 5 Importing Countries and Market Competition (HHI) Analysis
Guyana`s propionic acid import market in 2024 continued to be dominated by a select few countries, with the Netherlands, India, Japan, Trinidad and Tobago, and the UK leading the pack. The high concentration of the Herfindahl-Hirschman Index (HHI) indicates a significant level of market control by these top exporting countries. The compound annual growth rate (CAGR) from 2020 to 2024 saw a sharp decline of -28.97%, while the growth rate from 2023 to 2024 plummeted even further to -87.65%, suggesting a challenging environment for propionic acid imports in Guyana.
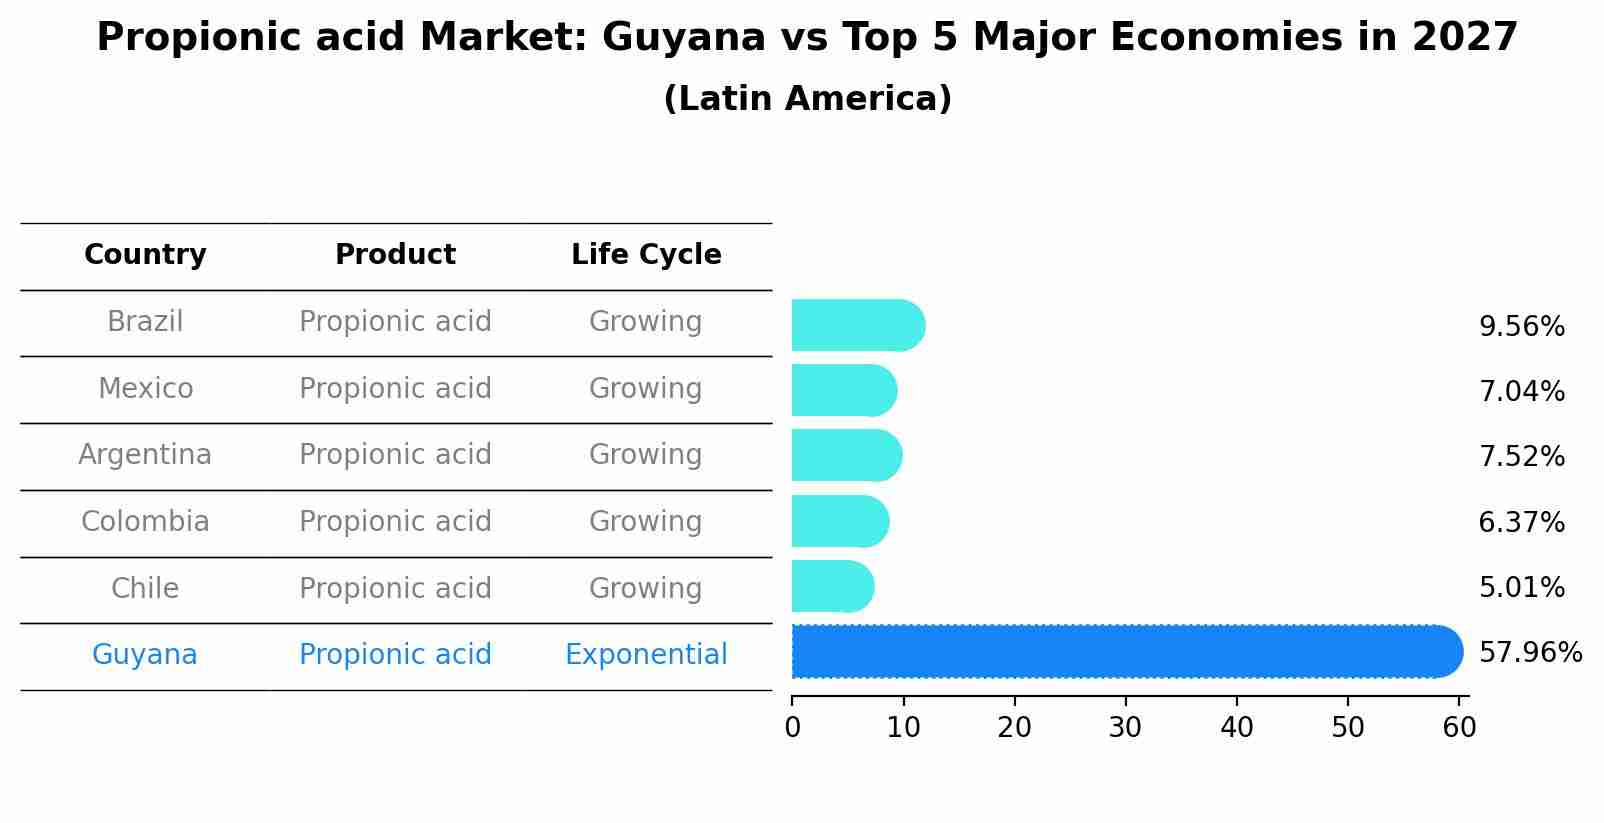
Propionic acid Market: Guyana vs Top 5 Major Economies in 2027 (Latin America)
The Propionic acid market in Guyana is projected to grow at a exponential growth rate of 57.96% by 2027, within the Latin America region led by Brazil, along with other countries like Mexico, Argentina, Colombia and Chile, collectively shaping a dynamic and evolving market environment driven by innovation and increasing adoption of emerging technologies.
Guyana Propionic acid Market Overview
The propionic acid market in Guyana is growing as the demand for preservatives in the food industry rises. Propionic acid, known for its ability to inhibit mold and bacteria growth, is widely used as a food preservative, especially in bakery products, dairy, and animal feed. As the food processing industry in Guyana continues to develop, the need for effective preservation techniques is driving the demand for propionic acid. Additionally, propionic acid is also used in the production of herbicides and plasticizers, contributing to its market growth in multiple industrial sectors.
Drivers of the market
The propionic acid market in Guyana is fueled by its applications in food preservation, animal feed, and chemical manufacturing. The increasing demand for safe and effective preservatives supports market growth.
Challenges of the market
The propionic acid market in Guyana encounters challenges from limited industrial applications and low awareness of its benefits in food preservation and other sectors. High import costs also impact the market negatively.
Government Policy of the market
The propionic acid market is supported by agricultural and food safety regulations. Policies promoting local production and sustainable preservation methods foster market growth.
Key Highlights of the Report:
- Guyana Propionic acid Market Outlook
- Market Size of Guyana Propionic acid Market, 2024
- Forecast of Guyana Propionic acid Market, 2031
- Historical Data and Forecast of Guyana Propionic acid Revenues & Volume for the Period 2021-2031
- Guyana Propionic acid Market Trend Evolution
- Guyana Propionic acid Market Drivers and Challenges
- Guyana Propionic acid Price Trends
- Guyana Propionic acid Porter`s Five Forces
- Guyana Propionic acid Industry Life Cycle
- Historical Data and Forecast of Guyana Propionic acid Market Revenues & Volume By Application for the Period 2021-2031
- Historical Data and Forecast of Guyana Propionic acid Market Revenues & Volume By Herbicides for the Period 2021-2031
- Historical Data and Forecast of Guyana Propionic acid Market Revenues & Volume By Rubber Products for the Period 2021-2031
- Historical Data and Forecast of Guyana Propionic acid Market Revenues & Volume By Plasticizers for the Period 2021-2031
- Historical Data and Forecast of Guyana Propionic acid Market Revenues & Volume By Food Preservatives for the Period 2021-2031
- Historical Data and Forecast of Guyana Propionic acid Market Revenues & Volume By Others for the Period 2021-2031
- Historical Data and Forecast of Guyana Propionic acid Market Revenues & Volume By End use Industry for the Period 2021-2031
- Historical Data and Forecast of Guyana Propionic acid Market Revenues & Volume By Pharmaceuticals for the Period 2021-2031
- Historical Data and Forecast of Guyana Propionic acid Market Revenues & Volume By Personal Care for the Period 2021-2031
- Historical Data and Forecast of Guyana Propionic acid Market Revenues & Volume By Food & Beverage for the Period 2021-2031
- Historical Data and Forecast of Guyana Propionic acid Market Revenues & Volume By Agriculture for the Period 2021-2031
- Historical Data and Forecast of Guyana Propionic acid Market Revenues & Volume By Others for the Period 2021-2031
- Guyana Propionic acid Import Export Trade Statistics
- Market Opportunity Assessment By Application
- Market Opportunity Assessment By End use Industry
- Guyana Propionic acid Top Companies Market Share
- Guyana Propionic acid Competitive Benchmarking By Technical and Operational Parameters
- Guyana Propionic acid Company Profiles
- Guyana Propionic acid Key Strategic Recommendations
Frequently Asked Questions About the Market Study (FAQs):
6Wresearch actively monitors the Guyana Propionic acid Market and publishes its comprehensive annual report, highlighting emerging trends, growth drivers, revenue analysis, and forecast outlook. Our insights help businesses to make data-backed strategic decisions with ongoing market dynamics. Our analysts track relevent industries related to the Guyana Propionic acid Market, allowing our clients with actionable intelligence and reliable forecasts tailored to emerging regional needs.
Yes, we provide customisation as per your requirements. To learn more, feel free to contact us on sales@6wresearch.com
1 Executive Summary |
2 Introduction |
2.1 Key Highlights of the Report |
2.2 Report Description |
2.3 Market Scope & Segmentation |
2.4 Research Methodology |
2.5 Assumptions |
3 Guyana Propionic acid Market Overview |
3.1 Guyana Country Macro Economic Indicators |
3.2 Guyana Propionic acid Market Revenues & Volume, 2021 & 2031F |
3.3 Guyana Propionic acid Market - Industry Life Cycle |
3.4 Guyana Propionic acid Market - Porter's Five Forces |
3.5 Guyana Propionic acid Market Revenues & Volume Share, By Application, 2021 & 2031F |
3.6 Guyana Propionic acid Market Revenues & Volume Share, By End use Industry, 2021 & 2031F |
4 Guyana Propionic acid Market Dynamics |
4.1 Impact Analysis |
4.2 Market Drivers |
4.2.1 Growing demand for food preservatives and animal feed additives |
4.2.2 Increasing awareness about the benefits of propionic acid in agriculture |
4.2.3 Rise in livestock production and food processing industries in Guyana |
4.3 Market Restraints |
4.3.1 Fluctuating prices of raw materials used in propionic acid production |
4.3.2 Stringent regulations related to the use of propionic acid in food and feed applications |
5 Guyana Propionic acid Market Trends |
6 Guyana Propionic acid Market Segmentations |
6.1 Guyana Propionic acid Market, By Application |
6.1.1 Overview and Analysis |
6.1.2 Guyana Propionic acid Market Revenues & Volume, By Herbicides, 2021-2031F |
6.1.3 Guyana Propionic acid Market Revenues & Volume, By Rubber Products, 2021-2031F |
6.1.4 Guyana Propionic acid Market Revenues & Volume, By Plasticizers, 2021-2031F |
6.1.5 Guyana Propionic acid Market Revenues & Volume, By Food Preservatives, 2021-2031F |
6.1.6 Guyana Propionic acid Market Revenues & Volume, By Others, 2021-2031F |
6.2 Guyana Propionic acid Market, By End use Industry |
6.2.1 Overview and Analysis |
6.2.2 Guyana Propionic acid Market Revenues & Volume, By Pharmaceuticals, 2021-2031F |
6.2.3 Guyana Propionic acid Market Revenues & Volume, By Personal Care, 2021-2031F |
6.2.4 Guyana Propionic acid Market Revenues & Volume, By Food & Beverage, 2021-2031F |
6.2.5 Guyana Propionic acid Market Revenues & Volume, By Agriculture, 2021-2031F |
6.2.6 Guyana Propionic acid Market Revenues & Volume, By Others, 2021-2031F |
7 Guyana Propionic acid Market Import-Export Trade Statistics |
7.1 Guyana Propionic acid Market Export to Major Countries |
7.2 Guyana Propionic acid Market Imports from Major Countries |
8 Guyana Propionic acid Market Key Performance Indicators |
8.1 Proportion of propionic acid usage in food preservation and animal feed additives |
8.2 Number of new product launches containing propionic acid |
8.3 Percentage change in livestock production and food processing industries in Guyana |
9 Guyana Propionic acid Market - Opportunity Assessment |
9.1 Guyana Propionic acid Market Opportunity Assessment, By Application, 2021 & 2031F |
9.2 Guyana Propionic acid Market Opportunity Assessment, By End use Industry, 2021 & 2031F |
10 Guyana Propionic acid Market - Competitive Landscape |
10.1 Guyana Propionic acid Market Revenue Share, By Companies, 2024 |
10.2 Guyana Propionic acid Market Competitive Benchmarking, By Operating and Technical Parameters |
11 Company Profiles |
12 Recommendations | 13 Disclaimer |
Export potential assessment - trade Analytics for 2030
Export potential enables firms to identify high-growth global markets with greater confidence by combining advanced trade intelligence with a structured quantitative methodology. The framework analyzes emerging demand trends and country-level import patterns while integrating macroeconomic and trade datasets such as GDP and population forecasts, bilateral import–export flows, tariff structures, elasticity differentials between developed and developing economies, geographic distance, and import demand projections. Using weighted trade values from 2020–2024 as the base period to project country-to-country export potential for 2030, these inputs are operationalized through calculated drivers such as gravity model parameters, tariff impact factors, and projected GDP per-capita growth. Through an analysis of hidden potentials, demand hotspots, and market conditions that are most favorable to success, this method enables firms to focus on target countries, maximize returns, and global expansion with data, backed by accuracy.
By factoring in the projected importer demand gap that is currently unmet and could be potential opportunity, it identifies the potential for the Exporter (Country) among 190 countries, against the general trade analysis, which identifies the biggest importer or exporter.
To discover high-growth global markets and optimize your business strategy:
Click Here
Pricing
- Single User License$ 1,995
- Department License$ 2,400
- Site License$ 3,120
- Global License$ 3,795

Search
Thought Leadership and Analyst Meet


Our Clients
Latest Reports
- Philippines Polyhydroxybutyrate-co-Hydroxyvalerate Market (2026-2032) | Trends, Insights, Challenges, Restraints, Competition, Size, Value, Forecast, Pricing, Share, Outlook, Revenue, Investment Opportunities, Strategy, Drivers, Demand, Growth, segmentation, Analysis, Companies
- Peru Polyhydroxybutyrate-co-Hydroxyvalerate Market (2026-2032) | Growth, Demand, Challenges, Share, Trends, Analysis, Pricing, Investment Opportunities, Drivers, Value, Forecast, Competition, Size, Companies, Insights, Outlook, Restraints, segmentation, Revenue, Strategy
- Pakistan Polyhydroxybutyrate-co-Hydroxyvalerate Market (2026-2032) | Restraints, segmentation, Pricing, Forecast, Share, Strategy, Competition, Trends, Insights, Drivers, Challenges, Growth, Revenue, Outlook, Value, Investment Opportunities, Companies, Size, Analysis, Demand
- Oman Polyhydroxybutyrate-co-Hydroxyvalerate Market (2026-2032) | Drivers, segmentation, Insights, Competition, Pricing, Outlook, Size, Revenue, Challenges, Forecast, Analysis, Growth, Value, Share, Trends, Investment Opportunities, Strategy, Restraints, Companies, Demand
- Nigeria Polyhydroxybutyrate-co-Hydroxyvalerate Market (2026-2032) | Value, Investment Opportunities, Analysis, Revenue, Restraints, Pricing, Outlook, Competition, Demand, Growth, Forecast, Companies, Trends, Challenges, segmentation, Drivers, Insights, Share, Size, Strategy
- Nepal Polyhydroxybutyrate-co-Hydroxyvalerate Market (2026-2032) | Insights, Analysis, Drivers, Share, Revenue, Demand, segmentation, Investment Opportunities, Competition, Forecast, Growth, Pricing, Companies, Strategy, Trends, Restraints, Challenges, Outlook, Size, Value
- Myanmar Polyhydroxybutyrate-co-Hydroxyvalerate Market (2026-2032) | Outlook, Revenue, Strategy, Restraints, Drivers, segmentation, Share, Forecast, Competition, Insights, Growth, Pricing, Size, Demand, Value, Companies, Trends, Challenges, Investment Opportunities, Analysis
- Morocco Polyhydroxybutyrate-co-Hydroxyvalerate Market (2026-2032) | Outlook, Investment Opportunities, Restraints, Strategy, Forecast, Challenges, Drivers, Growth, Companies, segmentation, Trends, Size, Competition, Revenue, Demand, Insights, Share, Analysis, Value, Pricing
- Mexico Polyhydroxybutyrate-co-Hydroxyvalerate Market (2026-2032) | Size, Drivers, Outlook, Share, Strategy, Growth, Pricing, Challenges, Companies, Demand, Value, Investment Opportunities, Restraints, Trends, Forecast, segmentation, Analysis, Insights, Competition, Revenue
- Malaysia Polyhydroxybutyrate-co-Hydroxyvalerate Market (2026-2032) | Share, segmentation, Size, Companies, Analysis, Insights, Forecast, Value, Revenue, Drivers, Restraints, Challenges, Investment Opportunities, Trends, Competition, Strategy, Demand, Growth, Outlook, Pricing
Industry Events and Analyst Meet

HIMTEX 2026

India Refining Summit 2026

India EV Show 2026

EV tech India Expo 2026

Auto Tech Asia 2026
Whitepaper
- Middle East & Africa Commercial Security Market Click here to view more.
- Middle East & Africa Fire Safety Systems & Equipment Market Click here to view more.
- GCC Drone Market Click here to view more.
- Middle East Lighting Fixture Market Click here to view more.
- GCC Physical & Perimeter Security Market Click here to view more.
6WResearch In News
- Doha a strategic location for EV manufacturing hub: IPA Qatar
- Demand for luxury TVs surging in the GCC, says Samsung
- Empowering Growth: The Thriving Journey of Bangladesh’s Cable Industry
- Demand for luxury TVs surging in the GCC, says Samsung
- Video call with a traditional healer? Once unthinkable, it’s now common in South Africa
- Intelligent Buildings To Smooth GCC’s Path To Net Zero