Hong Kong Bulb Market (2025-2031) | Analysis, Industry, Forecast, Share, Segmentation, Value, Trends, Size, Companies, Outlook, Growth & Revenue
Market Forecast By Type (Incandescent Bulbs, Fluorescent Bulbs, CFLs, Halogens, LEDs), By Application (Lamps & Light Bulbs, Operation Theatre (OT Instruments), Torchlights and Flashlights, Automobile Headlights, Mining Headgears, Others) And Competitive Landscape
| Product Code: ETC5110835 | Publication Date: Nov 2023 | Updated Date: Sep 2025 | Product Type: Market Research Report | |
| Publisher: 6Wresearch | Author: Sachin Kumar Rai | No. of Pages: 60 | No. of Figures: 30 | No. of Tables: 5 |
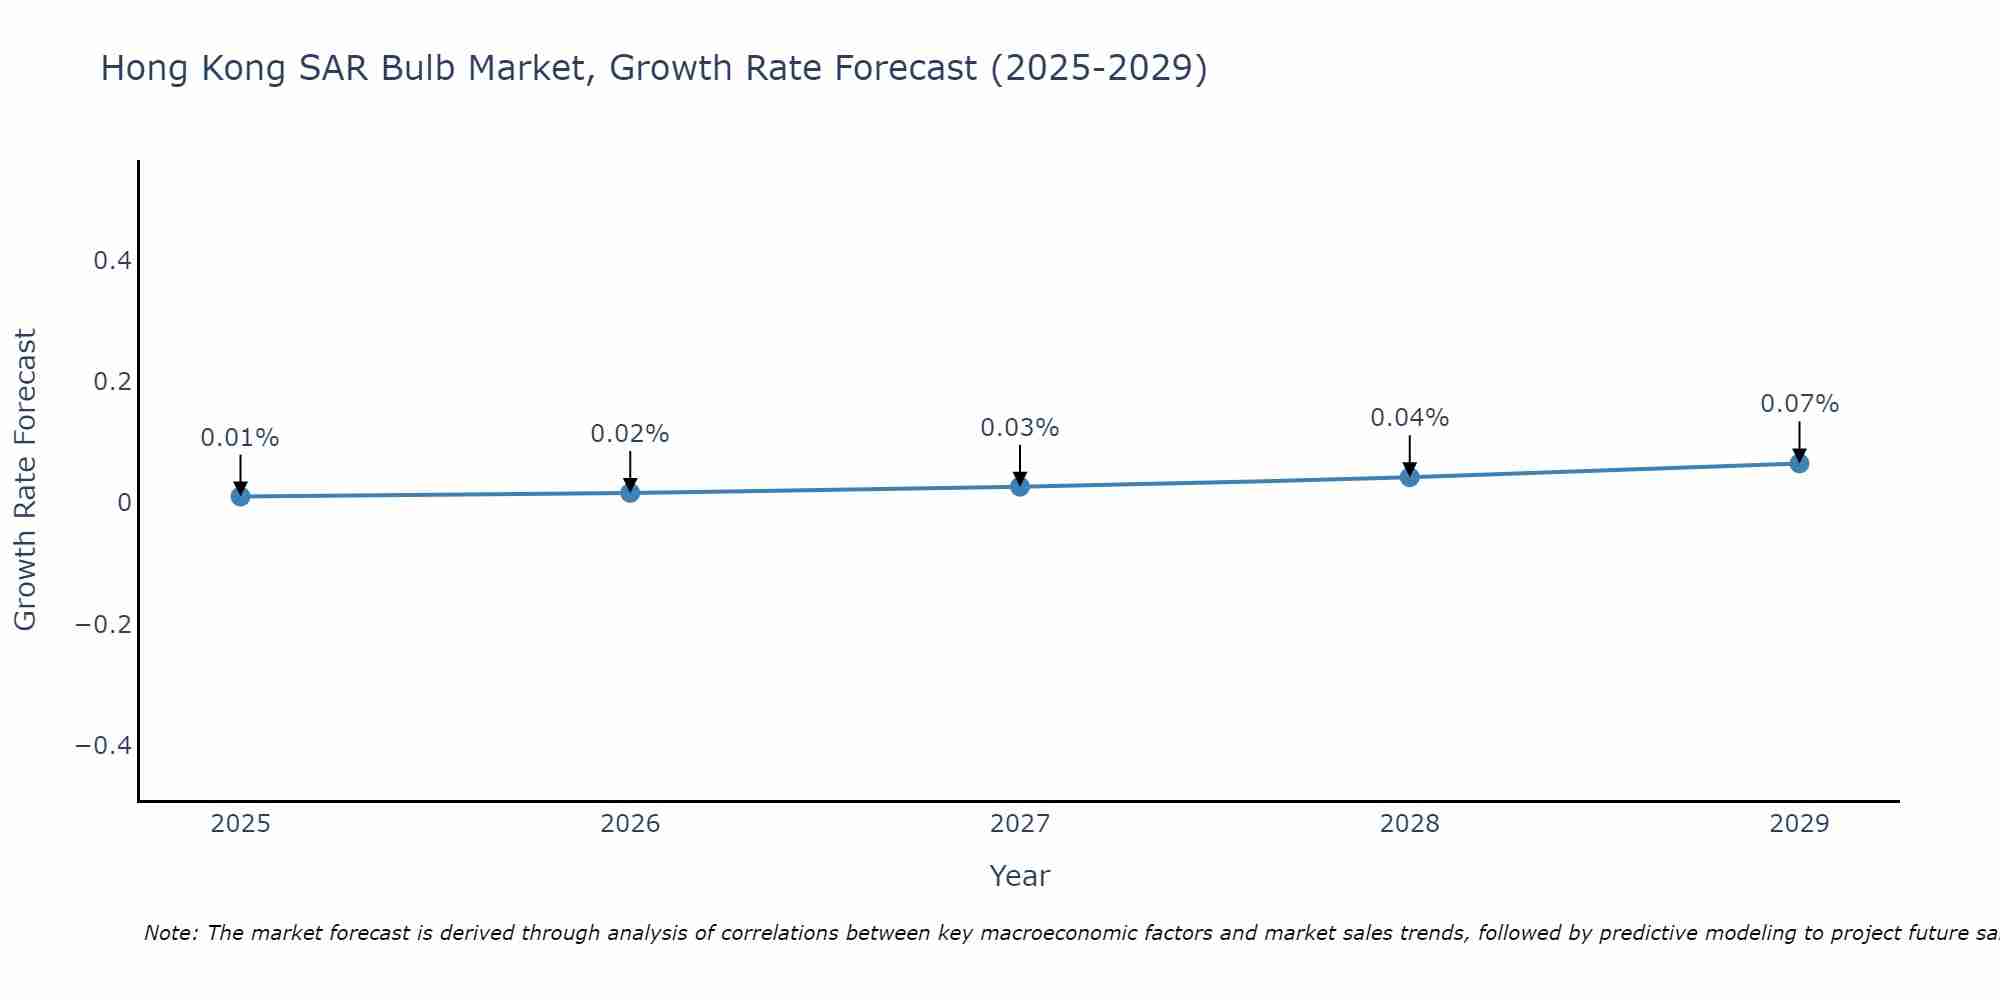
Hong Kong SAR Bulb Market Size Growth Rate
The Hong Kong SAR Bulb Market is likely to experience consistent growth rate gains over the period 2025 to 2029. From 0.01% in 2025, the growth rate steadily ascends to 0.07% in 2029.
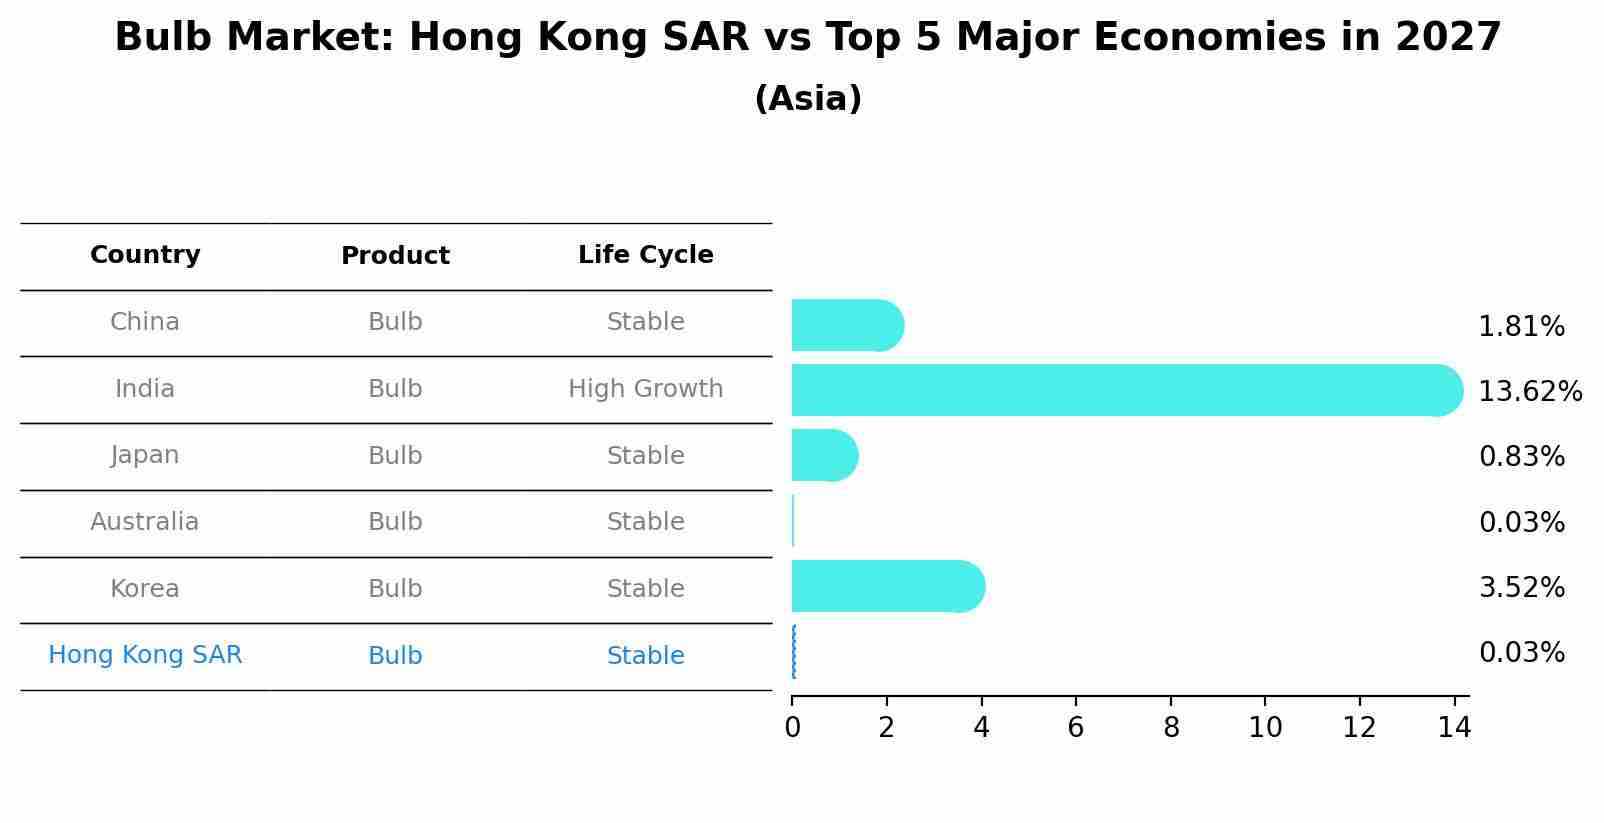
Bulb Market: Hong Kong SAR vs Top 5 Major Economies in 2027 (Asia)
Hong Kong SAR's Bulb market is anticipated to experience a stable growth rate of 0.03% by 2027, reflecting trends observed in the largest economy China, followed by India, Japan, Australia and South Korea.
Hong Kong Bulb Market Synopsis
The lighting market in Hong Kong is transitioning towards energy-efficient solutions, such as LED bulbs. The demand for environmentally friendly and cost-effective lighting options is propelling growth in this sector.
Drivers of the market
The bulb market in Hong Kong is driven by the growing demand for energy-efficient lighting solutions among consumers and businesses. As awareness of environmental issues and energy conservation rises, LED and other energy-efficient bulbs are becoming increasingly popular. The push for sustainable and cost-effective lighting options is propelling market growth, along with government initiatives promoting energy-saving technologies. Additionally, the rise of smart lighting solutions that offer enhanced control and automation features is further driving the demand for innovative bulb products.
Challenges of the market
The bulb market in Hong Kong is experiencing a decline due to the increasing adoption of energy-efficient LED lighting. Additionally, environmental regulations are pushing for the phase-out of traditional incandescent bulbs, further shrinking the market.
Government Policy of the market
In the bulb market, the Hong Kong government enforces regulations that prioritize energy efficiency and safety standards for lighting products. Policies promote the adoption of eco-friendly and energy-efficient lighting technologies to reduce electricity consumption. The government supports research and development initiatives aimed at improving bulb performance and sustainability. Additionally, regulatory frameworks ensure compliance with safety standards for various types of bulbs used in residential and commercial applications.
Key Highlights of the Report:
- Hong Kong Bulb Market Outlook
- Market Size of Hong Kong Bulb Market, 2024
- Forecast of Hong Kong Bulb Market, 2031
- Historical Data and Forecast of Hong Kong Bulb Revenues & Volume for the Period 2021-2031
- Hong Kong Bulb Market Trend Evolution
- Hong Kong Bulb Market Drivers and Challenges
- Hong Kong Bulb Price Trends
- Hong Kong Bulb Porter`s Five Forces
- Hong Kong Bulb Industry Life Cycle
- Historical Data and Forecast of Hong Kong Bulb Market Revenues & Volume By Type for the Period 2021-2031
- Historical Data and Forecast of Hong Kong Bulb Market Revenues & Volume By Incandescent Bulbs for the Period 2021-2031
- Historical Data and Forecast of Hong Kong Bulb Market Revenues & Volume By Fluorescent Bulbs for the Period 2021-2031
- Historical Data and Forecast of Hong Kong Bulb Market Revenues & Volume By CFLs for the Period 2021-2031
- Historical Data and Forecast of Hong Kong Bulb Market Revenues & Volume By Halogens for the Period 2021-2031
- Historical Data and Forecast of Hong Kong Bulb Market Revenues & Volume By LEDs for the Period 2021-2031
- Historical Data and Forecast of Hong Kong Bulb Market Revenues & Volume By Application for the Period 2021-2031
- Historical Data and Forecast of Hong Kong Bulb Market Revenues & Volume By Lamps & Light Bulbs for the Period 2021-2031
- Historical Data and Forecast of Hong Kong Bulb Market Revenues & Volume By Operation Theatre (OT Instruments) for the Period 2021-2031
- Historical Data and Forecast of Hong Kong Bulb Market Revenues & Volume By Torchlights and Flashlights for the Period 2021-2031
- Historical Data and Forecast of Hong Kong Bulb Market Revenues & Volume By Automobile Headlights for the Period 2021-2031
- Historical Data and Forecast of Hong Kong Bulb Market Revenues & Volume By Mining Headgears for the Period 2021-2031
- Historical Data and Forecast of Hong Kong Bulb Market Revenues & Volume By Others for the Period 2021-2031
- Hong Kong Bulb Import Export Trade Statistics
- Market Opportunity Assessment By Type
- Market Opportunity Assessment By Application
- Hong Kong Bulb Top Companies Market Share
- Hong Kong Bulb Competitive Benchmarking By Technical and Operational Parameters
- Hong Kong Bulb Company Profiles
- Hong Kong Bulb Key Strategic Recommendations
Frequently Asked Questions About the Market Study (FAQs):
6Wresearch actively monitors the Hong Kong Bulb Market and publishes its comprehensive annual report, highlighting emerging trends, growth drivers, revenue analysis, and forecast outlook. Our insights help businesses to make data-backed strategic decisions with ongoing market dynamics. Our analysts track relevent industries related to the Hong Kong Bulb Market, allowing our clients with actionable intelligence and reliable forecasts tailored to emerging regional needs.
Yes, we provide customisation as per your requirements. To learn more, feel free to contact us on sales@6wresearch.com
1 Executive Summary |
2 Introduction |
2.1 Key Highlights of the Report |
2.2 Report Description |
2.3 Market Scope & Segmentation |
2.4 Research Methodology |
2.5 Assumptions |
3 Hong Kong Bulb Market Overview |
3.1 Hong Kong Country Macro Economic Indicators |
3.2 Hong Kong Bulb Market Revenues & Volume, 2021 & 2031F |
3.3 Hong Kong Bulb Market - Industry Life Cycle |
3.4 Hong Kong Bulb Market - Porter's Five Forces |
3.5 Hong Kong Bulb Market Revenues & Volume Share, By Type, 2021 & 2031F |
3.6 Hong Kong Bulb Market Revenues & Volume Share, By Application, 2021 & 2031F |
4 Hong Kong Bulb Market Dynamics |
4.1 Impact Analysis |
4.2 Market Drivers |
4.2.1 Increasing awareness about energy efficiency and sustainability practices leading to a demand for energy-efficient bulbs. |
4.2.2 Growing urbanization and infrastructure development in Hong Kong leading to an increased need for lighting solutions. |
4.2.3 Technological advancements in the lighting industry leading to the development of innovative bulb products. |
4.3 Market Restraints |
4.3.1 High initial cost of energy-efficient bulbs compared to traditional incandescent bulbs. |
4.3.2 Competition from alternative lighting solutions such as LED strips or smart lighting systems. |
4.3.3 Regulatory challenges and standards compliance impacting the introduction of new bulb products in the market. |
5 Hong Kong Bulb Market Trends |
6 Hong Kong Bulb Market Segmentations |
6.1 Hong Kong Bulb Market, By Type |
6.1.1 Overview and Analysis |
6.1.2 Hong Kong Bulb Market Revenues & Volume, By Incandescent Bulbs, 2021-2031F |
6.1.3 Hong Kong Bulb Market Revenues & Volume, By Fluorescent Bulbs, 2021-2031F |
6.1.4 Hong Kong Bulb Market Revenues & Volume, By CFLs, 2021-2031F |
6.1.5 Hong Kong Bulb Market Revenues & Volume, By Halogens, 2021-2031F |
6.1.6 Hong Kong Bulb Market Revenues & Volume, By LEDs, 2021-2031F |
6.2 Hong Kong Bulb Market, By Application |
6.2.1 Overview and Analysis |
6.2.2 Hong Kong Bulb Market Revenues & Volume, By Lamps & Light Bulbs, 2021-2031F |
6.2.3 Hong Kong Bulb Market Revenues & Volume, By Operation Theatre (OT Instruments), 2021-2031F |
6.2.4 Hong Kong Bulb Market Revenues & Volume, By Torchlights and Flashlights, 2021-2031F |
6.2.5 Hong Kong Bulb Market Revenues & Volume, By Automobile Headlights, 2021-2031F |
6.2.6 Hong Kong Bulb Market Revenues & Volume, By Mining Headgears, 2021-2031F |
6.2.7 Hong Kong Bulb Market Revenues & Volume, By Others, 2021-2031F |
7 Hong Kong Bulb Market Import-Export Trade Statistics |
7.1 Hong Kong Bulb Market Export to Major Countries |
7.2 Hong Kong Bulb Market Imports from Major Countries |
8 Hong Kong Bulb Market Key Performance Indicators |
8.1 Energy savings achieved through the use of energy-efficient bulbs. |
8.2 Adoption rate of smart lighting solutions in residential and commercial sectors. |
8.3 Number of infrastructure projects in Hong Kong incorporating energy-efficient lighting solutions. |
8.4 Consumer sentiment towards sustainability and energy efficiency in lighting choices. |
8.5 Rate of innovation and new product development in the bulb market. |
9 Hong Kong Bulb Market - Opportunity Assessment |
9.1 Hong Kong Bulb Market Opportunity Assessment, By Type, 2021 & 2031F |
9.2 Hong Kong Bulb Market Opportunity Assessment, By Application, 2021 & 2031F |
10 Hong Kong Bulb Market - Competitive Landscape |
10.1 Hong Kong Bulb Market Revenue Share, By Companies, 2024 |
10.2 Hong Kong Bulb Market Competitive Benchmarking, By Operating and Technical Parameters |
11 Company Profiles |
12 Recommendations | 13 Disclaimer |
Export potential assessment - trade Analytics for 2030
Export potential enables firms to identify high-growth global markets with greater confidence by combining advanced trade intelligence with a structured quantitative methodology. The framework analyzes emerging demand trends and country-level import patterns while integrating macroeconomic and trade datasets such as GDP and population forecasts, bilateral import–export flows, tariff structures, elasticity differentials between developed and developing economies, geographic distance, and import demand projections. Using weighted trade values from 2020–2024 as the base period to project country-to-country export potential for 2030, these inputs are operationalized through calculated drivers such as gravity model parameters, tariff impact factors, and projected GDP per-capita growth. Through an analysis of hidden potentials, demand hotspots, and market conditions that are most favorable to success, this method enables firms to focus on target countries, maximize returns, and global expansion with data, backed by accuracy.
By factoring in the projected importer demand gap that is currently unmet and could be potential opportunity, it identifies the potential for the Exporter (Country) among 190 countries, against the general trade analysis, which identifies the biggest importer or exporter.
To discover high-growth global markets and optimize your business strategy:
Click Here
Pricing
- Single User License$ 1,995
- Department License$ 2,400
- Site License$ 3,120
- Global License$ 3,795

Search
Thought Leadership and Analyst Meet


Our Clients
Latest Reports
- France Thermally Conductive Filler Dispersants Market (2026-2032) | Challenges, Restraints, Value, Share, Size, segmentation, Analysis, Trends, Investment Opportunities, Outlook, Pricing, Demand, Forecast, Revenue, Companies, Growth, Drivers, Strategy, Insights, Competition
- Egypt Thermally Conductive Filler Dispersants Market (2026-2032) | Competition, Forecast, Strategy, Value, Insights, Outlook, Investment Opportunities, Pricing, Demand, Share, segmentation, Drivers, Size, Companies, Restraints, Growth, Trends, Revenue, Challenges, Analysis
- Czech Republic Thermally Conductive Filler Dispersants Market (2026-2032) | Forecast, Pricing, Analysis, Drivers, Insights, Size, Demand, Growth, Challenges, segmentation, Competition, Outlook, Trends, Investment Opportunities, Companies, Strategy, Revenue, Share, Value, Restraints
- Colombia Thermally Conductive Filler Dispersants Market (2026-2032) | segmentation, Trends, Share, Drivers, Strategy, Companies, Demand, Insights, Size, Challenges, Value, Competition, Analysis, Growth, Revenue, Restraints, Forecast, Pricing, Outlook, Investment Opportunities
- China Thermally Conductive Filler Dispersants Market (2026-2032) | Restraints, Investment Opportunities, Pricing, Companies, Share, Size, Challenges, Trends, Outlook, Value, Analysis, Competition, Revenue, Drivers, Forecast, Demand, Insights, Growth, Strategy, segmentation
- Chile Thermally Conductive Filler Dispersants Market (2026-2032) | Investment Opportunities, Trends, Value, Restraints, Share, Companies, Forecast, segmentation, Pricing, Challenges, Demand, Size, Analysis, Drivers, Outlook, Growth, Competition, Strategy, Revenue, Insights
- Cambodia Thermally Conductive Filler Dispersants Market (2026-2032) | Analysis, Share, Outlook, Strategy, Pricing, Demand, Size, Growth, segmentation, Insights, Revenue, Forecast, Challenges, Competition, Companies, Investment Opportunities, Trends, Restraints, Value, Drivers
- Brazil Thermally Conductive Filler Dispersants Market (2026-2032) | Restraints, Forecast, Competition, Size, Revenue, Value, Investment Opportunities, Trends, Insights, Outlook, Growth, Analysis, Drivers, segmentation, Pricing, Challenges, Strategy, Share, Companies, Demand
- Bangladesh Thermally Conductive Filler Dispersants Market (2026-2032) | Restraints, Trends, Analysis, Competition, Insights, Forecast, Value, Investment Opportunities, Pricing, Share, Demand, Outlook, Revenue, segmentation, Companies, Drivers, Growth, Size, Challenges, Strategy
- Bahrain Thermally Conductive Filler Dispersants Market (2026-2032) | Trends, Outlook, Pricing, Demand, Value, Competition, Forecast, Growth, segmentation, Revenue, Companies, Analysis, Insights, Size, Drivers, Challenges, Strategy, Investment Opportunities, Share, Restraints
Industry Events and Analyst Meet

HIMTEX 2026

India Refining Summit 2026

India EV Show 2026

EV tech India Expo 2026

Auto Tech Asia 2026
Whitepaper
- Middle East & Africa Commercial Security Market Click here to view more.
- Middle East & Africa Fire Safety Systems & Equipment Market Click here to view more.
- GCC Drone Market Click here to view more.
- Middle East Lighting Fixture Market Click here to view more.
- GCC Physical & Perimeter Security Market Click here to view more.
6WResearch In News
- Doha a strategic location for EV manufacturing hub: IPA Qatar
- Demand for luxury TVs surging in the GCC, says Samsung
- Empowering Growth: The Thriving Journey of Bangladesh’s Cable Industry
- Demand for luxury TVs surging in the GCC, says Samsung
- Video call with a traditional healer? Once unthinkable, it’s now common in South Africa
- Intelligent Buildings To Smooth GCC’s Path To Net Zero