Hungary Copper Kitchenware Market (2026-2032) Outlook | Forecast, Growth, Companies, Size, Value, Industry, Analysis, Revenue, Trends & Share
Market Forecast By Product (Copper Oven, Copper Skillet, Copper Saucepan, Others), By Application (Domestic Use, Commercial Use) And Competitive Landscape
| Product Code: ETC274279 | Publication Date: Aug 2022 | Updated Date: Apr 2026 | Product Type: Market Research Report | |
| Publisher: 6Wresearch | Author: Ravi Bhandari | No. of Pages: 75 | No. of Figures: 35 | No. of Tables: 20 |
Hungary Copper Kitchenware Market Size (2020-2030)
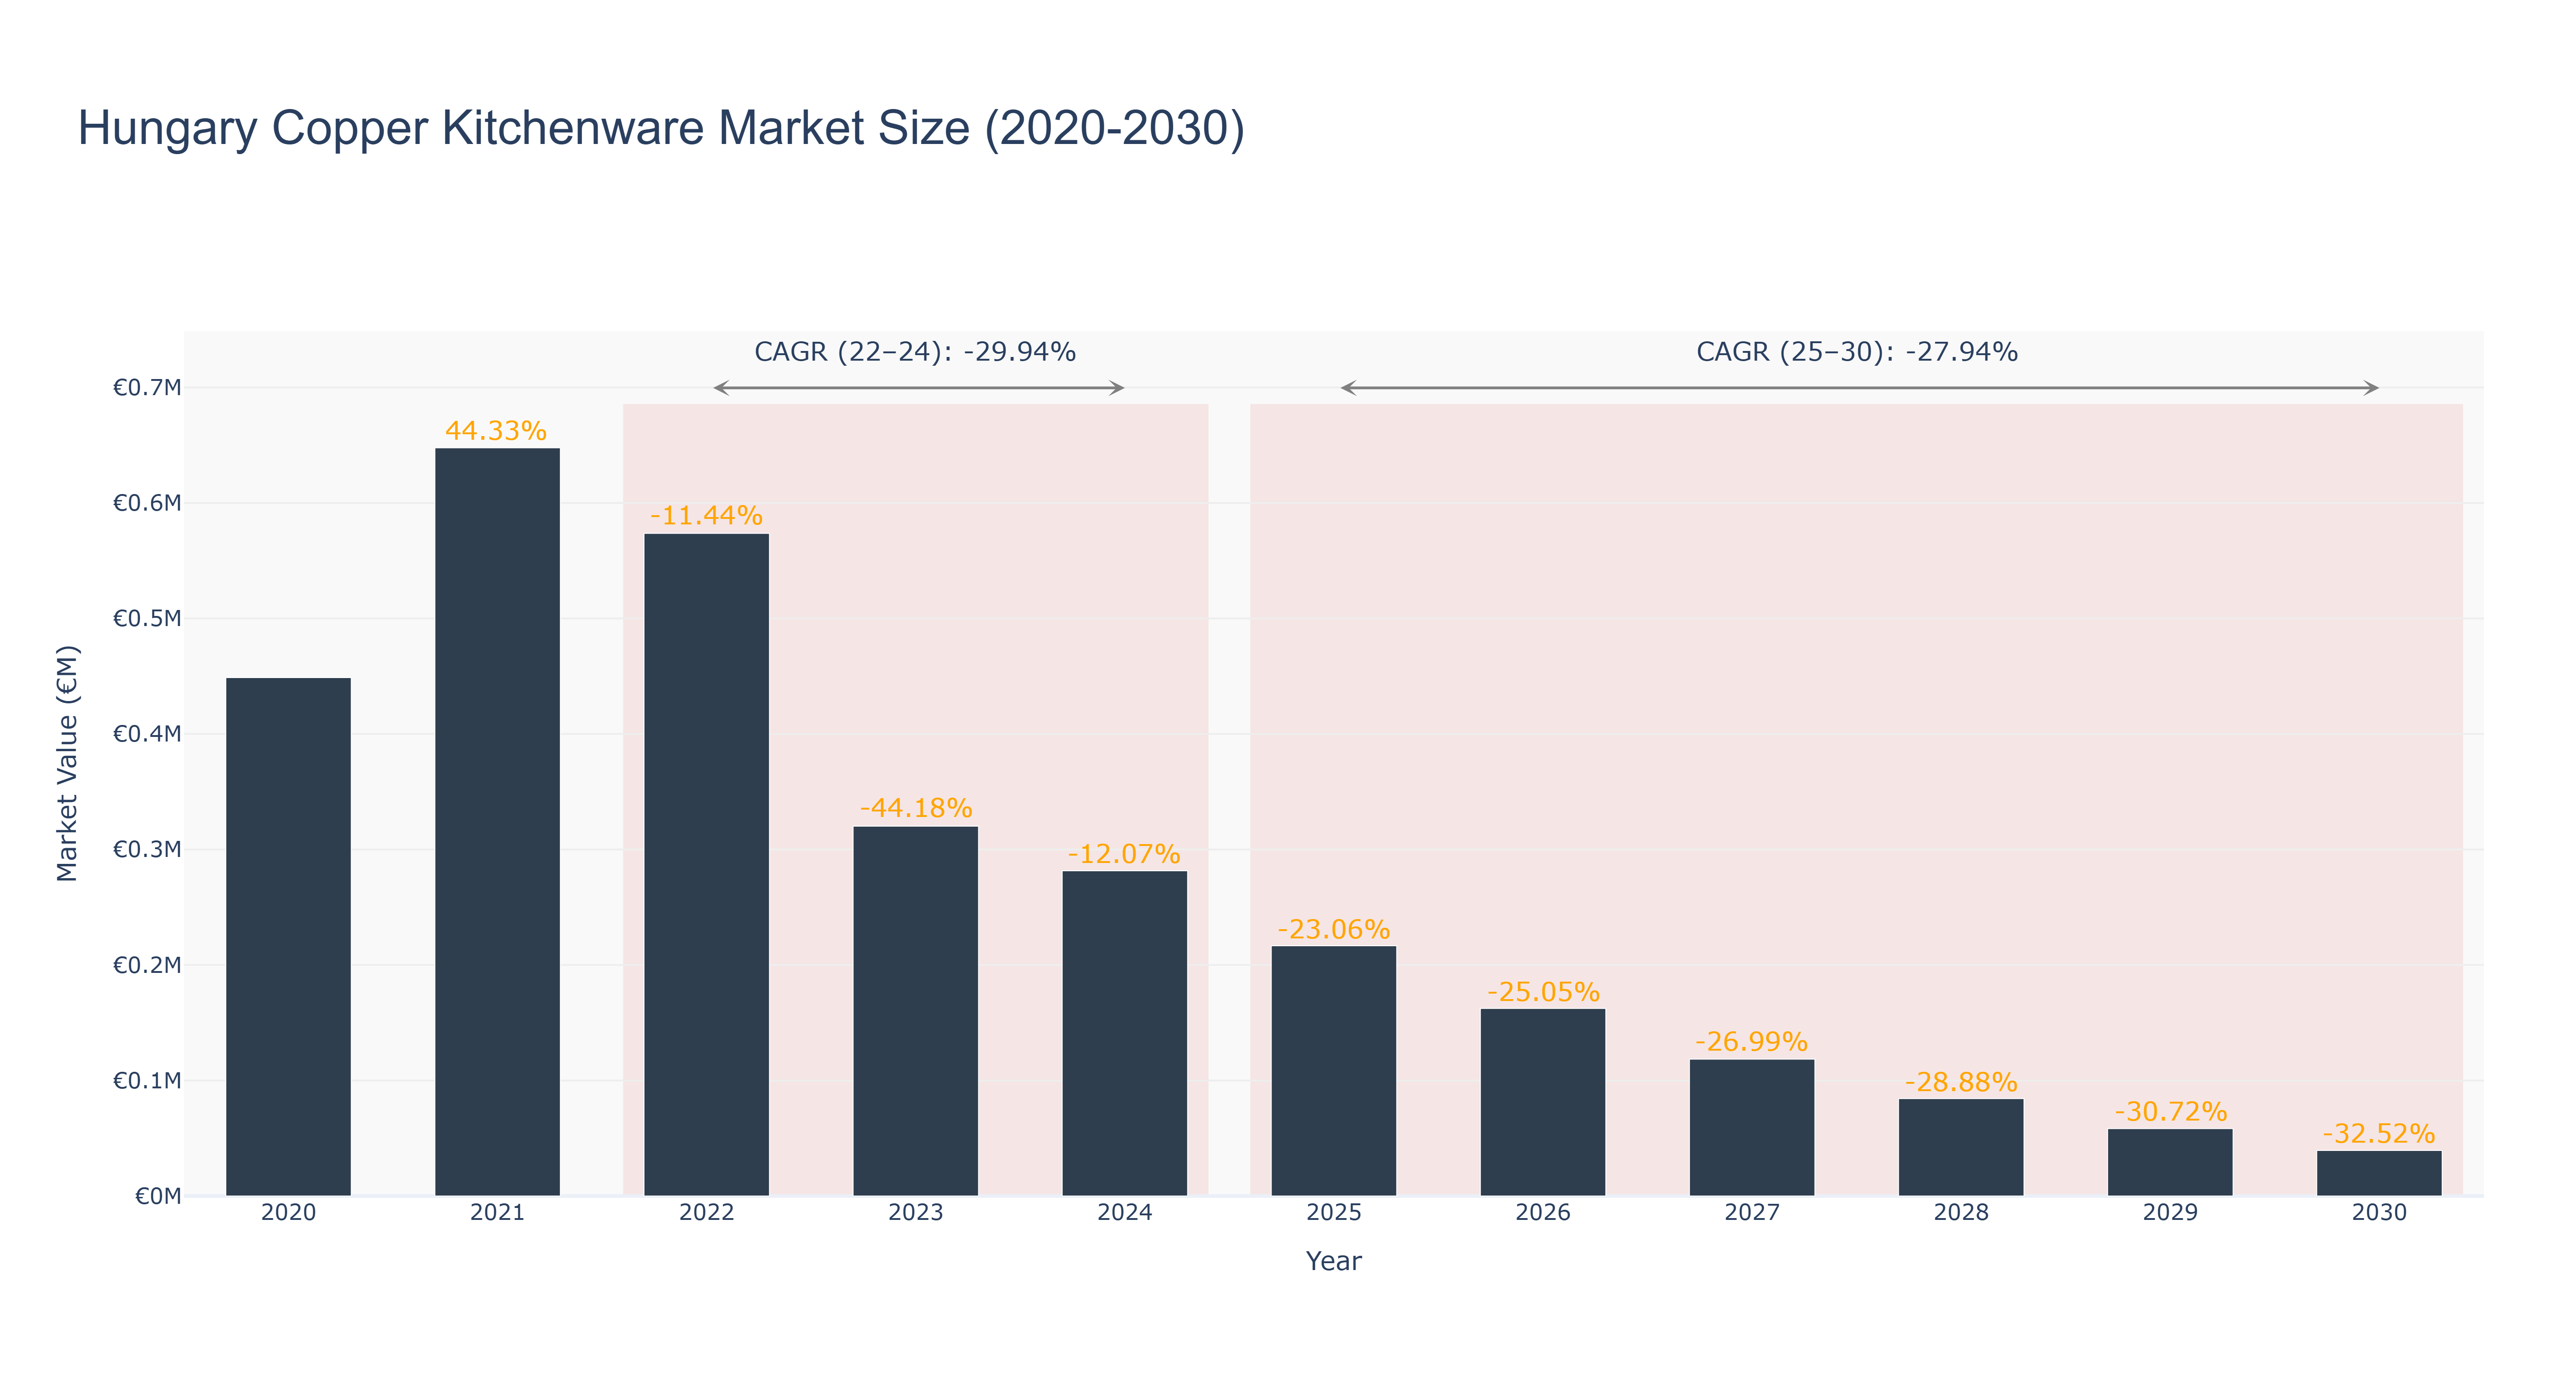
The Hungary Copper Kitchenware Market experienced a peak in 2021, with a market size of €647.77 thousand, followed by a significant decline in subsequent years, resulting in an actual market size of €320.20 thousand in 2023 and €281.54 thousand in 2024. This period (2022-2024) reflects a compound annual growth rate (CAGR) of -29.94%, driven by factors such as changing consumer preferences, economic uncertainties, and increased competition from alternative materials. Looking ahead, the forecasted period from 2025 to 2030 anticipates continued contraction, with projected market sizes decreasing from €216.61 thousand in 2025 to €39.40 thousand by 2030, resulting in a CAGR of -27.94%. The ongoing shift towards sustainability and cost-effective kitchenware solutions may further hinder the market's recovery, highlighting the need for innovation and adaptation in product offerings to engage the evolving consumer base.
Hungary Copper Kitchenware Market: Production & Trade Performance (2019-2025)
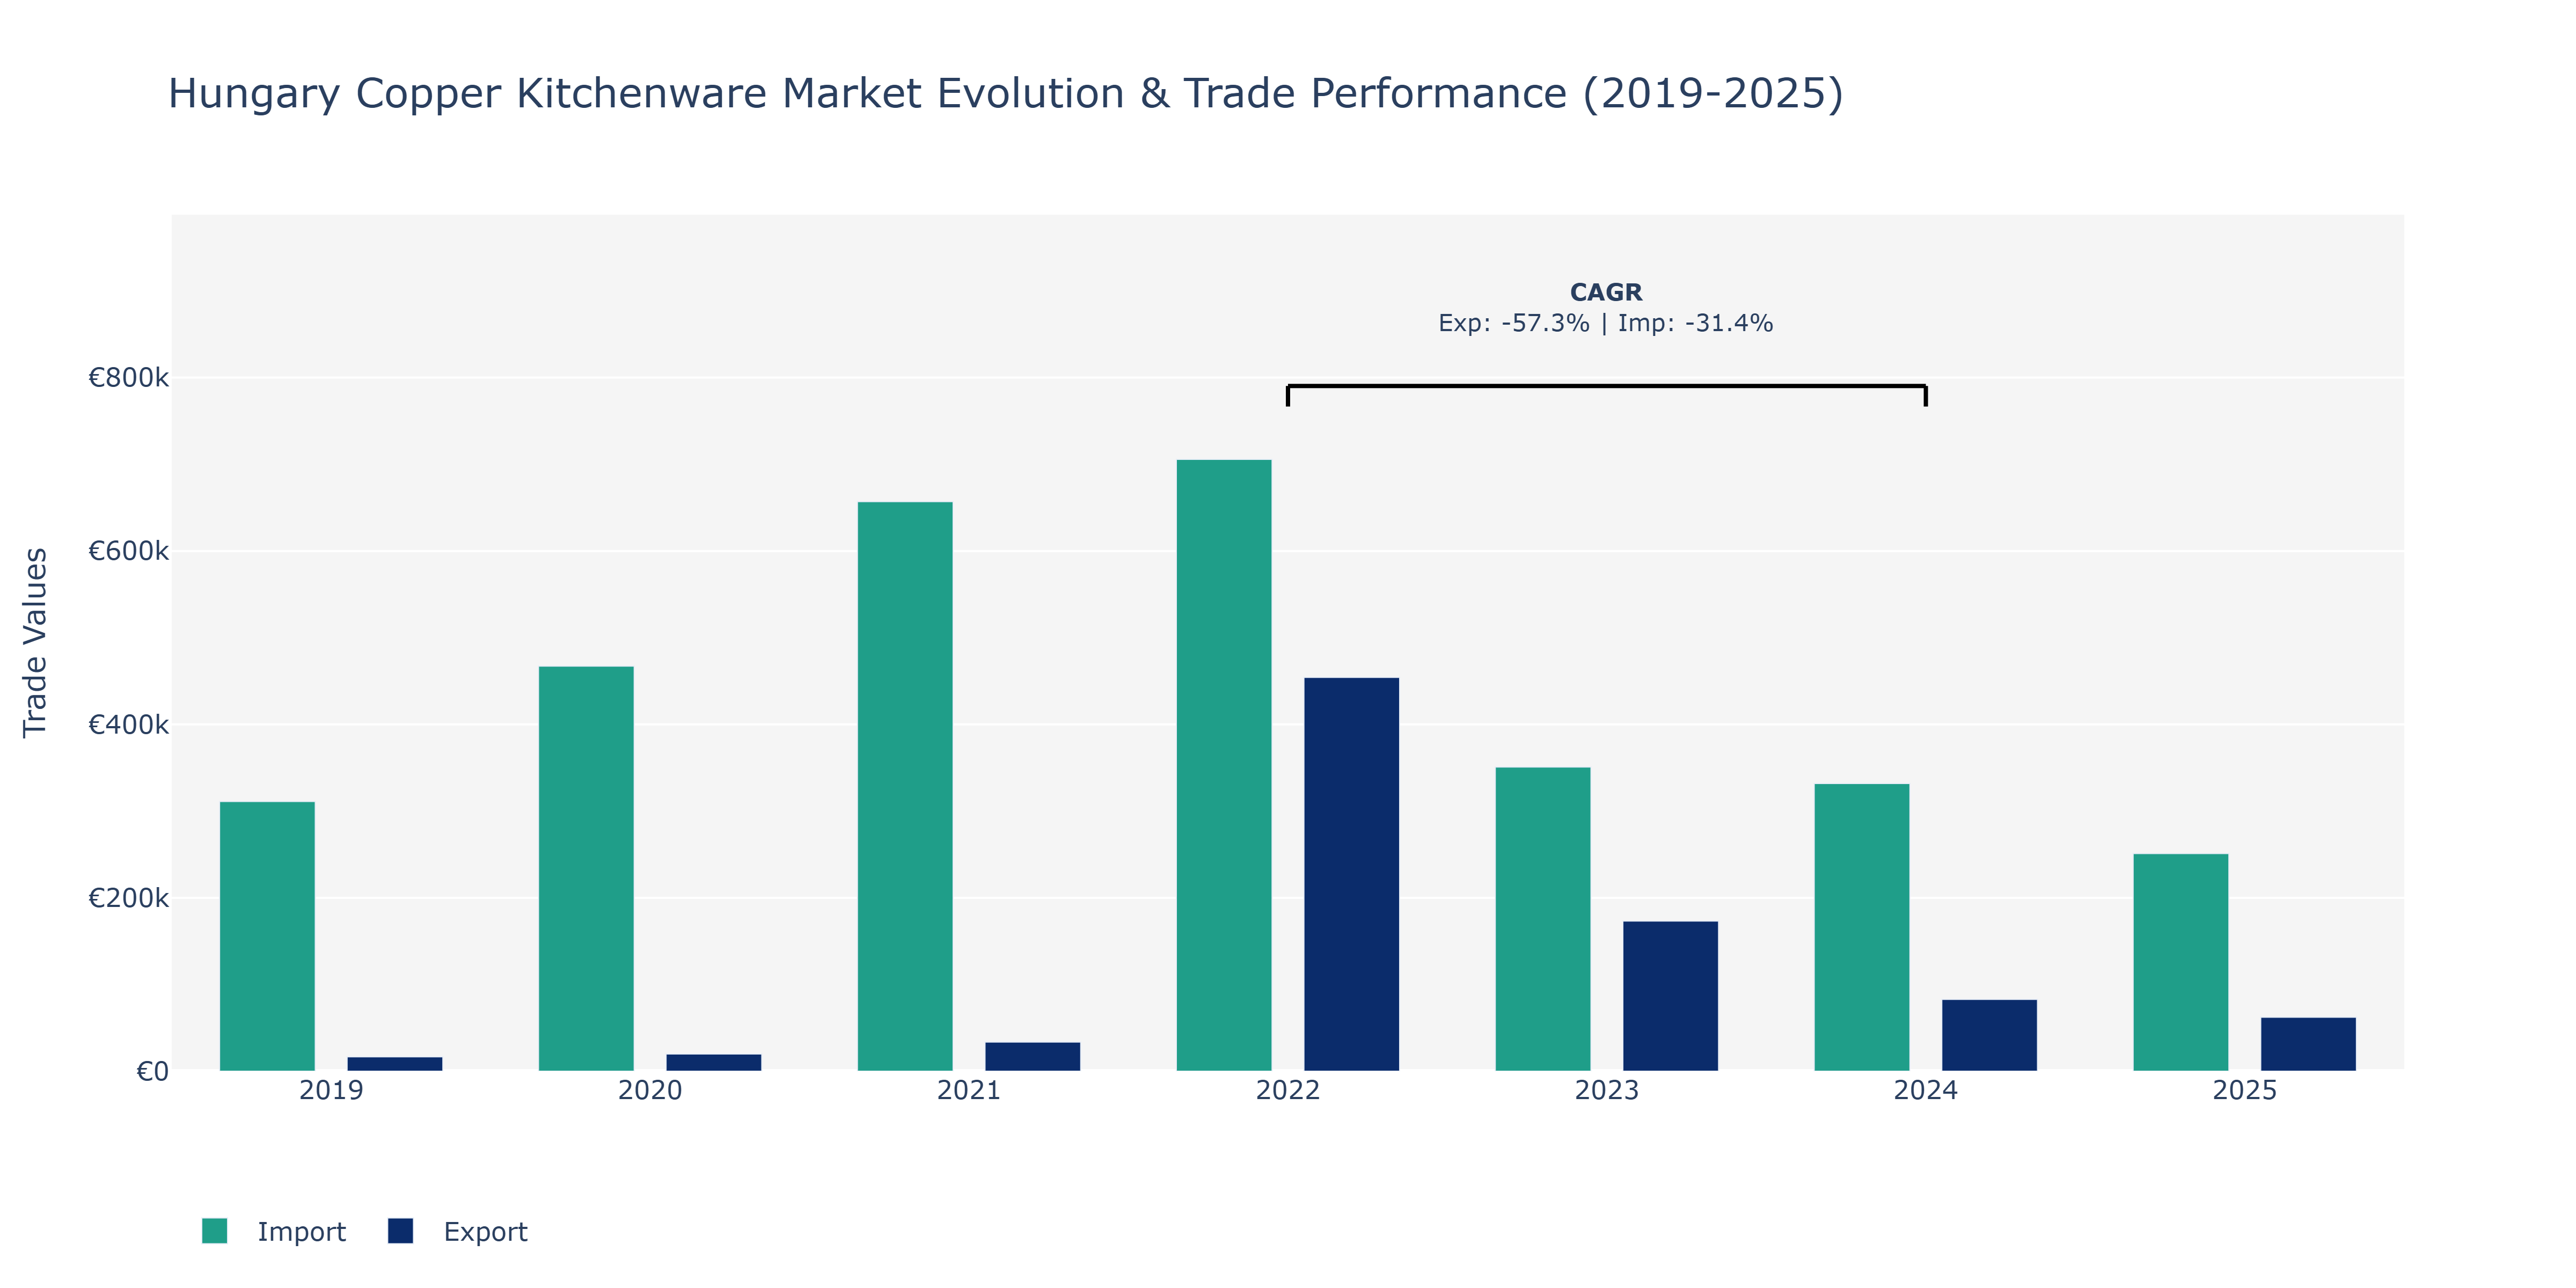
The Hungary Copper Kitchenware Market witnessed fluctuations in both Exports and Imports over the years. In 2019, Imports notably exceeded Exports, with imports valued at €311.04 thousand and exports at €16.49 thousand. The gap between the two narrowed in 2020, as Exports increased to €19.8 thousand and Imports rose to €467.24 thousand. By 2021, Exports surged to €33.66 thousand, surpassing Imports valued at €656.92 thousand. However, a reversal occurred in 2022, with Exports soaring to €454.11 thousand, outpacing Imports at €705.65 thousand, marking a peak point for Exports. Subsequently, both Exports and Imports experienced a decline in 2023 and 2024, with Exports dropping to €173.19 thousand and €82.78 thousand, respectively, and Imports falling to €350.77 thousand and €331.77 thousand, respectively. This downward trend can be attributed to various factors, including changes in consumer preferences, fluctuations in raw material prices, and global economic conditions affecting trade patterns in the copper kitchenware market in Hungary. The notable decline in Exports in 2022-2024 may reflect shifts in production capacities, market demand, or competitive landscapes, leading to the observed negative CAGR for Exports and Imports during this period.
Key Highlights of the Report:
- Hungary Copper Kitchenware Market Outlook
- Market Size of Hungary Copper Kitchenware Market, 2025
- Forecast of Hungary Copper Kitchenware Market, 2032
- Historical Data and Forecast of Hungary Copper Kitchenware Revenues & Volume for the Period 2022-2032F
- Hungary Copper Kitchenware Market Trend Evolution
- Hungary Copper Kitchenware Market Drivers and Challenges
- Hungary Copper Kitchenware Price Trends
- Hungary Copper Kitchenware Porter's Five Forces
- Hungary Copper Kitchenware Industry Life Cycle
- Historical Data and Forecast of Hungary Copper Kitchenware Market Revenues & Volume By Product for the Period 2022-2032F
- Historical Data and Forecast of Hungary Copper Kitchenware Market Revenues & Volume By Copper Oven for the Period 2022-2032F
- Historical Data and Forecast of Hungary Copper Kitchenware Market Revenues & Volume By Copper Skillet for the Period 2022-2032F
- Historical Data and Forecast of Hungary Copper Kitchenware Market Revenues & Volume By Copper Saucepan for the Period 2022-2032F
- Historical Data and Forecast of Hungary Copper Kitchenware Market Revenues & Volume By Others for the Period 2022-2032F
- Historical Data and Forecast of Hungary Copper Kitchenware Market Revenues & Volume By Application for the Period 2022-2032F
- Historical Data and Forecast of Hungary Copper Kitchenware Market Revenues & Volume By Domestic Use for the Period 2022-2032F
- Historical Data and Forecast of Hungary Copper Kitchenware Market Revenues & Volume By Commercial Use for the Period 2022-2032F
- Hungary Copper Kitchenware Import Export Trade Statistics
- Market Opportunity Assessment By Product
- Market Opportunity Assessment By Application
- Hungary Copper Kitchenware Top Companies Market Share
- Hungary Copper Kitchenware Competitive Benchmarking By Technical and Operational Parameters
- Hungary Copper Kitchenware Company Profiles
- Hungary Copper Kitchenware Key Strategic Recommendations
Frequently Asked Questions About the Market Study (FAQs):
6Wresearch actively monitors the Hungary Copper Kitchenware Market and publishes its comprehensive annual report, highlighting emerging trends, growth drivers, revenue analysis, and forecast outlook. Our insights help businesses to make data-backed strategic decisions with ongoing market dynamics. Our analysts track relevent industries related to the Hungary Copper Kitchenware Market, allowing our clients with actionable intelligence and reliable forecasts tailored to emerging regional needs.
Yes, we provide customisation as per your requirements. To learn more, feel free to contact us on sales@6wresearch.com
1 Executive Summary |
2 Introduction |
2.1 Key Highlights of the Report |
2.2 Report Description |
2.3 Market Scope & Segmentation |
2.4 Research Methodology |
2.5 Assumptions |
3 Hungary Copper Kitchenware Market Overview |
3.1 Hungary Country Macro Economic Indicators |
3.2 Hungary Copper Kitchenware Market Revenues & Volume, 2022 & 2032F |
3.3 Hungary Copper Kitchenware Market - Industry Life Cycle |
3.4 Hungary Copper Kitchenware Market - Porter's Five Forces |
3.5 Hungary Copper Kitchenware Market Revenues & Volume Share, By Product, 2022 & 2032F |
3.6 Hungary Copper Kitchenware Market Revenues & Volume Share, By Application, 2022 & 2032F |
4 Hungary Copper Kitchenware Market Dynamics |
4.1 Impact Analysis |
4.2 Market Drivers |
4.2.1 Increasing consumer preference for high-quality and durable kitchenware products |
4.2.2 Growing trend of home cooking and culinary activities, leading to higher demand for premium kitchenware |
4.2.3 Rise in disposable income levels in Hungary, allowing consumers to spend more on luxury kitchenware items |
4.3 Market Restraints |
4.3.1 Fluctuating raw material prices impacting the production cost of copper kitchenware |
4.3.2 Intense competition from alternative materials such as stainless steel and aluminum kitchenware |
5 Hungary Copper Kitchenware Market Trends |
6 Hungary Copper Kitchenware Market, By Types |
6.1 Hungary Copper Kitchenware Market, By Product |
6.1.1 Overview and Analysis |
6.1.2 Hungary Copper Kitchenware Market Revenues & Volume, By Product, 2022 - 2032F |
6.1.3 Hungary Copper Kitchenware Market Revenues & Volume, By Copper Oven, 2022 - 2032F |
6.1.4 Hungary Copper Kitchenware Market Revenues & Volume, By Copper Skillet, 2022 - 2032F |
6.1.5 Hungary Copper Kitchenware Market Revenues & Volume, By Copper Saucepan, 2022 - 2032F |
6.1.6 Hungary Copper Kitchenware Market Revenues & Volume, By Others, 2022 - 2032F |
6.2 Hungary Copper Kitchenware Market, By Application |
6.2.1 Overview and Analysis |
6.2.2 Hungary Copper Kitchenware Market Revenues & Volume, By Domestic Use, 2022 - 2032F |
6.2.3 Hungary Copper Kitchenware Market Revenues & Volume, By Commercial Use, 2022 - 2032F |
7 Hungary Copper Kitchenware Market Import-Export Trade Statistics |
7.1 Hungary Copper Kitchenware Market Export to Major Countries |
7.2 Hungary Copper Kitchenware Market Imports from Major Countries |
8 Hungary Copper Kitchenware Market Key Performance Indicators |
8.1 Consumer engagement on social media platforms promoting copper kitchenware |
8.2 Number of new product launches in the copper kitchenware segment |
8.3 Average customer rating and reviews for copper kitchenware products |
8.4 Percentage growth in online sales of copper kitchenware |
8.5 Participation and attendance in culinary events and exhibitions featuring copper kitchenware |
9 Hungary Copper Kitchenware Market - Opportunity Assessment |
9.1 Hungary Copper Kitchenware Market Opportunity Assessment, By Product, 2022 & 2032F |
9.2 Hungary Copper Kitchenware Market Opportunity Assessment, By Application, 2022 & 2032F |
10 Hungary Copper Kitchenware Market - Competitive Landscape |
10.1 Hungary Copper Kitchenware Market Revenue Share, By Companies, 2025 |
10.2 Hungary Copper Kitchenware Market Competitive Benchmarking, By Operating and Technical Parameters |
11 Company Profiles |
12 Recommendations |
13 Disclaimer |
Global Go To Market Strategy - 2030
Export potential enables firms to identify high-growth global markets with greater confidence by combining advanced trade intelligence with a structured quantitative methodology. The framework analyzes emerging demand trends and country-level import patterns while integrating macroeconomic and trade datasets such as GDP and population forecasts, bilateral import–export flows, tariff structures, elasticity differentials between developed and developing economies, geographic distance, and import demand projections. Using weighted trade values from 2020–2024 as the base period to project country-to-country export potential for 2030, these inputs are operationalized through calculated drivers such as gravity model parameters, tariff impact factors, and projected GDP per-capita growth. Through an analysis of hidden potentials, demand hotspots, and market conditions that are most favorable to success, this method enables firms to focus on target countries, maximize returns, and global expansion with data, backed by accuracy.
By factoring in the projected importer demand gap that is currently unmet and could be potential opportunity, it identifies the potential for the Exporter (Country) among 190 countries, against the general trade analysis, which identifies the biggest importer or exporter.
To discover high-growth global markets and optimize your business strategy:
Click Here
Pricing
- Single User License$ 1,995
- Department License$ 2,400
- Site License$ 3,120
- Global License$ 3,795

Leadership Perspectives from Industry Events
Search
Thought Leadership and Analyst Meet


Our Clients
6WResearch In News
- India Air Conditioner Market Set for Strong Rebound in 2026 After Weather-Led Correction and GST-Driven Recovery: 6Wresearch
- ADAS in India: How Automatic Emergency Braking, Blind Spot Detection & Driver Monitoring are Transforming Road Safety
- Doha a strategic location for EV manufacturing hub: IPA Qatar
- Demand for luxury TVs surging in the GCC, says Samsung
- Empowering Growth: The Thriving Journey of Bangladesh’s Cable Industry
- Demand for luxury TVs surging in the GCC, says Samsung
Latest Reports
- Poland Fire Protection Systems Market (2026-2032)
- Cape Verde Portable Hand-Thrown Extinguisher Market (2026-2032)
- Canada Portable Hand-Thrown Extinguisher Market (2026-2032)
- Cameroon Portable Hand-Thrown Extinguisher Market (2026-2032)
- Burundi Portable Hand-Thrown Extinguisher Market (2026-2032)
- Burkina Faso Portable Hand-Thrown Extinguisher Market (2026-2032)
- Bulgaria Portable Hand-Thrown Extinguisher Market (2026-2032)
- Brunei Portable Hand-Thrown Extinguisher Market (2026-2032)
- Botswana Portable Hand-Thrown Extinguisher Market (2026-2032)
- Bosnia and Herzegovina Portable Hand-Thrown Extinguisher Market (2026-2032)
Industry Events and Analyst Meet

HIMTEX 2026

India Refining Summit 2026

India EV Show 2026

EV tech India Expo 2026

Auto Tech Asia 2026
Whitepaper
- Middle East & Africa Commercial Security Market Click here to view more.
- Middle East & Africa Fire Safety Systems & Equipment Market Click here to view more.
- GCC Drone Market Click here to view more.
- Middle East Lighting Fixture Market Click here to view more.
- GCC Physical & Perimeter Security Market Click here to view more.