Hungary Interactive Tables Market (2026-2032) Outlook | Trends, Value, Share, Analysis, Companies, Growth, Revenue, Size, Industry & Forecast
Market Forecast By Technology (LCD, LED, Capacitive, Others), By Screen Size (32-65 Inch, 65 Inch & Above), By Application (Exhibition & Trade Shows, Education, Retail, Control Room, Hospitality, Transportation, Others) And Competitive Landscape
| Product Code: ETC275059 | Publication Date: Aug 2022 | Updated Date: Jul 2026 | Product Type: Market Research Report | |
| Publisher: 6Wresearch | Author: Ravi Bhandari | No. of Pages: 75 | No. of Figures: 35 | No. of Tables: 20 |
Hungary Interactive Tables Market Size, Share & Growth Rate
The Hungary Interactive Tables Market was estimated at USD 212 Million in 2025 and is projected to reach USD 300 Million by 2032, growing at a CAGR of 5.1% from 2026 to 2032. This growth trajectory is primarily fueled by the increasing integration of advanced multi-touch and gesture recognition technologies across educational institutions and retail environments. As the demand for engaging and immersive user experiences intensifies, interactive tables are becoming a critical asset in transforming how information is shared and interacted with.
Hungary Interactive Tables Market Year-wise Growth Rate and Key Drivers
This graph highlights how the Hungary Interactive Tables Market has steadily grown over the years, supported by major growth factors.
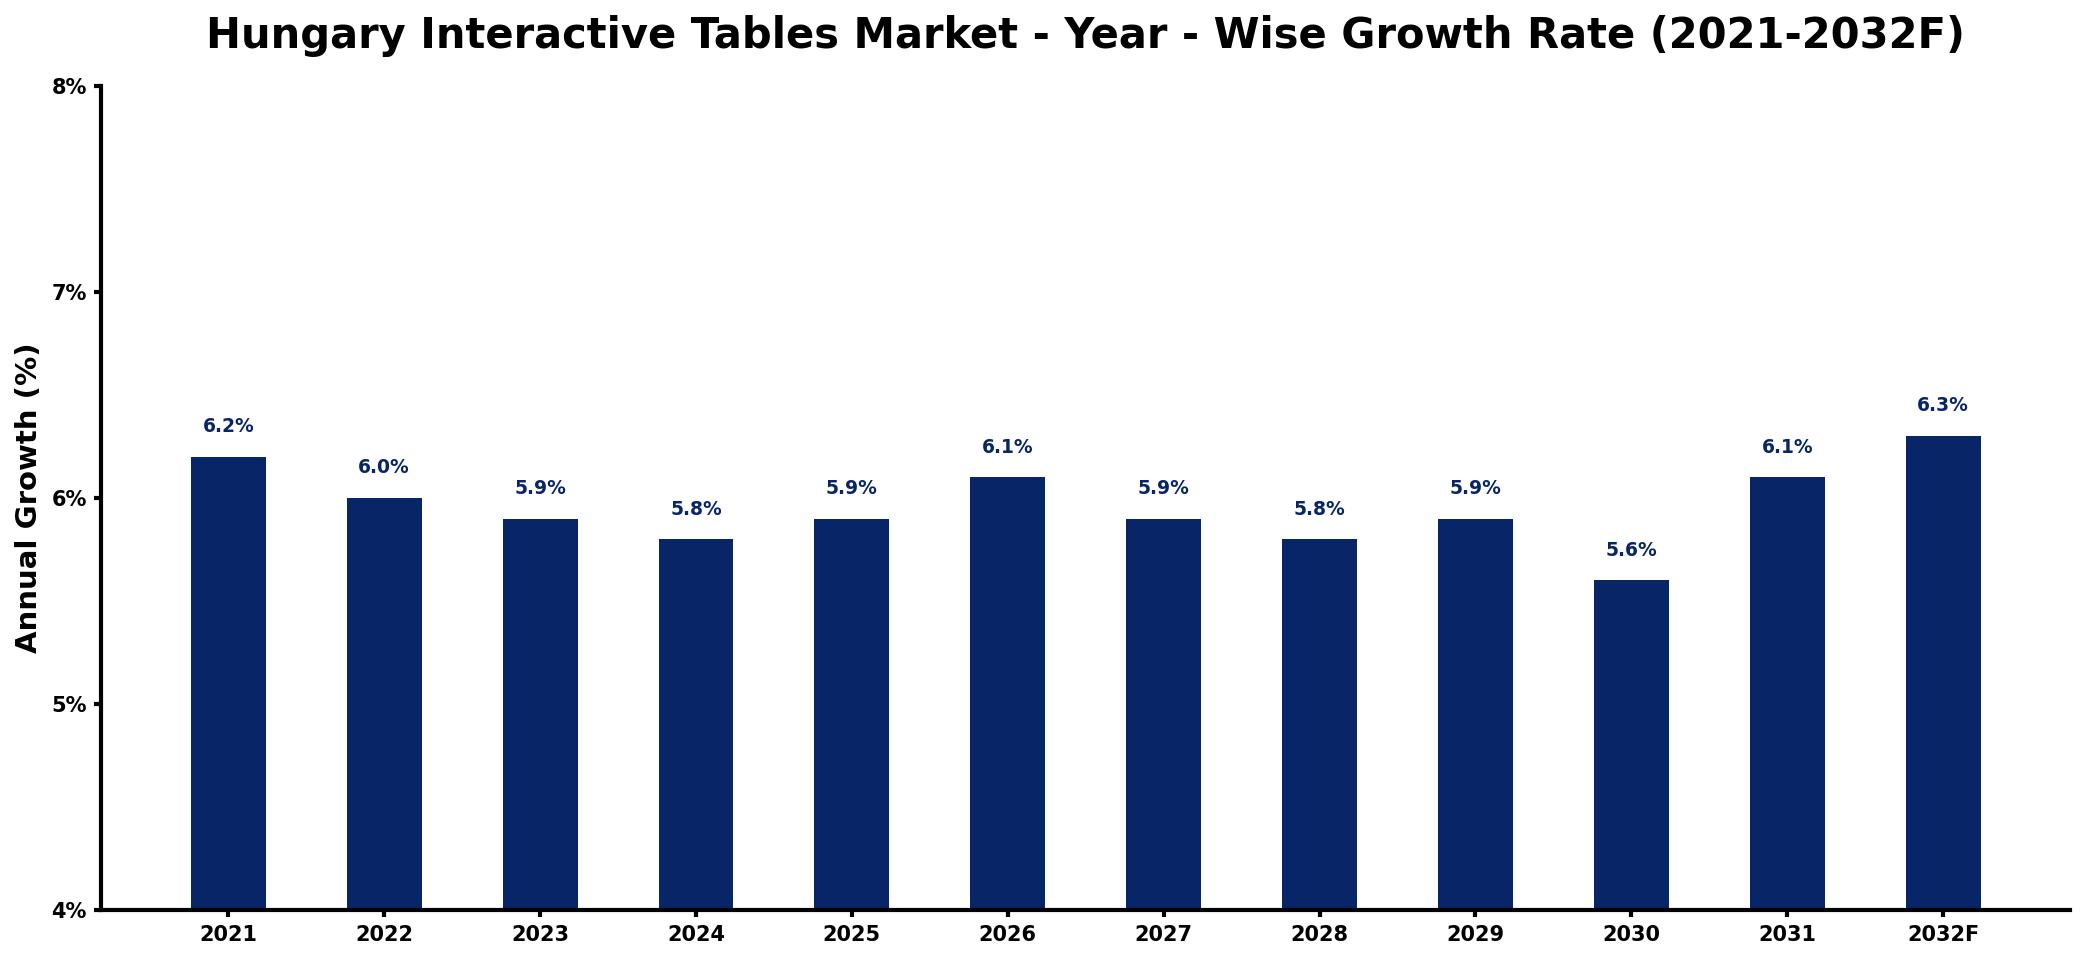
The table below presents the year‑wise growth rates along with the key drivers influencing the market
| Year | Growth Rate | Major Drivers |
| 2021 | 6.2% | increased investment in technology |
| 2022 | 6.0% | growing demand for digital solutions |
| 2023 | 5.9% | expansion of educational applications |
| 2024 | 5.8% | rise in hospitality sector adoption |
| 2025 | 5.9% | enhanced customer engagement strategies |
| 2026 | 6.1% | influx of innovative design concepts |
| 2027 | 5.9% | strengthened partnerships with tech firms |
| 2028 | 5.8% | development of smart city initiatives |
| 2029 | 5.9% | broader integration in retail spaces |
| 2030 | 5.6% | emphasis on sustainability practices |
| 2031 | 6.1% | adoption of hybrid work environments |
| 2032 | 6.3% | launch of advanced user interfaces |
Note: Market size estimations and growth projections presented in this report are based on 6Wresearch's proprietary forecasting methodology, utilizing the latest available industry data, government publications, and primary research inputs.
Hungary Interactive Tables Market Synopsis
The demand for interactive tables in Hungary is significantly driven by the educational sector's shift towards digital learning environments. Schools and universities are embracing these technologies to enhance collaborative learning and engage students more effectively. This trend aligns with broader digitalization efforts nationwide, emphasizing the importance of interactive learning tools.
In retail spaces, businesses are increasingly implementing interactive tables to facilitate product exploration and improve customer engagement. As competition intensifies, retailers recognize the value of offering personalized and interactive shopping experiences, leading to a growing demand for customized solutions that align with their unique brand identities.
Hungary Interactive Tables Market Key Takeaways
- Multi-touch technology and gesture recognition are enhancing user interaction across various sectors.
- Educational institutions are a primary driver, focusing on interactive learning tools to promote engagement.
- Retailers are adopting interactive tables for improved customer experiences and competitive differentiation.
- Government initiatives are fostering the growth of interactive technologies in public spaces.
- Challenges remain in designing versatile solutions that meet the diverse needs of multiple industries.
Evaluation of Restraints in Hungary Interactive Tables Market
Despite the promising growth of the interactive tables market in Hungary, certain restraints hinder its full potential. One significant limitation is the need for versatile solutions tailored to various industries, including hospitality, education, and retail. Manufacturers face the challenge of developing customizable products that not only meet diverse client expectations but also adapt to rapid technological advancements. This complexity necessitates ongoing investment in research and development, which can strain resources and slow down market penetration.
Hungary Interactive Tables Market Trends
The market is witnessing several key trends shaping demand. Increased adoption of augmented reality (AR) and virtual reality (VR) technologies is elevating the capabilities of interactive tables, allowing for more immersive experiences. Moreover, there is a growing focus on user-friendly interfaces that facilitate seamless interaction among multiple users. As organizations prioritize sustainability, eco-friendly materials are gaining traction in the design and manufacturing processes of interactive tables.
Hungary Interactive Tables Market Opportunities
Significant opportunities lie in expanding the applications of interactive tables beyond traditional sectors. The potential for integration with smart city initiatives and public displays offers manufacturers new avenues for growth. Additionally, emerging markets such as healthcare and entertainment can benefit from interactive tables, promoting innovative solutions that cater to patient engagement and interactive storytelling. These opportunities can drive further investment and collaboration across various sectors.
Government Initiatives in the Hungary Interactive Tables Market
The Hungarian government is actively promoting the adoption of interactive tables through various initiatives aimed at enhancing educational and customer engagement experiences. This includes providing regulatory support for deploying interactive technologies in public spaces, as well as offering investment incentives for manufacturers. Furthermore, public programs designed to foster innovative educational environments are encouraging the integration of interactive solutions across schools and universities.
Future Insights of the Hungary Interactive Tables Market
Looking ahead to 2026-2032, the Hungary Interactive Tables Market is poised for substantial growth driven by continuous advancements in technology and increasing user demand for interactive solutions. The focus on creating customized, user-centric designs will likely play a pivotal role in attracting more sectors to adopt these tools. Additionally, as educational and retail environments evolve, interactive tables will become an integral part of enhancing customer and learner experiences.
Hungary Interactive Tables Market Latest Developments (2025 - 2026)
Recent developments in the Hungary interactive tables market indicate a trend toward more integrated solutions that combine hardware with software enhancements. Companies are launching products that support collaborative features, enabling users to interact simultaneously and share content more efficiently. Moreover, there are increased partnerships among tech firms and educational institutions, aimed at fostering innovative teaching and learning methods.
Hungary Interactive Tables Market - Key Attractiveness of the Report
- 10 Years of Market Numbers
- Historical Data Starting from 2022 to 2025
- Base Year: 2025
- Forecast Data until 2032
- Key Performance Indicators Impacting the Market
- Major Upcoming Developments and Projects
Key Highlights of the Report:
- Hungary Interactive Tables Market Outlook
- Market Size of Hungary Interactive Tables Market, 2025
- Forecast of Hungary Interactive Tables Market, 2032
- Historical Data and Forecast of Hungary Interactive Tables Revenues & Volume for the Period 2022-2032F
- Hungary Interactive Tables Market Trend Evolution
- Hungary Interactive Tables Market Drivers and Challenges
- Hungary Interactive Tables Price Trends
- Hungary Interactive Tables Porter's Five Forces
- Hungary Interactive Tables Industry Life Cycle
- Historical Data and Forecast of Hungary Interactive Tables Market Revenues & Volume By Technology for the Period 2022-2032F
- Historical Data and Forecast of Hungary Interactive Tables Market Revenues & Volume By LCD for the Period 2022-2032F
- Historical Data and Forecast of Hungary Interactive Tables Market Revenues & Volume By LED for the Period 2022-2032F
- Historical Data and Forecast of Hungary Interactive Tables Market Revenues & Volume By Capacitive for the Period 2022-2032F
- Historical Data and Forecast of Hungary Interactive Tables Market Revenues & Volume By Others for the Period 2022-2032F
- Historical Data and Forecast of Hungary Interactive Tables Market Revenues & Volume By Screen Size for the Period 2022-2032F
- Historical Data and Forecast of Hungary Interactive Tables Market Revenues & Volume By 32-65 Inch for the Period 2022-2032F
- Historical Data and Forecast of Hungary Interactive Tables Market Revenues & Volume By 65 Inch & Above for the Period 2022-2032F
- Historical Data and Forecast of Hungary Interactive Tables Market Revenues & Volume By Application for the Period 2022-2032F
- Historical Data and Forecast of Hungary Interactive Tables Market Revenues & Volume By Exhibition & Trade Shows for the Period 2022-2032F
- Historical Data and Forecast of Hungary Interactive Tables Market Revenues & Volume By Education for the Period 2022-2032F
- Historical Data and Forecast of Hungary Interactive Tables Market Revenues & Volume By Retail for the Period 2022-2032F
- Historical Data and Forecast of Hungary Interactive Tables Market Revenues & Volume By Control Room for the Period 2022-2032F
- Historical Data and Forecast of Hungary Interactive Tables Market Revenues & Volume By Hospitality for the Period 2022-2032F
- Historical Data and Forecast of Hungary Interactive Tables Market Revenues & Volume By Transportation for the Period 2022-2032F
- Historical Data and Forecast of Hungary Interactive Tables Market Revenues & Volume By Others for the Period 2022-2032F
- Hungary Interactive Tables Import Export Trade Statistics
- Market Opportunity Assessment By Technology
- Market Opportunity Assessment By Screen Size
- Market Opportunity Assessment By Application
- Hungary Interactive Tables Top Companies Market Share
- Hungary Interactive Tables Competitive Benchmarking By Technical and Operational Parameters
- Hungary Interactive Tables Company Profiles
- Hungary Interactive Tables Key Strategic Recommendations
Frequently Asked Questions About the Market Study (FAQs):
The growth is largely driven by digitalization trends in education and retail, where engaging user experiences are paramount. As institutions seek to enhance interaction, the adoption of advanced technologies like multi-touch and gesture recognition becomes essential.
The Hungary Interactive Tables Market is projected to reach USD 300 Million by 2032, marking a CAGR of 5.1% from 2026 to 2032. This growth will likely be supported by expanding applications across diverse sectors and innovations in technology.
One notable challenge is the need for customized solutions that address the varying requirements of different industries. Balancing versatility with technological advancements poses significant design and production hurdles.
Interactive tables find their primary applications in education, retail, and hospitality. However, emerging interest is noted in sectors like healthcare, where patient engagement technologies are gaining traction.
Government support in Hungary promotes the deployment of interactive technologies in public spaces, providing incentives for manufacturers and fostering innovative educational environments. This commitment significantly boosts market growth.
6Wresearch actively monitors the Hungary Interactive Tables Market and publishes its comprehensive annual report, highlighting emerging trends, growth drivers, revenue analysis, and forecast outlook. Our insights help businesses to make data-backed strategic decisions with ongoing market dynamics. Our analysts track relevent industries related to the Hungary Interactive Tables Market, allowing our clients with actionable intelligence and reliable forecasts tailored to emerging regional needs.
Yes, we provide customisation as per your requirements. To learn more, feel free to contact us on sales@6wresearch.com
1 Executive Summary |
2 Introduction |
2.1 Key Highlights of the Report |
2.2 Report Description |
2.3 Market Scope & Segmentation |
2.4 Research Methodology |
2.5 Assumptions |
3 Hungary Interactive Tables Market Overview |
3.1 Hungary Country Macro Economic Indicators |
3.2 Hungary Interactive Tables Market Revenues & Volume, 2022 & 2032F |
3.3 Hungary Interactive Tables Market - Industry Life Cycle |
3.4 Hungary Interactive Tables Market - Porter's Five Forces |
3.5 Hungary Interactive Tables Market Revenues & Volume Share, By Technology, 2022 & 2032F |
3.6 Hungary Interactive Tables Market Revenues & Volume Share, By Screen Size, 2022 & 2032F |
3.7 Hungary Interactive Tables Market Revenues & Volume Share, By Application, 2022 & 2032F |
4 Hungary Interactive Tables Market Dynamics |
4.1 Impact Analysis |
4.2 Market Drivers |
4.2.1 Increasing demand for interactive learning and training tools in educational institutions in Hungary |
4.2.2 Rising adoption of interactive tables in retail and hospitality sectors for enhanced customer experience |
4.2.3 Technological advancements leading to more innovative and feature-rich interactive table solutions |
4.3 Market Restraints |
4.3.1 High initial investment cost associated with interactive table technology |
4.3.2 Limited awareness and understanding of the benefits of interactive tables among potential end-users in Hungary |
5 Hungary Interactive Tables Market Trends |
6 Hungary Interactive Tables Market, By Types |
6.1 Hungary Interactive Tables Market, By Technology |
6.1.1 Overview and Analysis |
6.1.2 Hungary Interactive Tables Market Revenues & Volume, By Technology, 2022-2032F |
6.1.3 Hungary Interactive Tables Market Revenues & Volume, By LCD, 2022-2032F |
6.1.4 Hungary Interactive Tables Market Revenues & Volume, By LED, 2022-2032F |
6.1.5 Hungary Interactive Tables Market Revenues & Volume, By Capacitive, 2022-2032F |
6.1.6 Hungary Interactive Tables Market Revenues & Volume, By Others, 2022-2032F |
6.2 Hungary Interactive Tables Market, By Screen Size |
6.2.1 Overview and Analysis |
6.2.2 Hungary Interactive Tables Market Revenues & Volume, By 32-65 Inch, 2022-2032F |
6.2.3 Hungary Interactive Tables Market Revenues & Volume, By 65 Inch & Above, 2022-2032F |
6.3 Hungary Interactive Tables Market, By Application |
6.3.1 Overview and Analysis |
6.3.2 Hungary Interactive Tables Market Revenues & Volume, By Exhibition & Trade Shows, 2022-2032F |
6.3.3 Hungary Interactive Tables Market Revenues & Volume, By Education, 2022-2032F |
6.3.4 Hungary Interactive Tables Market Revenues & Volume, By Retail, 2022-2032F |
6.3.5 Hungary Interactive Tables Market Revenues & Volume, By Control Room, 2022-2032F |
6.3.6 Hungary Interactive Tables Market Revenues & Volume, By Hospitality, 2022-2032F |
6.3.7 Hungary Interactive Tables Market Revenues & Volume, By Transportation, 2022-2032F |
7 Hungary Interactive Tables Market Import-Export Trade Statistics |
7.1 Hungary Interactive Tables Market Export to Major Countries |
7.2 Hungary Interactive Tables Market Imports from Major Countries |
8 Hungary Interactive Tables Market Key Performance Indicators |
8.1 Percentage increase in the number of educational institutions adopting interactive tables for teaching purposes |
8.2 Growth in the number of retail and hospitality establishments implementing interactive tables for customer engagement |
8.3 Rate of technological innovation and product development in the Hungary interactive tables market |
9 Hungary Interactive Tables Market - Opportunity Assessment |
9.1 Hungary Interactive Tables Market Opportunity Assessment, By Technology, 2022 & 2032F |
9.2 Hungary Interactive Tables Market Opportunity Assessment, By Screen Size, 2022 & 2032F |
9.3 Hungary Interactive Tables Market Opportunity Assessment, By Application, 2022 & 2032F |
10 Hungary Interactive Tables Market - Competitive Landscape |
10.1 Hungary Interactive Tables Market Revenue Share, By Companies, 2025 |
10.2 Hungary Interactive Tables Market Competitive Benchmarking, By Operating and Technical Parameters |
11 Company Profiles |
12 Recommendations |
13 Disclaimer |
Global Go To Market Strategy - 2030
Export potential enables firms to identify high-growth global markets with greater confidence by combining advanced trade intelligence with a structured quantitative methodology. The framework analyzes emerging demand trends and country-level import patterns while integrating macroeconomic and trade datasets such as GDP and population forecasts, bilateral import–export flows, tariff structures, elasticity differentials between developed and developing economies, geographic distance, and import demand projections. Using weighted trade values from 2020–2024 as the base period to project country-to-country export potential for 2030, these inputs are operationalized through calculated drivers such as gravity model parameters, tariff impact factors, and projected GDP per-capita growth. Through an analysis of hidden potentials, demand hotspots, and market conditions that are most favorable to success, this method enables firms to focus on target countries, maximize returns, and global expansion with data, backed by accuracy.
By factoring in the projected importer demand gap that is currently unmet and could be potential opportunity, it identifies the potential for the Exporter (Country) among 190 countries, against the general trade analysis, which identifies the biggest importer or exporter.
To discover high-growth global markets and optimize your business strategy:
Click Here
Pricing
- Single User License$ 1,995
- Department License$ 2,400
- Site License$ 3,120
- Global License$ 3,795

Leadership Perspectives from Industry Events
Search
Thought Leadership and Analyst Meet


Our Clients
6WResearch In News
- India Air Conditioner Market Set for Strong Rebound in 2026 After Weather-Led Correction and GST-Driven Recovery: 6Wresearch
- ADAS in India: How Automatic Emergency Braking, Blind Spot Detection & Driver Monitoring are Transforming Road Safety
- Doha a strategic location for EV manufacturing hub: IPA Qatar
- Demand for luxury TVs surging in the GCC, says Samsung
- Empowering Growth: The Thriving Journey of Bangladesh’s Cable Industry
- Demand for luxury TVs surging in the GCC, says Samsung
Latest Reports
- Nicaragua RPG Gaming Market (2026-2032)
- New Zealand RPG Gaming Market (2026-2032)
- Netherlands RPG Gaming Market (2026-2032)
- Nauru RPG Gaming Market (2026-2032)
- Namibia RPG Gaming Market (2026-2032)
- Mozambique RPG Gaming Market (2026-2032)
- Montenegro RPG Gaming Market (2026-2032)
- Mongolia RPG Gaming Market (2026-2032)
- Monaco RPG Gaming Market (2026-2032)
- Micronesia RPG Gaming Market (2026-2032)
Industry Events and Analyst Meet

EV India Expo 2026

HIMTEX 2026

India Refining Summit 2026

India EV Show 2026

EV tech India Expo 2026
Whitepaper
- Middle East & Africa Commercial Security Market Click here to view more.
- Middle East & Africa Fire Safety Systems & Equipment Market Click here to view more.
- GCC Drone Market Click here to view more.
- Middle East Lighting Fixture Market Click here to view more.
- GCC Physical & Perimeter Security Market Click here to view more.