Hungary Lecithin Market Outlook | Trends, Size, Revenue, Companies, Share, Growth, COVID-19 IMPACT, Forecast, Analysis, Industry & Value
Market Forecast By Source (Soy, Sunflower, Rapeseed, Others), By End-use (Convenience Food, Bakery, Confectionary, Pharmaceutical, Personal Care And Cosmetics, Animal Feed, Other Industrial), By Form (Liquid, Powder, Granules) And Competitive Landscape
| Product Code: ETC417255 | Publication Date: Oct 2022 | Updated Date: Jan 2026 | Product Type: Market Research Report | |
| Publisher: 6Wresearch | Author: Ravi Bhandari | No. of Pages: 75 | No. of Figures: 35 | No. of Tables: 20 |
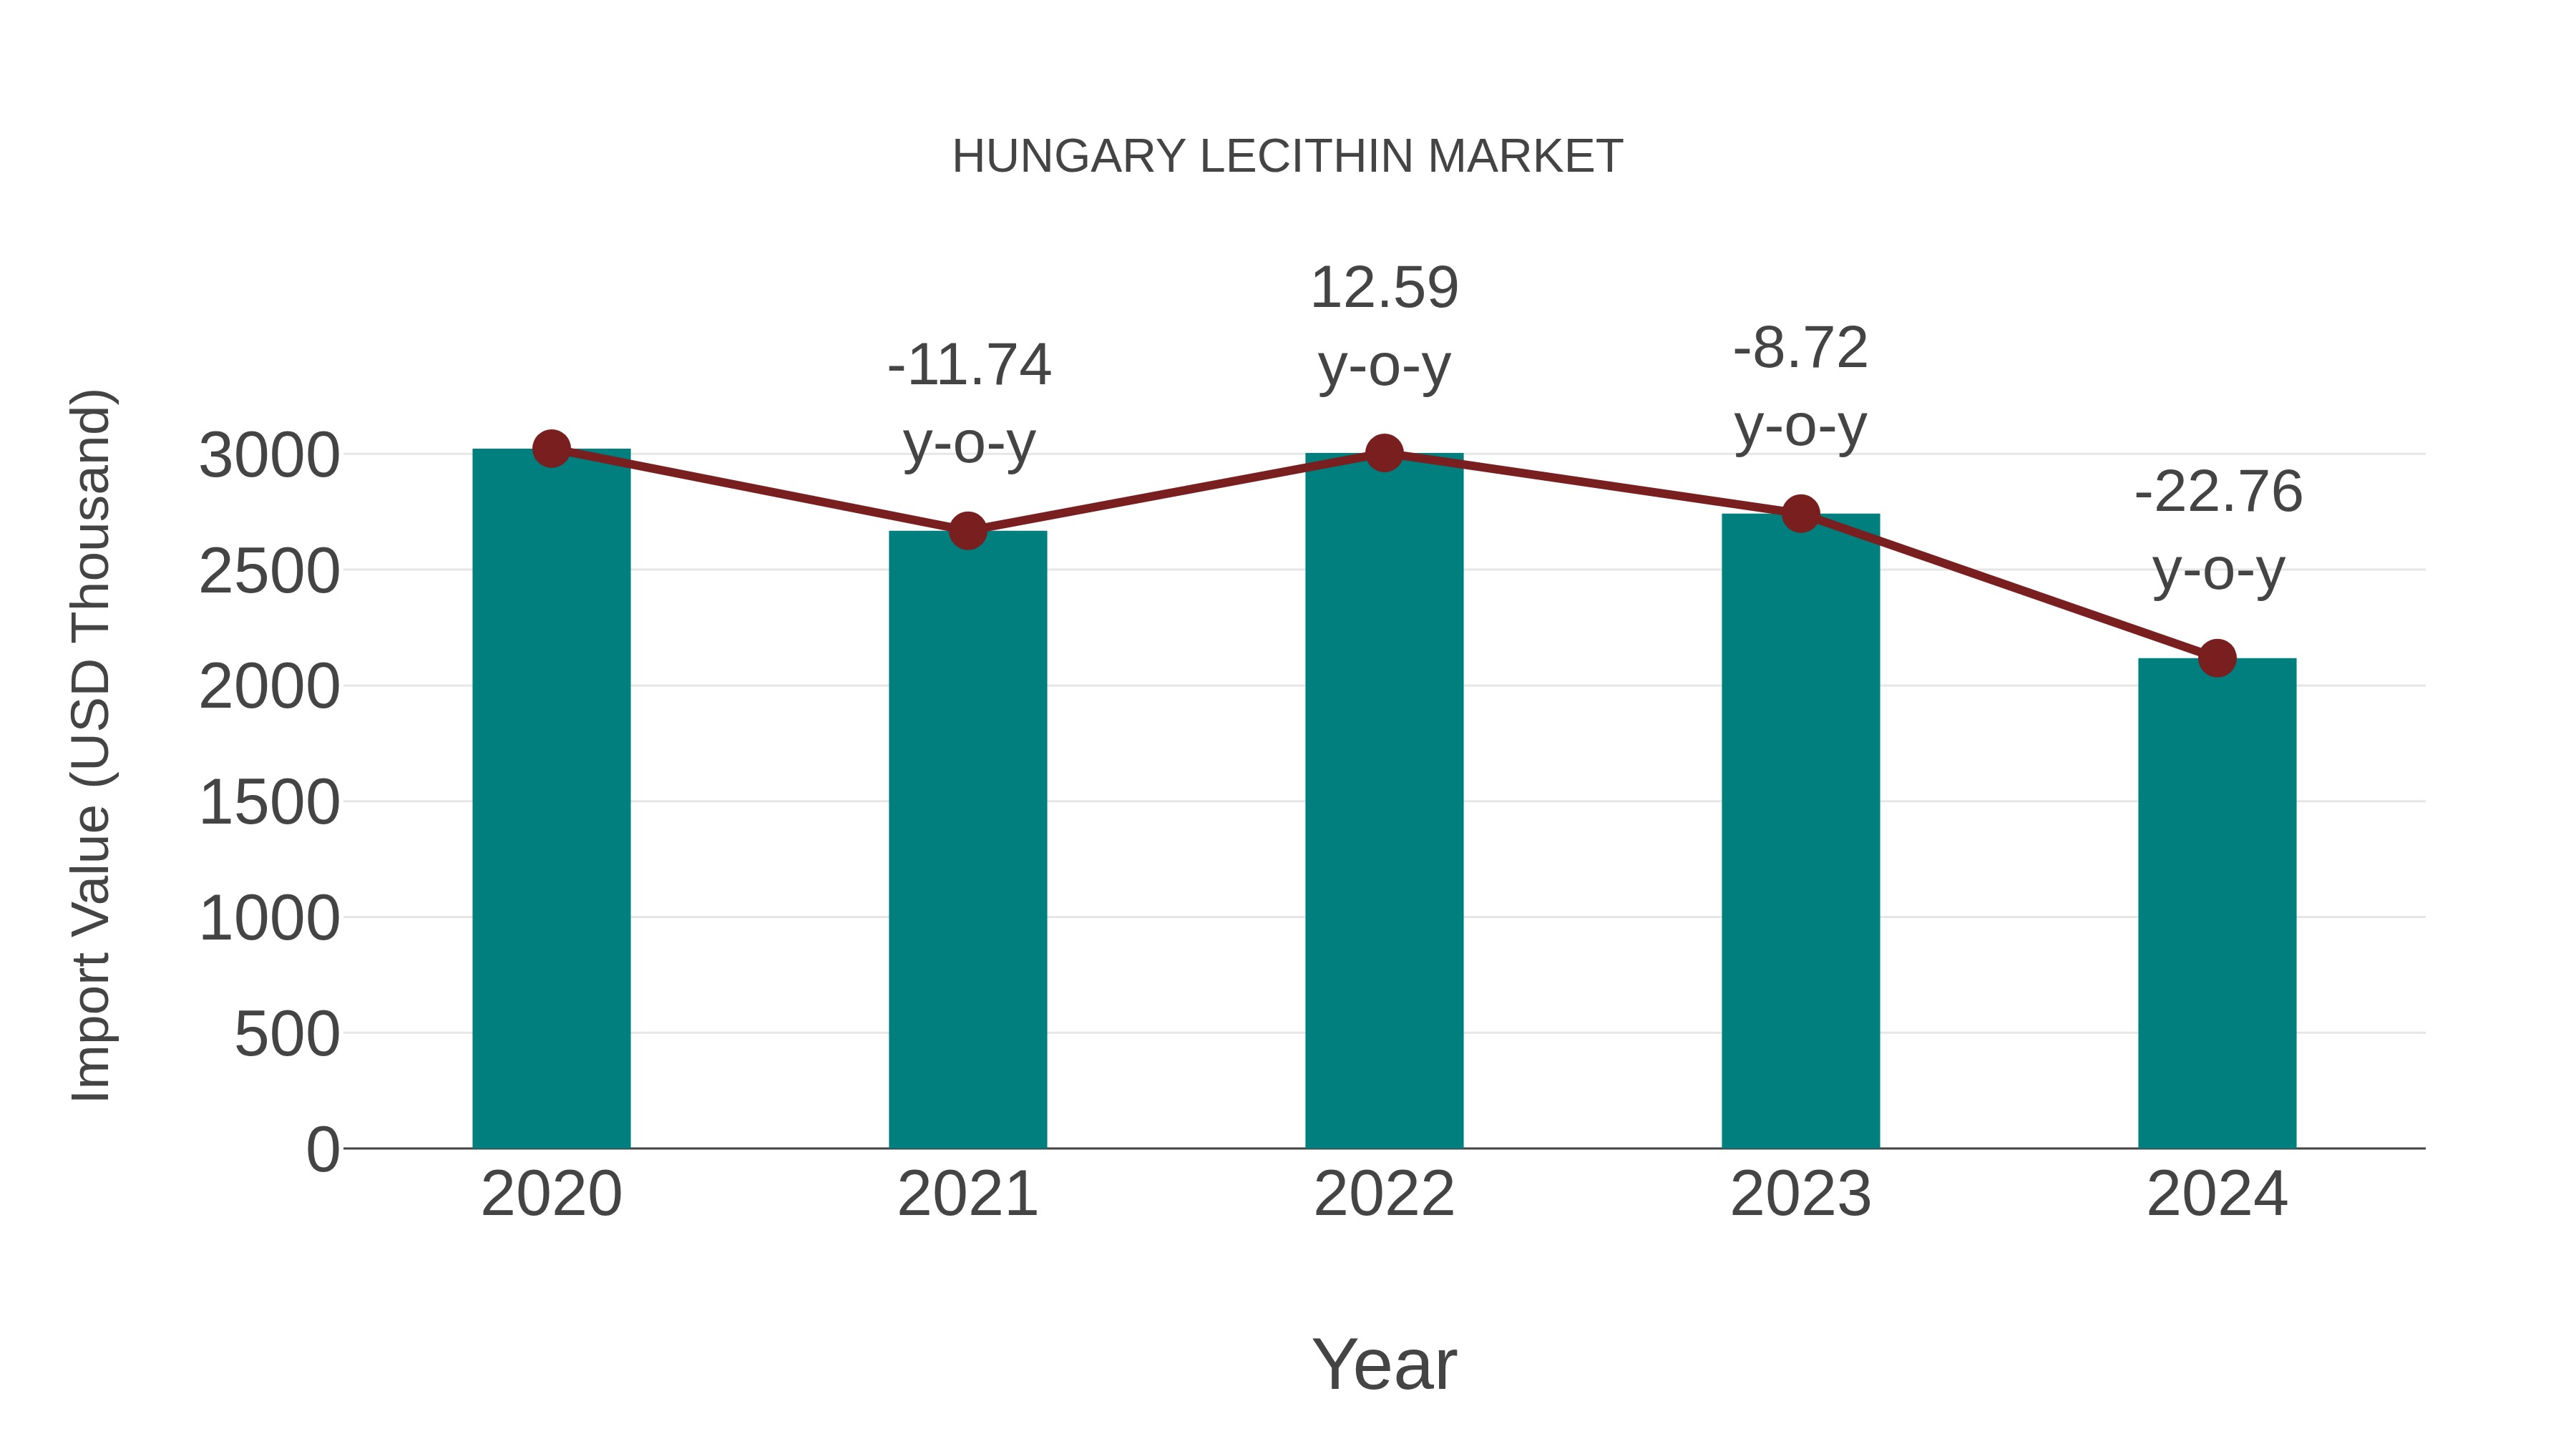
Hungary Lecithin Market: Import Trend Analysis
Hungary`s import trend for lecithin in 2024 experienced a decline of -22.76% compared to the previous year, with a compound annual growth rate (CAGR) of -8.51% from 2020 to 2024. This negative momentum could be attributed to shifts in demand, potentially influenced by evolving consumer preferences or market dynamics impacting import patterns.
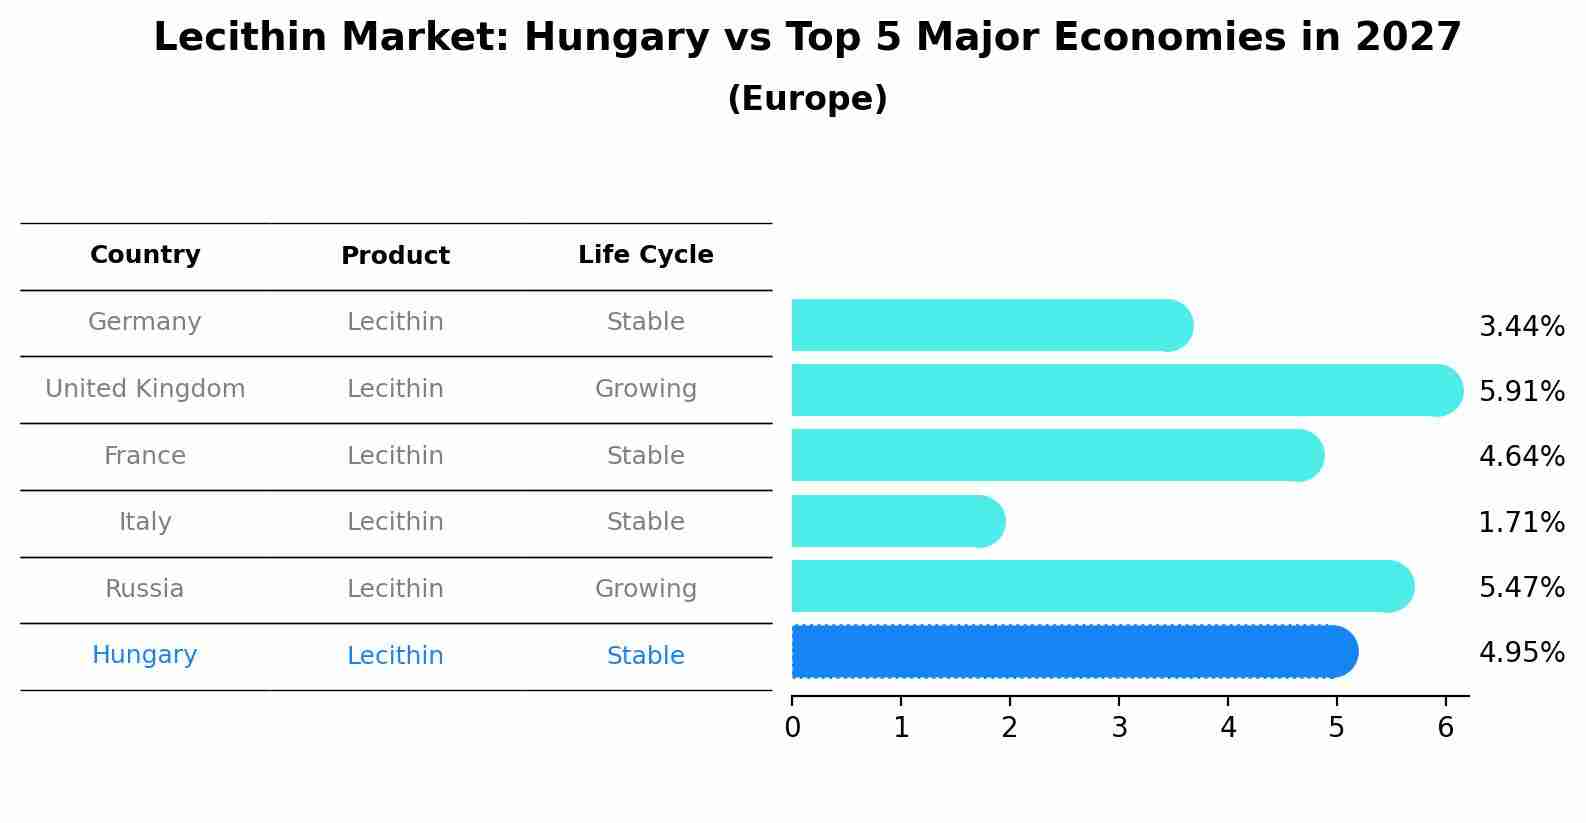
Lecithin Market: Hungary vs Top 5 Major Economies in 2027 (Europe)
The Lecithin market in Hungary is projected to grow at a stable growth rate of 4.95% by 2027, highlighting the country's increasing focus on advanced technologies within the Europe region, where Germany holds the dominant position, followed closely by United Kingdom, France, Italy and Russia, shaping overall regional demand.
Hungary Lecithin Market Overview
The lecithin market in Hungary is witnessing growth with the demand for natural emulsifiers and nutritional supplements in food, pharmaceutical, and cosmetic industries. Lecithin offers emulsifying, stabilizing, and moisturizing properties, driving market demand for lecithin-based products and formulations.
Drivers of the market
The versatile applications of lecithin in food, pharmaceuticals, and personal care products are driving its demand in Hungary, especially as a natural emulsifier and nutritional supplement.
Challenges of the market
A significant challenge in Hungary lecithin market is ensuring sustainable sourcing and quality consistency in production. While lecithin is a versatile ingredient in food, pharmaceuticals, and industrial applications, there may be concerns about genetic modification and pesticide residues in soy-based lecithin, requiring transparent supply chains and certifications to reassure consumers and meet regulatory standards for safety and purity.
Government Policy of the market
The Hungary government promotes the production and export of lecithin as a natural emulsifier and nutritional supplement. Policies include quality standards for lecithin extraction and processing, trade agreements to enhance market access, and research funding for lecithin applications in food and pharmaceutical industries.
Key Highlights of the Report:
- Hungary Lecithin Market Outlook
- Market Size of Hungary Lecithin Market, 2021
- Forecast of Hungary Lecithin Market, 2028
- Historical Data and Forecast of Hungary Lecithin Revenues & Volume for the Period 2018 - 2028
- Hungary Lecithin Market Trend Evolution
- Hungary Lecithin Market Drivers and Challenges
- Hungary Lecithin Price Trends
- Hungary Lecithin Porter's Five Forces
- Hungary Lecithin Industry Life Cycle
- Historical Data and Forecast of Hungary Lecithin Market Revenues & Volume By Source for the Period 2018 - 2028
- Historical Data and Forecast of Hungary Lecithin Market Revenues & Volume By Soy for the Period 2018 - 2028
- Historical Data and Forecast of Hungary Lecithin Market Revenues & Volume By Sunflower for the Period 2018 - 2028
- Historical Data and Forecast of Hungary Lecithin Market Revenues & Volume By Rapeseed for the Period 2018 - 2028
- Historical Data and Forecast of Hungary Lecithin Market Revenues & Volume By Others for the Period 2018 - 2028
- Historical Data and Forecast of Hungary Lecithin Market Revenues & Volume By End-use for the Period 2018 - 2028
- Historical Data and Forecast of Hungary Lecithin Market Revenues & Volume By Convenience Food for the Period 2018 - 2028
- Historical Data and Forecast of Hungary Lecithin Market Revenues & Volume By Bakery for the Period 2018 - 2028
- Historical Data and Forecast of Hungary Lecithin Market Revenues & Volume By Confectionary for the Period 2018 - 2028
- Historical Data and Forecast of Hungary Lecithin Market Revenues & Volume By Pharmaceutical for the Period 2018 - 2028
- Historical Data and Forecast of Hungary Lecithin Market Revenues & Volume By Personal Care And Cosmetics for the Period 2018 - 2028
- Historical Data and Forecast of Hungary Lecithin Market Revenues & Volume By Animal Feed for the Period 2018 - 2028
- Historical Data and Forecast of Hungary Lecithin Market Revenues & Volume By Other Industrial for the Period 2018 - 2028
- Historical Data and Forecast of Hungary Lecithin Market Revenues & Volume By Form for the Period 2018 - 2028
- Historical Data and Forecast of Hungary Lecithin Market Revenues & Volume By Liquid for the Period 2018 - 2028
- Historical Data and Forecast of Hungary Lecithin Market Revenues & Volume By Powder for the Period 2018 - 2028
- Historical Data and Forecast of Hungary Lecithin Market Revenues & Volume By Granules for the Period 2018 - 2028
- Hungary Lecithin Import Export Trade Statistics
- Market Opportunity Assessment By Source
- Market Opportunity Assessment By End-use
- Market Opportunity Assessment By Form
- Hungary Lecithin Top Companies Market Share
- Hungary Lecithin Competitive Benchmarking By Technical and Operational Parameters
- Hungary Lecithin Company Profiles
- Hungary Lecithin Key Strategic Recommendations
Frequently Asked Questions About the Market Study (FAQs):
6Wresearch actively monitors the Hungary Lecithin Market and publishes its comprehensive annual report, highlighting emerging trends, growth drivers, revenue analysis, and forecast outlook. Our insights help businesses to make data-backed strategic decisions with ongoing market dynamics. Our analysts track relevent industries related to the Hungary Lecithin Market, allowing our clients with actionable intelligence and reliable forecasts tailored to emerging regional needs.
Yes, we provide customisation as per your requirements. To learn more, feel free to contact us on sales@6wresearch.com
1 Executive Summary |
2 Introduction |
2.1 Key Highlights of the Report |
2.2 Report Description |
2.3 Market Scope & Segmentation |
2.4 Research Methodology |
2.5 Assumptions |
3 Hungary Lecithin Market Overview |
3.1 Hungary Country Macro Economic Indicators |
3.2 Hungary Lecithin Market Revenues & Volume, 2021 & 2028F |
3.3 Hungary Lecithin Market - Industry Life Cycle |
3.4 Hungary Lecithin Market - Porter's Five Forces |
3.5 Hungary Lecithin Market Revenues & Volume Share, By Source, 2021 & 2028F |
3.6 Hungary Lecithin Market Revenues & Volume Share, By End-use, 2021 & 2028F |
3.7 Hungary Lecithin Market Revenues & Volume Share, By Form, 2021 & 2028F |
4 Hungary Lecithin Market Dynamics |
4.1 Impact Analysis |
4.2 Market Drivers |
4.2.1 Growing demand for natural ingredients in food and beverage industry |
4.2.2 Increasing awareness about health benefits of lecithin consumption |
4.2.3 Rising adoption of lecithin in pharmaceutical and cosmetic sectors |
4.3 Market Restraints |
4.3.1 Fluctuating prices of raw materials |
4.3.2 Stringent regulations related to GMO lecithin |
4.3.3 Competition from alternative emulsifiers and additives |
5 Hungary Lecithin Market Trends |
6 Hungary Lecithin Market, By Types |
6.1 Hungary Lecithin Market, By Source |
6.1.1 Overview and Analysis |
6.1.2 Hungary Lecithin Market Revenues & Volume, By Source, 2018 - 2028F |
6.1.3 Hungary Lecithin Market Revenues & Volume, By Soy, 2018 - 2028F |
6.1.4 Hungary Lecithin Market Revenues & Volume, By Sunflower, 2018 - 2028F |
6.1.5 Hungary Lecithin Market Revenues & Volume, By Rapeseed, 2018 - 2028F |
6.1.6 Hungary Lecithin Market Revenues & Volume, By Others, 2018 - 2028F |
6.2 Hungary Lecithin Market, By End-use |
6.2.1 Overview and Analysis |
6.2.2 Hungary Lecithin Market Revenues & Volume, By Convenience Food, 2018 - 2028F |
6.2.3 Hungary Lecithin Market Revenues & Volume, By Bakery, 2018 - 2028F |
6.2.4 Hungary Lecithin Market Revenues & Volume, By Confectionary, 2018 - 2028F |
6.2.5 Hungary Lecithin Market Revenues & Volume, By Pharmaceutical, 2018 - 2028F |
6.2.6 Hungary Lecithin Market Revenues & Volume, By Personal Care And Cosmetics, 2018 - 2028F |
6.2.7 Hungary Lecithin Market Revenues & Volume, By Animal Feed, 2018 - 2028F |
6.3 Hungary Lecithin Market, By Form |
6.3.1 Overview and Analysis |
6.3.2 Hungary Lecithin Market Revenues & Volume, By Liquid, 2018 - 2028F |
6.3.3 Hungary Lecithin Market Revenues & Volume, By Powder, 2018 - 2028F |
6.3.4 Hungary Lecithin Market Revenues & Volume, By Granules, 2018 - 2028F |
7 Hungary Lecithin Market Import-Export Trade Statistics |
7.1 Hungary Lecithin Market Export to Major Countries |
7.2 Hungary Lecithin Market Imports from Major Countries |
8 Hungary Lecithin Market Key Performance Indicators |
8.1 Adoption rate of lecithin in new product launches |
8.2 Number of research studies supporting health benefits of lecithin |
8.3 Percentage of market share within specific application sectors |
9 Hungary Lecithin Market - Opportunity Assessment |
9.1 Hungary Lecithin Market Opportunity Assessment, By Source, 2021 & 2028F |
9.2 Hungary Lecithin Market Opportunity Assessment, By End-use, 2021 & 2028F |
9.3 Hungary Lecithin Market Opportunity Assessment, By Form, 2021 & 2028F |
10 Hungary Lecithin Market - Competitive Landscape |
10.1 Hungary Lecithin Market Revenue Share, By Companies, 2021 |
10.2 Hungary Lecithin Market Competitive Benchmarking, By Operating and Technical Parameters |
11 Company Profiles |
12 Recommendations |
13 Disclaimer |
Global Go To Market Strategy - 2030
Export potential enables firms to identify high-growth global markets with greater confidence by combining advanced trade intelligence with a structured quantitative methodology. The framework analyzes emerging demand trends and country-level import patterns while integrating macroeconomic and trade datasets such as GDP and population forecasts, bilateral import–export flows, tariff structures, elasticity differentials between developed and developing economies, geographic distance, and import demand projections. Using weighted trade values from 2020–2024 as the base period to project country-to-country export potential for 2030, these inputs are operationalized through calculated drivers such as gravity model parameters, tariff impact factors, and projected GDP per-capita growth. Through an analysis of hidden potentials, demand hotspots, and market conditions that are most favorable to success, this method enables firms to focus on target countries, maximize returns, and global expansion with data, backed by accuracy.
By factoring in the projected importer demand gap that is currently unmet and could be potential opportunity, it identifies the potential for the Exporter (Country) among 190 countries, against the general trade analysis, which identifies the biggest importer or exporter.
To discover high-growth global markets and optimize your business strategy:
Click Here
Pricing
- Single User License$ 1,995
- Department License$ 2,400
- Site License$ 3,120
- Global License$ 3,795

Leadership Perspectives from Industry Events
Search
Thought Leadership and Analyst Meet


Our Clients
6WResearch In News
- India Air Conditioner Market Set for Strong Rebound in 2026 After Weather-Led Correction and GST-Driven Recovery: 6Wresearch
- ADAS in India: How Automatic Emergency Braking, Blind Spot Detection & Driver Monitoring are Transforming Road Safety
- Doha a strategic location for EV manufacturing hub: IPA Qatar
- Demand for luxury TVs surging in the GCC, says Samsung
- Empowering Growth: The Thriving Journey of Bangladesh’s Cable Industry
- Demand for luxury TVs surging in the GCC, says Samsung
Latest Reports
- Nicaragua RPG Gaming Market (2026-2032)
- New Zealand RPG Gaming Market (2026-2032)
- Netherlands RPG Gaming Market (2026-2032)
- Nauru RPG Gaming Market (2026-2032)
- Namibia RPG Gaming Market (2026-2032)
- Mozambique RPG Gaming Market (2026-2032)
- Montenegro RPG Gaming Market (2026-2032)
- Mongolia RPG Gaming Market (2026-2032)
- Monaco RPG Gaming Market (2026-2032)
- Micronesia RPG Gaming Market (2026-2032)
Industry Events and Analyst Meet

HIMTEX 2026

India Refining Summit 2026

India EV Show 2026

EV tech India Expo 2026

Auto Tech Asia 2026
Whitepaper
- Middle East & Africa Commercial Security Market Click here to view more.
- Middle East & Africa Fire Safety Systems & Equipment Market Click here to view more.
- GCC Drone Market Click here to view more.
- Middle East Lighting Fixture Market Click here to view more.
- GCC Physical & Perimeter Security Market Click here to view more.