Hungary Mercury Market Outlook | Growth, Size, Value, Trends, Companies, Share, Industry, COVID-19 IMPACT, Revenue, Analysis & Forecast
Market Forecast By Application (Chemical manufacturing, Artisanal gold mining, Batteries, Dentistry, Measurement And Control Devices, Electrical and lighting, Others) And Competitive Landscape
| Product Code: ETC194251 | Publication Date: May 2022 | Updated Date: Jan 2026 | Product Type: Market Research Report | |
| Publisher: 6Wresearch | Author: Ravi Bhandari | No. of Pages: 60 | No. of Figures: 40 | No. of Tables: 7 |
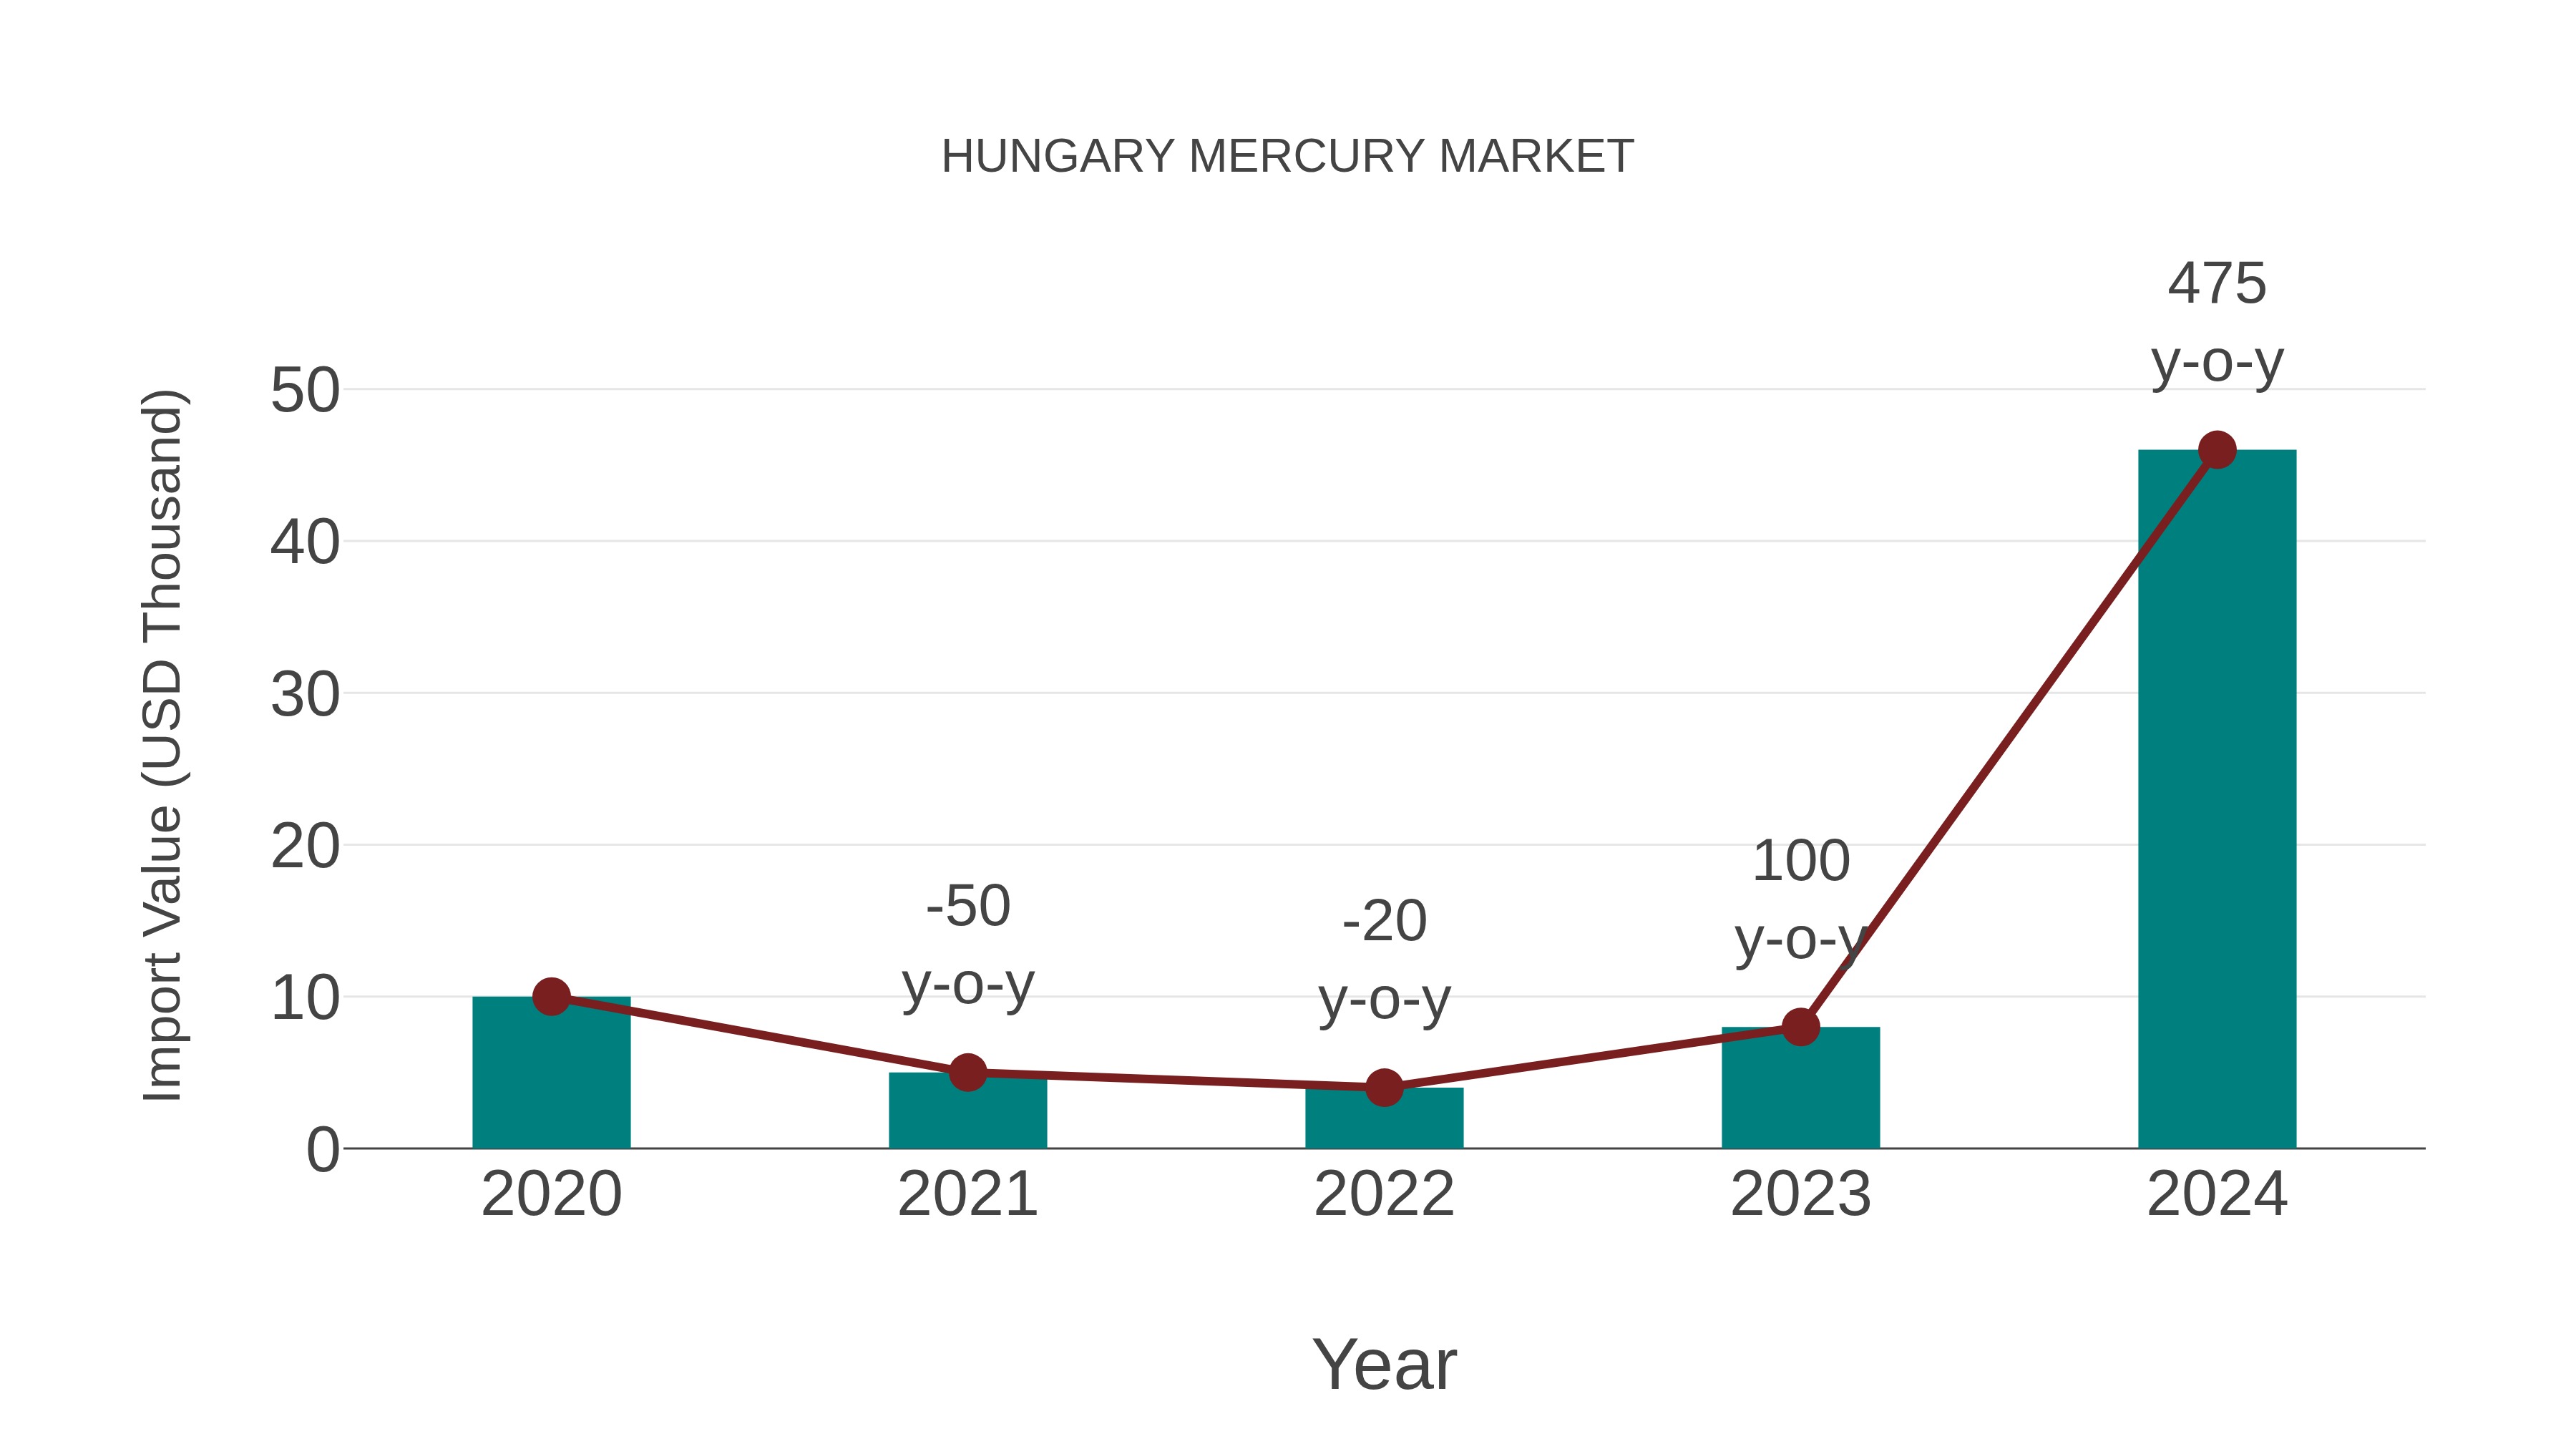
Hungary Mercury Market: Import Trend Analysis
Hungary`s import trend for mercury in 2024 experienced a substantial growth rate of 475.0% compared to 2023, with a compound annual growth rate (CAGR) of 46.45% from 2020 to 2024. This surge in imports could be attributed to a significant shift in demand for mercury-based products or changes in trade policies, impacting market dynamics.
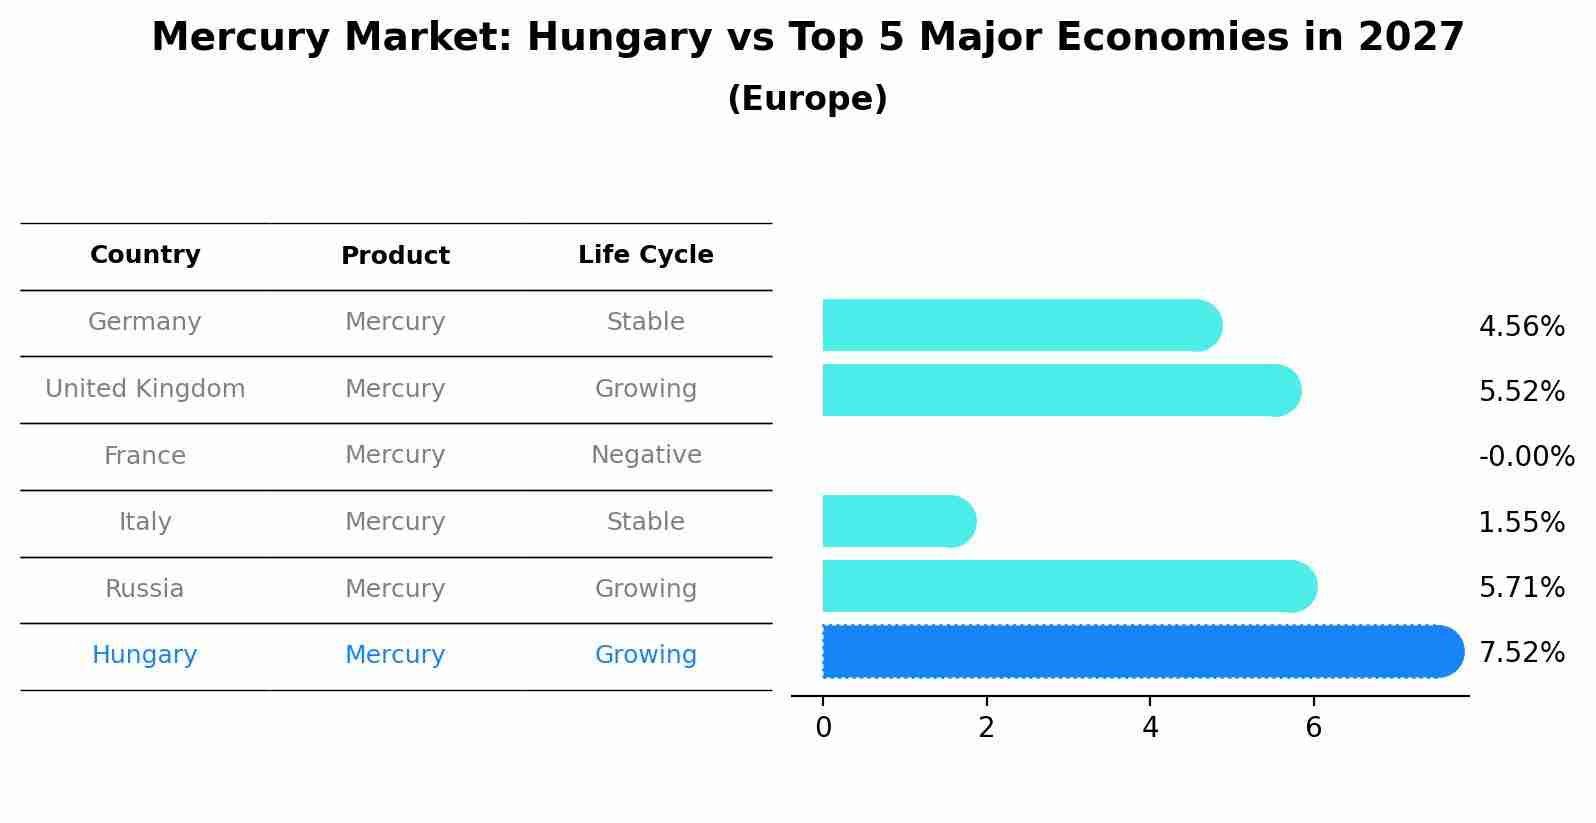
Mercury Market: Hungary vs Top 5 Major Economies in 2027 (Europe)
Hungary's Mercury market is anticipated to experience a growing growth rate of 7.52% by 2027, reflecting trends observed in the largest economy Germany, followed by United Kingdom, France, Italy and Russia.
Hungary Mercury Market Overview
The Hungary Mercury Market reflects a gradual decline due to environmental regulations restricting its use in various industries. While mercury-based products still exist, alternatives are sought after to mitigate environmental risks and health concerns.
Drivers of the market
Sustainability and environmental regulations are driving the Hungary Mercury Market. With increasing awareness about the harmful effects of mercury on human health and the environment, there`s a growing push towards mercury-free alternatives across various industries. Government regulations aimed at reducing mercury emissions and waste disposal are further propelling the market, encouraging industries to adopt safer and more sustainable practices.
Challenges of the market
Despite efforts to reduce its usage globally, mercury remains a concern in Hungary market due to its persistence in certain industrial processes and products. The challenge lies in effectively regulating its use to minimize environmental and health risks while ensuring industries can still operate efficiently.
Government Policy of the market
The Hungary government has implemented stringent regulations regarding the use and disposal of mercury due to its toxic nature. These regulations aim to minimize environmental contamination and protect public health. Measures include strict monitoring of industrial emissions, restrictions on mercury-containing products, and promoting the use of mercury-free alternatives. Additionally, Hungary actively participates in international agreements and initiatives aimed at reducing mercury pollution, such as the Minamata Convention.
Key Highlights of the Report:
- Hungary Mercury Market Outlook
- Market Size of Hungary Mercury Market, 2021
- Forecast of Hungary Mercury Market, 2028
- Historical Data and Forecast of Hungary Mercury Revenues & Volume for the Period 2018 - 2028
- Hungary Mercury Market Trend Evolution
- Hungary Mercury Market Drivers and Challenges
- Hungary Mercury Price Trends
- Hungary Mercury Porter's Five Forces
- Hungary Mercury Industry Life Cycle
- Historical Data and Forecast of Hungary Mercury Market Revenues & Volume By Application for the Period 2018 - 2028
- Historical Data and Forecast of Hungary Mercury Market Revenues & Volume By Chemical manufacturing for the Period 2018 - 2028
- Historical Data and Forecast of Hungary Mercury Market Revenues & Volume By Artisanal gold mining for the Period 2018 - 2028
- Historical Data and Forecast of Hungary Mercury Market Revenues & Volume By Batteries for the Period 2018 - 2028
- Historical Data and Forecast of Hungary Mercury Market Revenues & Volume By Dentistry for the Period 2018 - 2028
- Historical Data and Forecast of Hungary Mercury Market Revenues & Volume By Measurement And Control Devices for the Period 2018 - 2028
- Historical Data and Forecast of Hungary Mercury Market Revenues & Volume By Electrical and lighting for the Period 2018 - 2028
- Historical Data and Forecast of Hungary Mercury Market Revenues & Volume By Others for the Period 2018 - 2028
- Hungary Mercury Import Export Trade Statistics
- Market Opportunity Assessment By Application
- Hungary Mercury Top Companies Market Share
- Hungary Mercury Competitive Benchmarking By Technical and Operational Parameters
- Hungary Mercury Company Profiles
- Hungary Mercury Key Strategic Recommendations
Frequently Asked Questions About the Market Study (FAQs):
6Wresearch actively monitors the Hungary Mercury Market and publishes its comprehensive annual report, highlighting emerging trends, growth drivers, revenue analysis, and forecast outlook. Our insights help businesses to make data-backed strategic decisions with ongoing market dynamics. Our analysts track relevent industries related to the Hungary Mercury Market, allowing our clients with actionable intelligence and reliable forecasts tailored to emerging regional needs.
Yes, we provide customisation as per your requirements. To learn more, feel free to contact us on sales@6wresearch.com
1 Executive Summary |
2 Introduction |
2.1 Key Highlights of the Report |
2.2 Report Description |
2.3 Market Scope & Segmentation |
2.4 Research Methodology |
2.5 Assumptions |
3 Hungary Mercury Market Overview |
3.1 Hungary Country Macro Economic Indicators |
3.2 Hungary Mercury Market Revenues & Volume, 2021 & 2028F |
3.3 Hungary Mercury Market - Industry Life Cycle |
3.4 Hungary Mercury Market - Porter's Five Forces |
3.5 Hungary Mercury Market Revenues & Volume Share, By Application, 2021 & 2028F |
4 Hungary Mercury Market Dynamics |
4.1 Impact Analysis |
4.2 Market Drivers |
4.2.1 Increasing demand for mercury in the healthcare sector for manufacturing thermometers, dental amalgams, and pharmaceuticals. |
4.2.2 Growing usage of mercury in the electronics industry for making fluorescent lamps, switches, and batteries. |
4.2.3 Rising environmental regulations pushing for the use of mercury in industrial processes to be monitored and managed effectively. |
4.3 Market Restraints |
4.3.1 Health and environmental concerns associated with mercury exposure leading to stricter regulations and bans on mercury-containing products. |
4.3.2 Availability of alternative materials and technologies reducing the demand for mercury in certain applications. |
5 Hungary Mercury Market Trends |
6 Hungary Mercury Market, By Types |
6.1 Hungary Mercury Market, By Application |
6.1.1 Overview and Analysis |
6.1.2 Hungary Mercury Market Revenues & Volume, By Application, 2018 - 2028F |
6.1.3 Hungary Mercury Market Revenues & Volume, By Chemical manufacturing, 2018 - 2028F |
6.1.4 Hungary Mercury Market Revenues & Volume, By Artisanal gold mining, 2018 - 2028F |
6.1.5 Hungary Mercury Market Revenues & Volume, By Batteries, 2018 - 2028F |
6.1.6 Hungary Mercury Market Revenues & Volume, By Dentistry, 2018 - 2028F |
6.1.7 Hungary Mercury Market Revenues & Volume, By Measurement And Control Devices, 2018 - 2028F |
6.1.8 Hungary Mercury Market Revenues & Volume, By Electrical and lighting, 2018 - 2028F |
7 Hungary Mercury Market Import-Export Trade Statistics |
7.1 Hungary Mercury Market Export to Major Countries |
7.2 Hungary Mercury Market Imports from Major Countries |
8 Hungary Mercury Market Key Performance Indicators |
8.1 Environmental impact indicators such as mercury emissions levels and pollution control measures. |
8.2 Adoption rate of mercury monitoring and management technologies in industrial sectors. |
8.3 Research and development investments in mercury-free products and processes. |
8.4 Compliance rates with mercury-related regulations and standards. |
8.5 Public awareness and perception of mercury-related risks and sustainability efforts. |
9 Hungary Mercury Market - Opportunity Assessment |
9.1 Hungary Mercury Market Opportunity Assessment, By Application, 2021 & 2028F |
10 Hungary Mercury Market - Competitive Landscape |
10.1 Hungary Mercury Market Revenue Share, By Companies, 2021 |
10.2 Hungary Mercury Market Competitive Benchmarking, By Operating and Technical Parameters |
11 Company Profiles |
12 Recommendations |
13 Disclaimer |
Global Go To Market Strategy - 2030
Export potential enables firms to identify high-growth global markets with greater confidence by combining advanced trade intelligence with a structured quantitative methodology. The framework analyzes emerging demand trends and country-level import patterns while integrating macroeconomic and trade datasets such as GDP and population forecasts, bilateral import–export flows, tariff structures, elasticity differentials between developed and developing economies, geographic distance, and import demand projections. Using weighted trade values from 2020–2024 as the base period to project country-to-country export potential for 2030, these inputs are operationalized through calculated drivers such as gravity model parameters, tariff impact factors, and projected GDP per-capita growth. Through an analysis of hidden potentials, demand hotspots, and market conditions that are most favorable to success, this method enables firms to focus on target countries, maximize returns, and global expansion with data, backed by accuracy.
By factoring in the projected importer demand gap that is currently unmet and could be potential opportunity, it identifies the potential for the Exporter (Country) among 190 countries, against the general trade analysis, which identifies the biggest importer or exporter.
To discover high-growth global markets and optimize your business strategy:
Click Here
Pricing
- Single User License$ 1,995
- Department License$ 2,400
- Site License$ 3,120
- Global License$ 3,795

Leadership Perspectives from Industry Events
Search
Thought Leadership and Analyst Meet


Our Clients
6WResearch In News
- India Export Attractiveness Tracker 2026
- India Air Conditioner Market Set for Strong Rebound in 2026 After Weather-Led Correction and GST-Driven Recovery: 6Wresearch
- ADAS in India: How Automatic Emergency Braking, Blind Spot Detection & Driver Monitoring are Transforming Road Safety
- Doha a strategic location for EV manufacturing hub: IPA Qatar
- Demand for luxury TVs surging in the GCC, says Samsung
- Empowering Growth: The Thriving Journey of Bangladesh’s Cable Industry
Latest Reports
- Nicaragua RPG Gaming Market (2026-2032)
- New Zealand RPG Gaming Market (2026-2032)
- Netherlands RPG Gaming Market (2026-2032)
- Nauru RPG Gaming Market (2026-2032)
- Namibia RPG Gaming Market (2026-2032)
- Mozambique RPG Gaming Market (2026-2032)
- Montenegro RPG Gaming Market (2026-2032)
- Mongolia RPG Gaming Market (2026-2032)
- Monaco RPG Gaming Market (2026-2032)
- Micronesia RPG Gaming Market (2026-2032)
Industry Events and Analyst Meet

EV India Expo 2026

HIMTEX 2026

India Refining Summit 2026

India EV Show 2026

EV tech India Expo 2026
Whitepaper
- Middle East & Africa Commercial Security Market Click here to view more.
- Middle East & Africa Fire Safety Systems & Equipment Market Click here to view more.
- GCC Drone Market Click here to view more.
- Middle East Lighting Fixture Market Click here to view more.
- GCC Physical & Perimeter Security Market Click here to view more.