India Flavored Candy Market (2025-2031) | Forecast, Competitive Landscape, Segmentation, Outlook, Trends, Analysis, Size & Revenue, Growth, Share, Industry, Value, Companies
Market Forecast By Flavor (Fruit Flavored, Chocolate, Caramel, Butterscotch, Cinnamon, Coffee, Licorice, Sour), By Type (Hard Boiled Candies, Pastilles, Gums, Jellies and Chews, Toffees, Caramels and Nougat, Mints), By Distribution Channel (Supermarkets and Hypermarkets, Convenience Stores, Specialist Retailers, Online Retail) And Competitive Landscape
| Product Code: ETC7543514 | Publication Date: Sep 2024 | Updated Date: Nov 2025 | Product Type: Market Research Report | |
| Publisher: 6Wresearch | Author: Summon Dutta | No. of Pages: 75 | No. of Figures: 35 | No. of Tables: 20 |
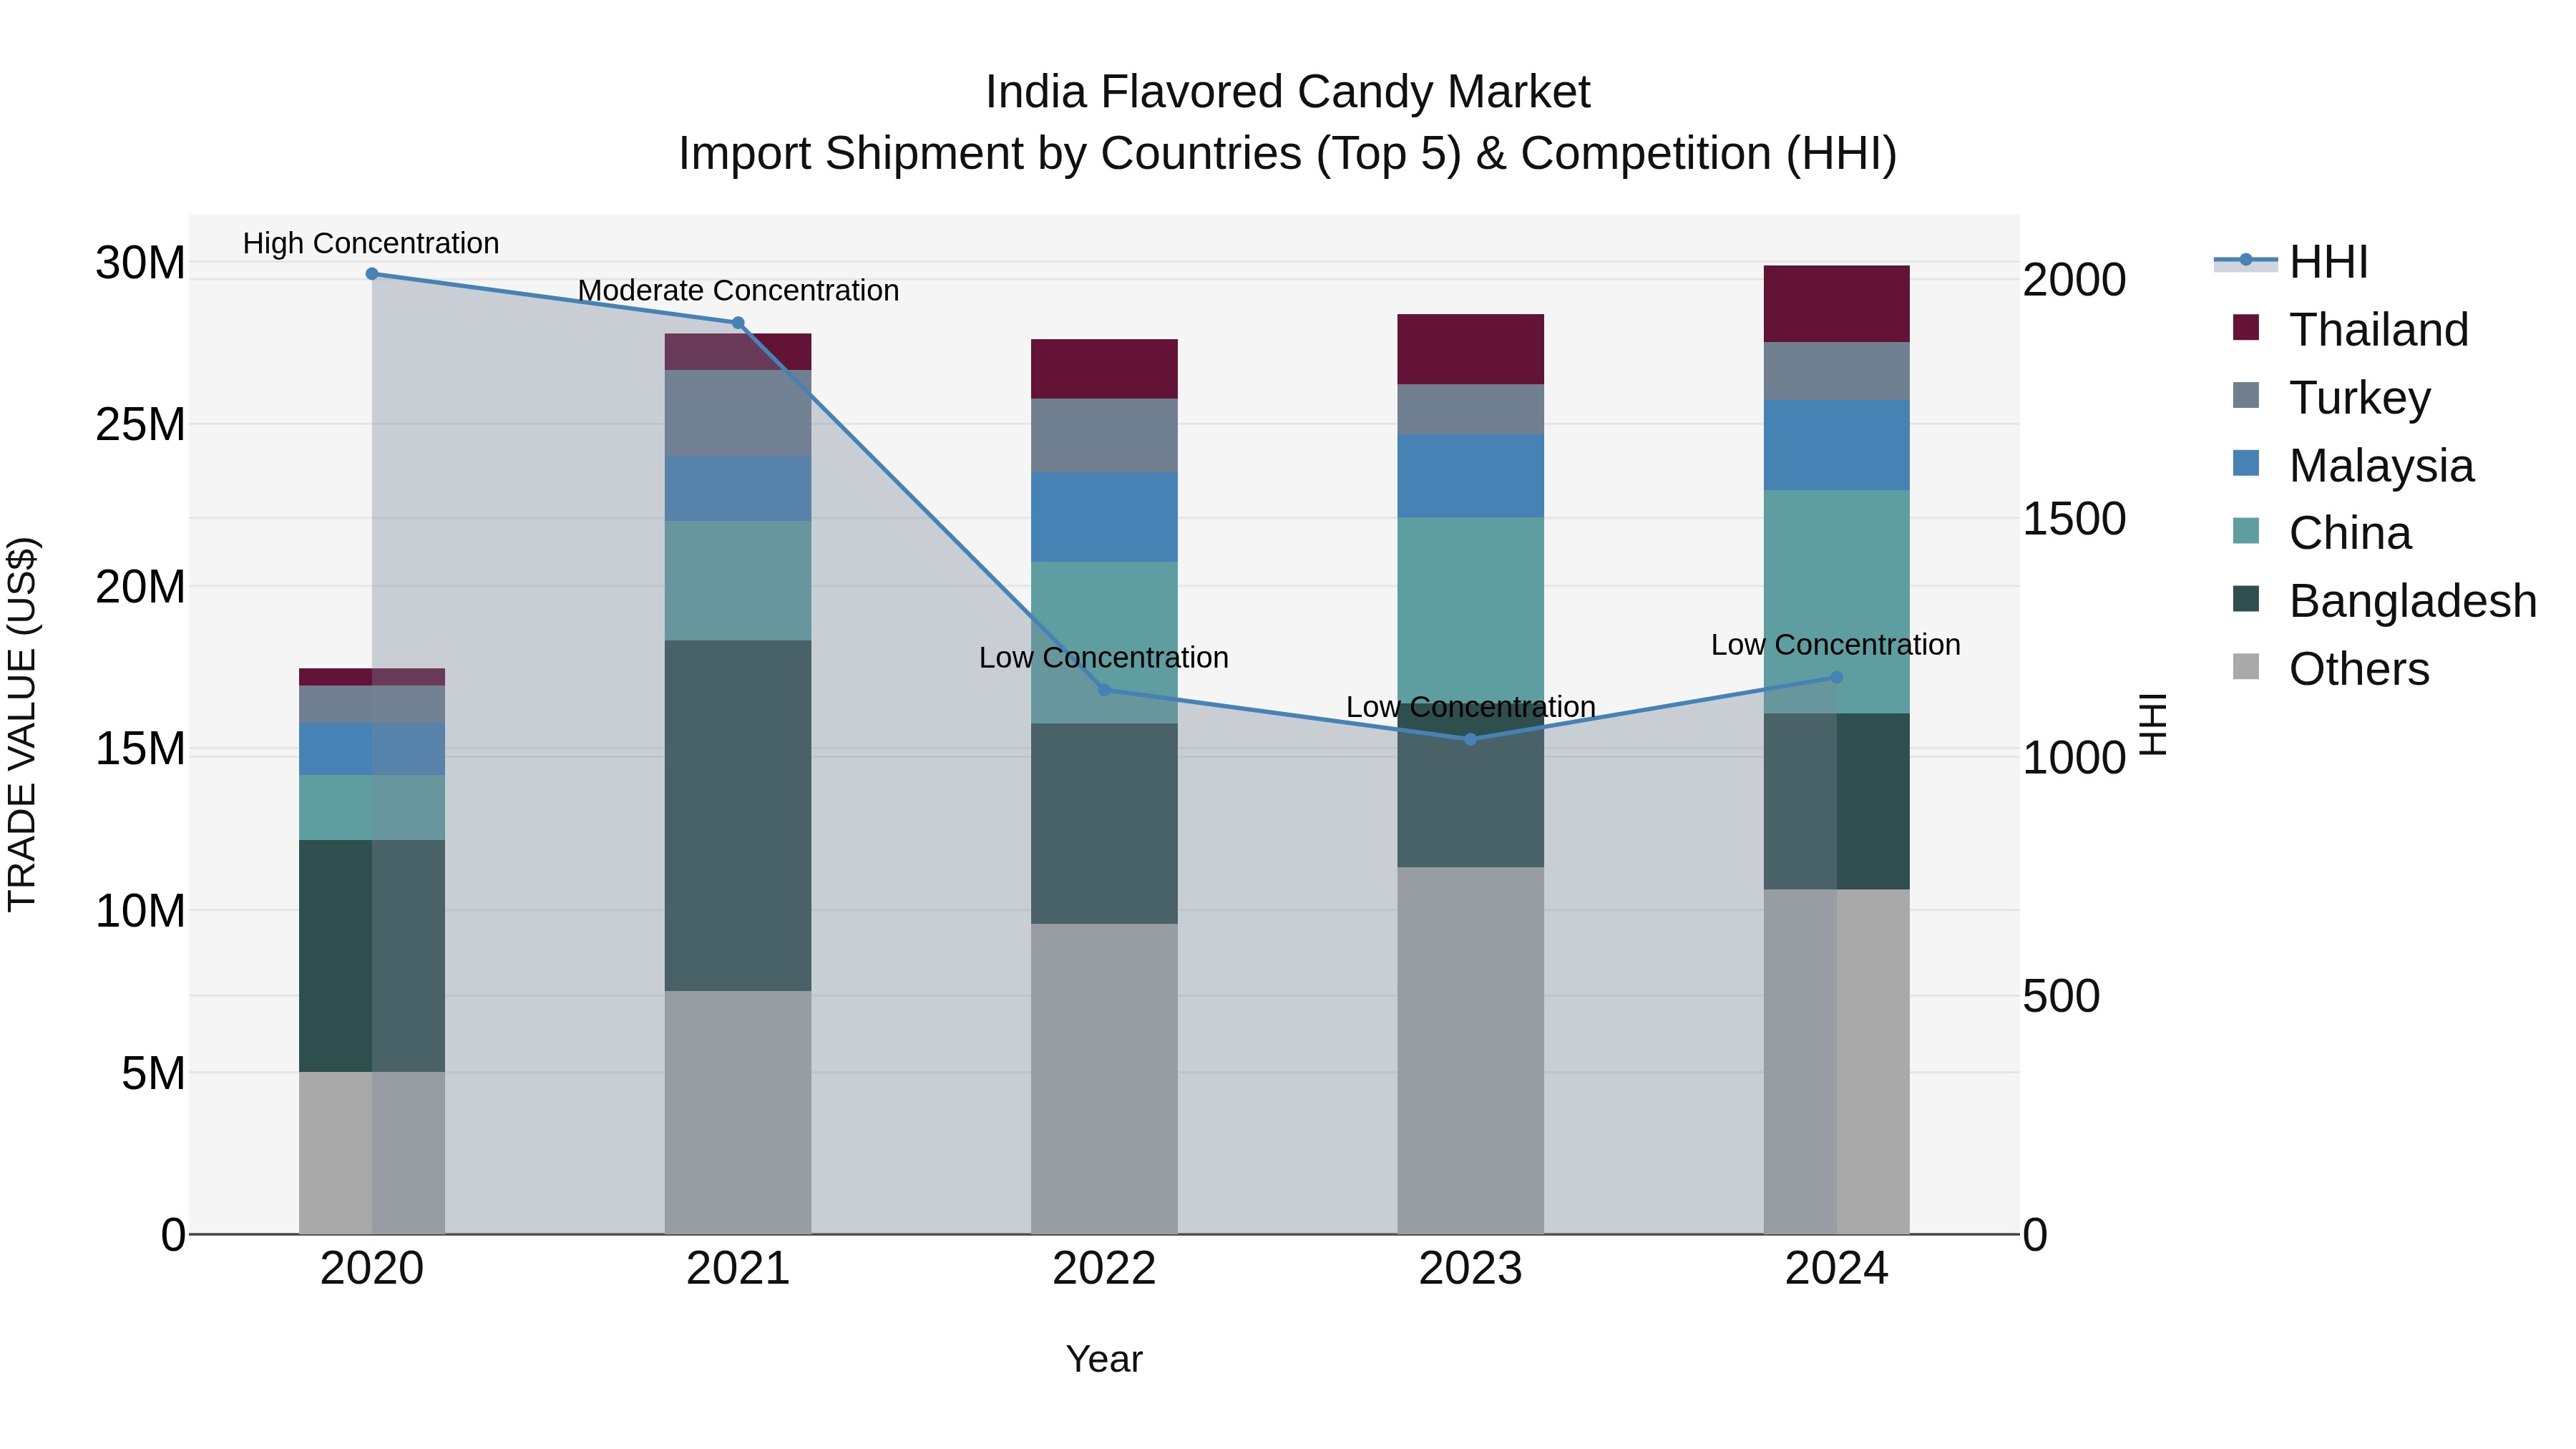
India Flavored Candy Market Top 5 Importing Countries and Market Competition (HHI) Analysis
India has seen a surge in flavored candy imports in 2024, with top exporters being China, Bangladesh, Malaysia, Thailand, and Turkey. Despite the diverse sources, the market remains competitive with low concentration levels indicated by the Herfindahl-Hirschman Index (HHI). The compound annual growth rate (CAGR) from 2020 to 2024 stands at an impressive 14.38%, showcasing a robust upward trend. Additionally, the growth rate from 2023 to 2024 is a noteworthy 5.29%, indicating sustained momentum in the importation of India flavored candies.
Key Highlights of the Report:
- India Flavored Candy Market Outlook
- Market Size of India Flavored Candy Market, 2024
- Forecast of India Flavored Candy Market, 2031
- Historical Data and Forecast of India Flavored Candy Revenues & Volume for the Period 2021- 2031
- India Flavored Candy Market Trend Evolution
- India Flavored Candy Market Drivers and Challenges
- India Flavored Candy Price Trends
- India Flavored Candy Porter's Five Forces
- India Flavored Candy Industry Life Cycle
- Historical Data and Forecast of India Flavored Candy Market Revenues & Volume By Flavor for the Period 2021- 2031
- Historical Data and Forecast of India Flavored Candy Market Revenues & Volume By Fruit Flavored for the Period 2021- 2031
- Historical Data and Forecast of India Flavored Candy Market Revenues & Volume By Chocolate for the Period 2021- 2031
- Historical Data and Forecast of India Flavored Candy Market Revenues & Volume By Caramel for the Period 2021- 2031
- Historical Data and Forecast of India Flavored Candy Market Revenues & Volume By Butterscotch for the Period 2021- 2031
- Historical Data and Forecast of India Flavored Candy Market Revenues & Volume By Cinnamon for the Period 2021- 2031
- Historical Data and Forecast of India Flavored Candy Market Revenues & Volume By Coffee for the Period 2021- 2031
- Historical Data and Forecast of India Flavored Candy Market Revenues & Volume By Licorice for the Period 2021- 2031
- Historical Data and Forecast of India Fruit Flavored Flavored Candy Market Revenues & Volume By Sour for the Period 2021- 2031
- Historical Data and Forecast of India Flavored Candy Market Revenues & Volume By Type for the Period 2021- 2031
- Historical Data and Forecast of India Flavored Candy Market Revenues & Volume By Hard Boiled Candies for the Period 2021- 2031
- Historical Data and Forecast of India Flavored Candy Market Revenues & Volume By Pastilles for the Period 2021- 2031
- Historical Data and Forecast of India Flavored Candy Market Revenues & Volume By Gums for the Period 2021- 2031
- Historical Data and Forecast of India Flavored Candy Market Revenues & Volume By Jellies and Chews for the Period 2021- 2031
- Historical Data and Forecast of India Flavored Candy Market Revenues & Volume By Toffees for the Period 2021- 2031
- Historical Data and Forecast of India Flavored Candy Market Revenues & Volume By Caramels and Nougat for the Period 2021- 2031
- Historical Data and Forecast of India Flavored Candy Market Revenues & Volume By Mints for the Period 2021- 2031
- Historical Data and Forecast of India Flavored Candy Market Revenues & Volume By Distribution Channel for the Period 2021- 2031
- Historical Data and Forecast of India Flavored Candy Market Revenues & Volume By Supermarkets and Hypermarkets for the Period 2021- 2031
- Historical Data and Forecast of India Flavored Candy Market Revenues & Volume By Convenience Stores for the Period 2021- 2031
- Historical Data and Forecast of India Flavored Candy Market Revenues & Volume By Specialist Retailers for the Period 2021- 2031
- Historical Data and Forecast of India Flavored Candy Market Revenues & Volume By Online Retail for the Period 2021- 2031
- India Flavored Candy Import Export Trade Statistics
- Market Opportunity Assessment By Flavor
- Market Opportunity Assessment By Type
- Market Opportunity Assessment By Distribution Channel
- India Flavored Candy Top Companies Market Share
- India Flavored Candy Competitive Benchmarking By Technical and Operational Parameters
- India Flavored Candy Company Profiles
- India Flavored Candy Key Strategic Recommendations
Frequently Asked Questions About the Market Study (FAQs):
6Wresearch actively monitors the India Flavored Candy Market and publishes its comprehensive annual report, highlighting emerging trends, growth drivers, revenue analysis, and forecast outlook. Our insights help businesses to make data-backed strategic decisions with ongoing market dynamics. Our analysts track relevent industries related to the India Flavored Candy Market, allowing our clients with actionable intelligence and reliable forecasts tailored to emerging regional needs.
Yes, we provide customisation as per your requirements. To learn more, feel free to contact us on sales@6wresearch.com
1 Executive Summary |
2 Introduction |
2.1 Key Highlights of the Report |
2.2 Report Description |
2.3 Market Scope & Segmentation |
2.4 Research Methodology |
2.5 Assumptions |
3 India Flavored Candy Market Overview |
3.1 India Country Macro Economic Indicators |
3.2 India Flavored Candy Market Revenues & Volume, 2021 & 2031F |
3.3 India Flavored Candy Market - Industry Life Cycle |
3.4 India Flavored Candy Market - Porter's Five Forces |
3.5 India Flavored Candy Market Revenues & Volume Share, By Flavor, 2021 & 2031F |
3.6 India Flavored Candy Market Revenues & Volume Share, By Type, 2021 & 2031F |
3.7 India Flavored Candy Market Revenues & Volume Share, By Distribution Channel, 2021 & 2031F |
4 India Flavored Candy Market Dynamics |
4.1 Impact Analysis |
4.2 Market Drivers |
4.2.1 Increasing disposable income of consumers in India leading to higher spending on confectionery products. |
4.2.2 Growing urbanization and changing lifestyles, resulting in increased demand for convenient and on-the-go snacking options like flavored candies. |
4.2.3 Rising awareness about hygiene and quality standards among consumers, driving preference for branded and packaged flavored candies. |
4.3 Market Restraints |
4.3.1 Intense competition among existing players in the flavored candy market, leading to price wars and margin pressures. |
4.3.2 Fluctuations in raw material prices impacting production costs and profitability of flavored candy manufacturers. |
4.3.3 Stringent government regulations related to food safety and labeling requirements, increasing compliance costs for market players. |
5 India Flavored Candy Market Trends |
6 India Flavored Candy Market, By Types |
6.1 India Flavored Candy Market, By Flavor |
6.1.1 Overview and Analysis |
6.1.2 India Flavored Candy Market Revenues & Volume, By Flavor, 2021- 2031F |
6.1.3 India Flavored Candy Market Revenues & Volume, By Fruit Flavored, 2021- 2031F |
6.1.4 India Flavored Candy Market Revenues & Volume, By Chocolate, 2021- 2031F |
6.1.5 India Flavored Candy Market Revenues & Volume, By Caramel, 2021- 2031F |
6.1.6 India Flavored Candy Market Revenues & Volume, By Butterscotch, 2021- 2031F |
6.1.7 India Flavored Candy Market Revenues & Volume, By Sour, 2021- 2031F |
6.1.8 India Flavored Candy Market Revenues & Volume, By Peanut Butter, 2021- 2031F |
6.2 India Flavored Candy Market, By Type |
6.2.1 Overview and Analysis |
6.2.2 India Flavored Candy Market Revenues & Volume, By Hard Boiled Candies, 2021- 2031F |
6.2.3 India Flavored Candy Market Revenues & Volume, By Pastilles, 2021- 2031F |
6.2.4 India Flavored Candy Market Revenues & Volume, By Gums, 2021- 2031F |
6.2.5 India Flavored Candy Market Revenues & Volume, By Jellies and Chews, 2021- 2031F |
6.2.6 India Flavored Candy Market Revenues & Volume, By Toffees, 2021- 2031F |
6.2.7 India Flavored Candy Market Revenues & Volume, By Mints, 2021- 2031F |
6.3 India Flavored Candy Market, By Distribution Channel |
6.3.1 Overview and Analysis |
6.3.2 India Flavored Candy Market Revenues & Volume, By Supermarkets and Hypermarkets, 2021- 2031F |
6.3.3 India Flavored Candy Market Revenues & Volume, By Convenience Stores, 2021- 2031F |
6.3.4 India Flavored Candy Market Revenues & Volume, By Specialist Retailers, 2021- 2031F |
6.3.5 India Flavored Candy Market Revenues & Volume, By Online Retail, 2021- 2031F |
6.3.6 India Flavored Candy Market Revenues & Volume, By Others, 2021- 2031F |
7 India Flavored Candy Market Import-Export Trade Statistics |
7.1 India Flavored Candy Market Export to Major Countries |
7.2 India Flavored Candy Market Imports from Major Countries |
8 India Flavored Candy Market Key Performance Indicators |
8.1 Consumer engagement metrics such as social media interactions, website traffic, and brand mentions indicating the level of consumer interest and engagement with flavored candy brands. |
8.2 New product innovation rate, measured by the number of new flavors or variants launched within a specific period, reflecting the market's dynamism and response to changing consumer preferences. |
8.3 Distribution network expansion metrics like the number of new retail outlets or online channels added, showcasing the market penetration and accessibility of flavored candies to consumers. |
9 India Flavored Candy Market - Opportunity Assessment |
9.1 India Flavored Candy Market Opportunity Assessment, By Flavor, 2021 & 2031F |
9.2 India Flavored Candy Market Opportunity Assessment, By Type, 2021 & 2031F |
9.3 India Flavored Candy Market Opportunity Assessment, By Distribution Channel, 2021 & 2031F |
10 India Flavored Candy Market - Competitive Landscape |
10.1 India Flavored Candy Market Revenue Share, By Companies, 2024 |
10.2 India Flavored Candy Market Competitive Benchmarking, By Operating and Technical Parameters |
11 Company Profiles |
12 Recommendations |
13 Disclaimer |
Export potential assessment - trade Analytics for 2030
Export potential enables firms to identify high-growth global markets with greater confidence by combining advanced trade intelligence with a structured quantitative methodology. The framework analyzes emerging demand trends and country-level import patterns while integrating macroeconomic and trade datasets such as GDP and population forecasts, bilateral import–export flows, tariff structures, elasticity differentials between developed and developing economies, geographic distance, and import demand projections. Using weighted trade values from 2020–2024 as the base period to project country-to-country export potential for 2030, these inputs are operationalized through calculated drivers such as gravity model parameters, tariff impact factors, and projected GDP per-capita growth. Through an analysis of hidden potentials, demand hotspots, and market conditions that are most favorable to success, this method enables firms to focus on target countries, maximize returns, and global expansion with data, backed by accuracy.
By factoring in the projected importer demand gap that is currently unmet and could be potential opportunity, it identifies the potential for the Exporter (Country) among 190 countries, against the general trade analysis, which identifies the biggest importer or exporter.
To discover high-growth global markets and optimize your business strategy:
Click Here
Pricing
- Single User License$ 1,995
- Department License$ 2,400
- Site License$ 3,120
- Global License$ 3,795

Search
Thought Leadership and Analyst Meet


Our Clients
Latest Reports
- Taiwan Food Delivery Platform Market (2026-2032) | Companies, Outlook, Analysis, Trends, Value, Revenue, Segmentation, Share, Forecast, Competitive Landscape, Growth, Size & Forecast
- United Kingdom (UK) Long-term Care Insurance Market (2026-2032) | Growth, Share, Consumer Insights, Drivers, Opportunities, Competition, Pricing Analysis, Segments, Restraints, Companies, Competitive, Value, Outlook, Size, Demand, Analysis, Challenges, Strategic Insights, Investment Trends, Revenue, Trends, Supply, Forecast
- United Kingdom (UK) Long Term Care Market (2026-2032) | Companies, Outlook, Analysis, Trends, Value, Revenue, Segmentation, Share, Forecast, Competitive Landscape, Growth, Size & Forecast
- Iraq Insulation and Waterproofing Market (2026-2032) | Outlook, Drivers, Growth, Size, Share, Industry, Revenue, Trends, Demand, Competitive, Strategic Insights, Opportunities, Segments, Companies, Challenges, Strategy, Consumer Insights, Analysis, Investment Trends, Value, Segmentation, Forecast, Restraints
- India Switchgear Market Outlook (2026-2032) | Size, Share, Trends, Growth, Revenue, Forecast, Analysis, Value, Outlook
- Pakistan Contraceptive Implants Market (2025-2031) | Demand, Growth, Size, Share, Industry, Pricing Analysis, Competitive, Strategic Insights, Strategy, Consumer Insights, Analysis, Investment Trends, Opportunities, Revenue, Segments, Value, Segmentation, Supply, Forecast, Restraints, Outlook, Competition, Drivers, Trends, Companies, Challenges
- Sri Lanka Packaging Market (2026-2032) | Outlook, Competition, Drivers, Trends, Demand, Pricing Analysis, Competitive, Strategic Insights, Companies, Challenges, Strategy, Consumer Insights, Analysis, Investment Trends, Opportunities, Growth, Size, Share, Industry, Revenue, Segments, Value, Segmentation, Supply, Forecast, Restraints
- India Kids Watches Market (2026-2032) | Strategy, Consumer Insights, Analysis, Investment Trends, Opportunities, Growth, Size, Share, Industry, Revenue, Segments, Value, Segmentation, Supply, Forecast, Restraints, Outlook, Competition, Drivers, Trends, Demand, Pricing Analysis, Competitive, Strategic Insights, Companies, Challenges
- Saudi Arabia Core Assurance Service Market (2025-2031) | Strategy, Consumer Insights, Analysis, Investment Trends, Opportunities, Growth, Size, Share, Industry, Revenue, Segments, Value, Segmentation, Supply, Forecast, Restraints, Outlook, Competition, Drivers, Trends, Demand, Pricing Analysis, Competitive, Strategic Insights, Companies, Challenges
- Romania Uninterruptible Power Supply (UPS) Market (2026-2032) | Industry, Analysis, Revenue, Size, Forecast, Outlook, Value, Trends, Share, Growth & Companies
Industry Events and Analyst Meet

India EV Show 2026

EV tech India Expo 2026

Auto Tech Asia 2026

Battery Tech India 2026

Smart Production Solutions Guangzhou 2026
Whitepaper
- Middle East & Africa Commercial Security Market Click here to view more.
- Middle East & Africa Fire Safety Systems & Equipment Market Click here to view more.
- GCC Drone Market Click here to view more.
- Middle East Lighting Fixture Market Click here to view more.
- GCC Physical & Perimeter Security Market Click here to view more.
6WResearch In News
- Doha a strategic location for EV manufacturing hub: IPA Qatar
- Demand for luxury TVs surging in the GCC, says Samsung
- Empowering Growth: The Thriving Journey of Bangladesh’s Cable Industry
- Demand for luxury TVs surging in the GCC, says Samsung
- Video call with a traditional healer? Once unthinkable, it’s now common in South Africa
- Intelligent Buildings To Smooth GCC’s Path To Net Zero