India Interactive Tables Market (2025-2031) Outlook | Size, Industry, Growth, Trends, Companies, Forecast, Value, Share, Analysis & Revenue
Market Forecast By Technology (LCD, LED, Capacitive, Others), By Screen Size (32-65 Inch, 65 Inch & Above), By Application (Exhibition & Trade Shows, Education, Retail, Control Room, Hospitality, Transportation, Others) And Competitive Landscape
| Product Code: ETC275064 | Publication Date: Jul 2023 | Updated Date: Nov 2025 | Product Type: Market Research Report | |
| Publisher: 6Wresearch | Author: Ravi Bhandari | No. of Pages: 75 | No. of Figures: 35 | No. of Tables: 20 |
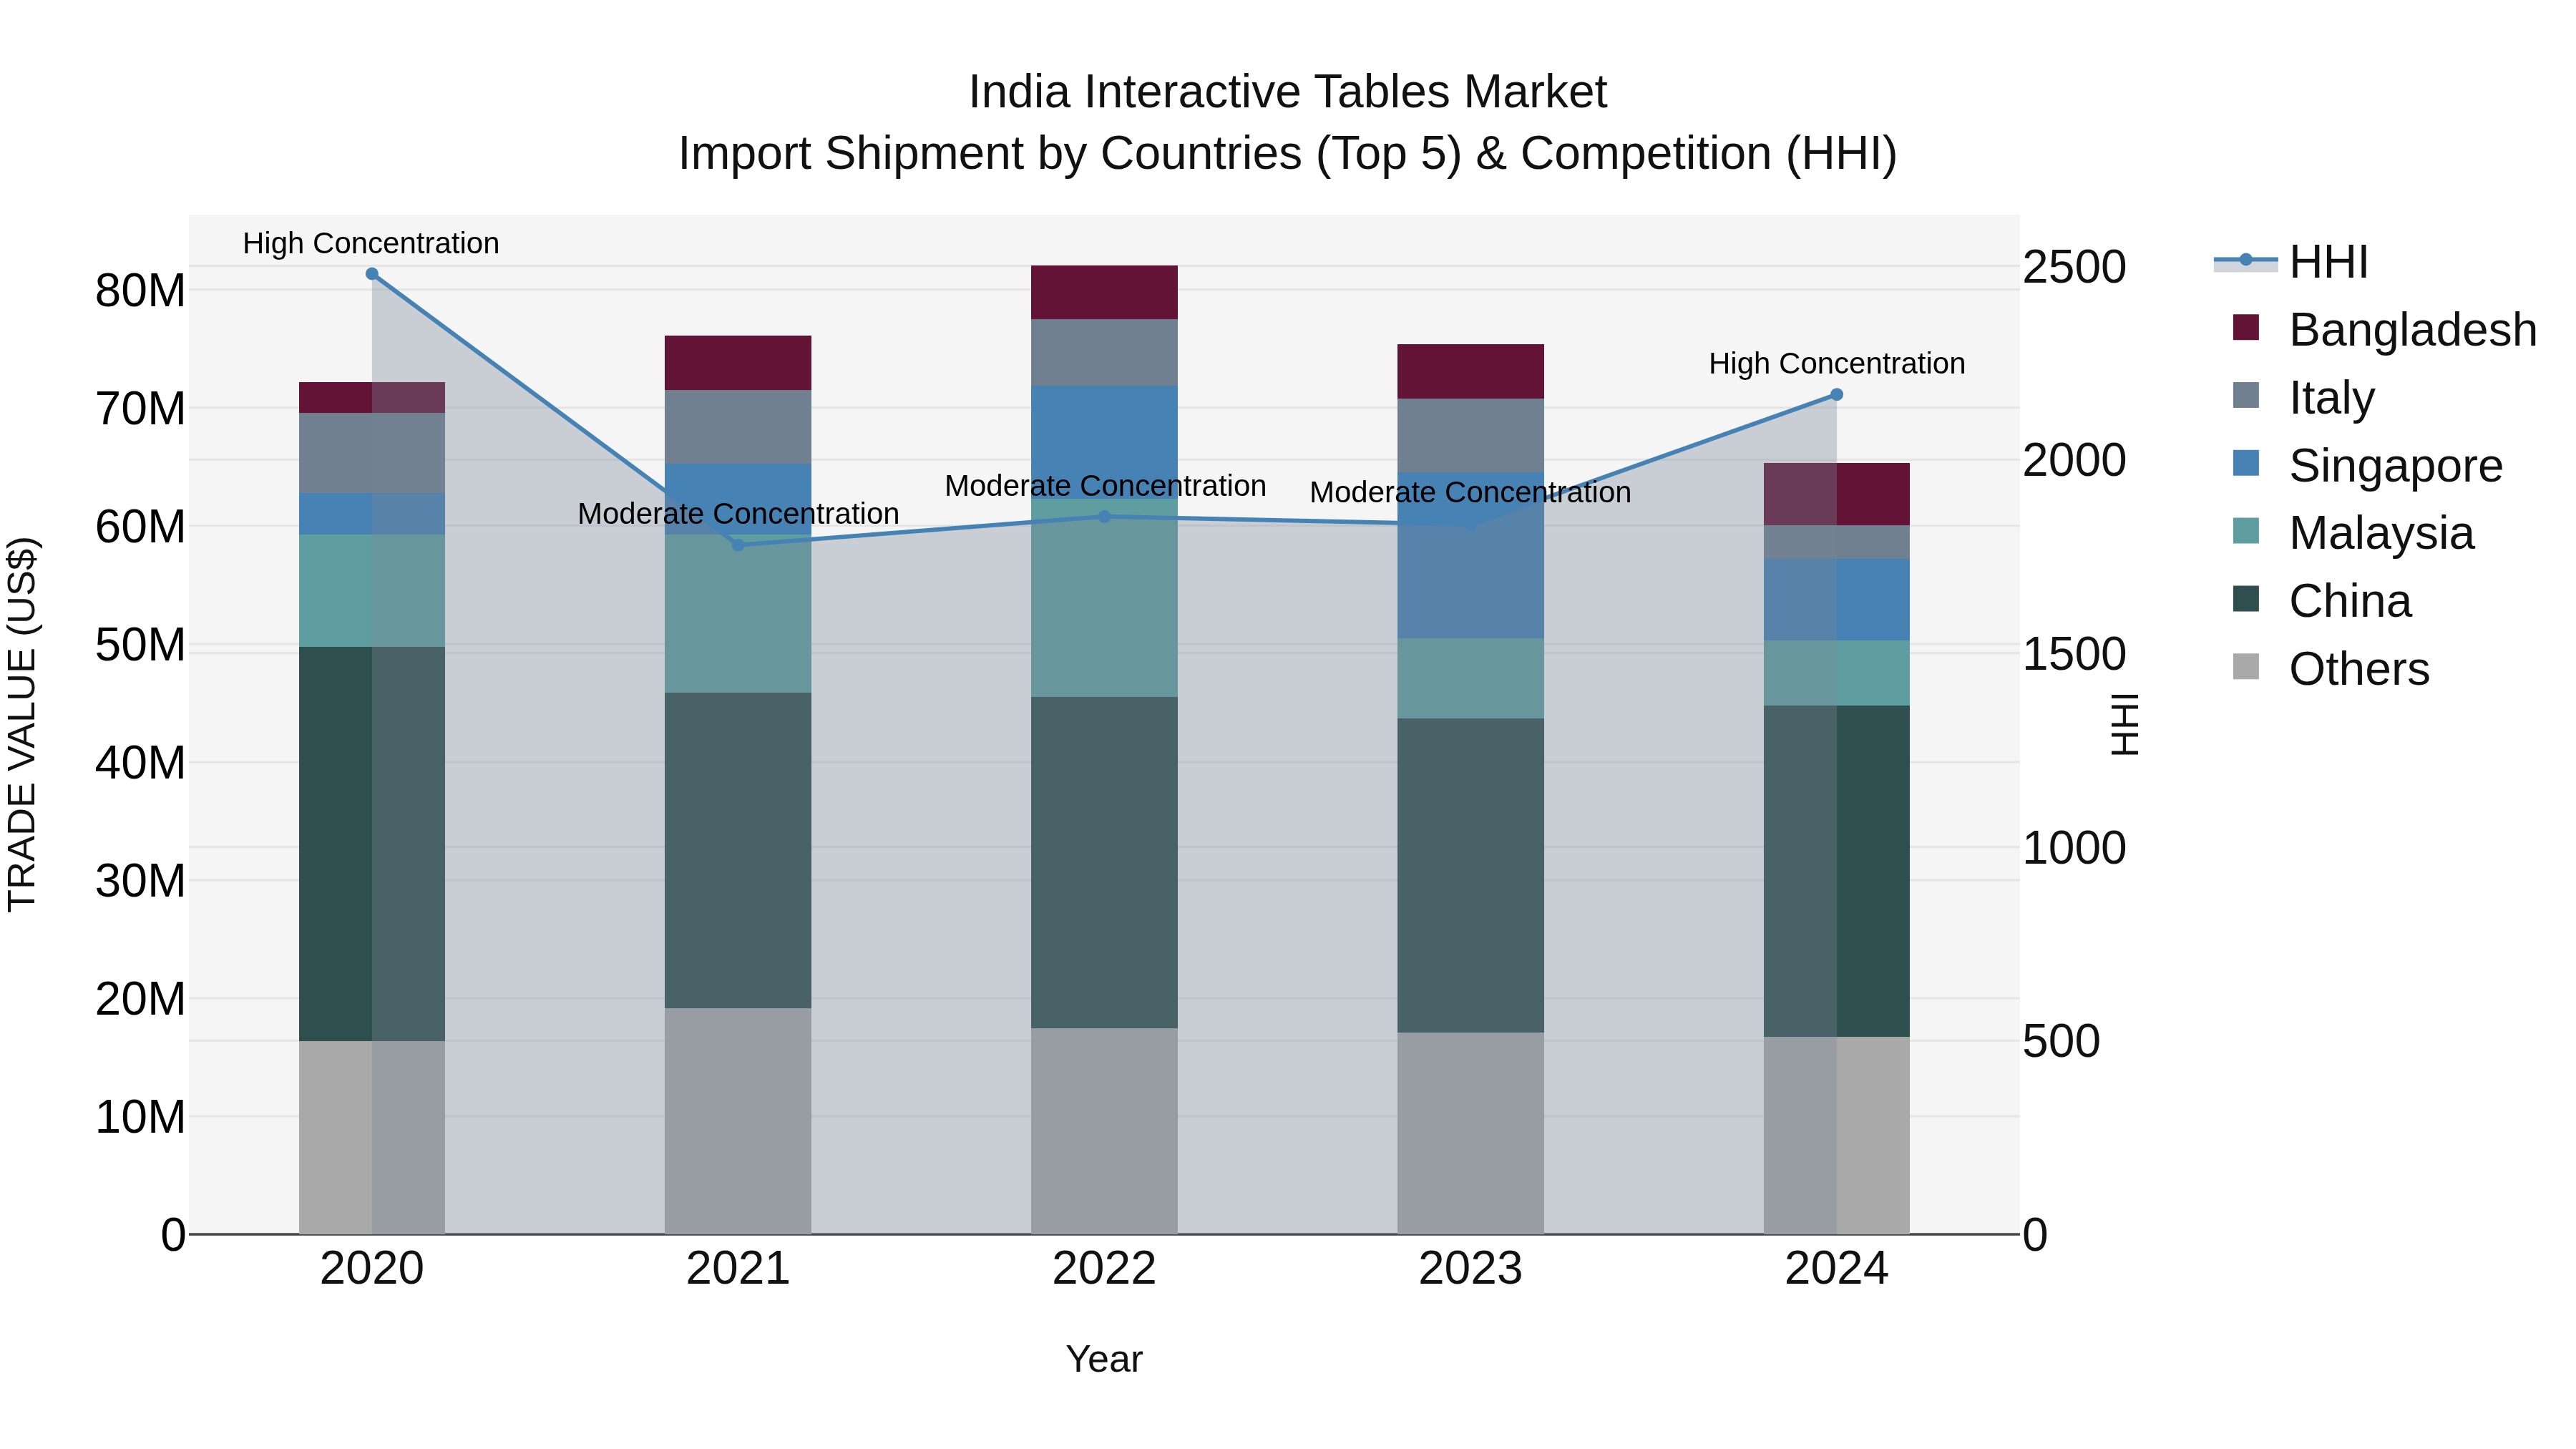
India Interactive Tables Market Top 5 Importing Countries and Market Competition (HHI) Analysis
India`s import shipments of interactive tables in 2024 saw top exporting countries like China, Singapore, Malaysia, Bangladesh, and Sri Lanka. The market concentration, as measured by the Herfindahl-Hirschman Index (HHI), shifted from moderate in 2023 to high in 2024. The compound annual growth rate (CAGR) for the period 2020-2024 was -2.46%, indicating a decline in the market. Furthermore, the growth rate from 2023 to 2024 was -13.32%, reflecting a significant downturn in the industry during that period.
India Interactive Tables Market Synopsis
The India interactive tables market is an essential segment of the country`s education and technology industry. Interactive tables are equipped with touchscreen displays and interactive software, providing an engaging and interactive learning experience. The market`s growth is driven by the increasing adoption of technology in educational institutions and the demand for modern and interactive teaching tools. The rise in digital learning solutions and the focus on student engagement and participation contribute to the demand for interactive tables. Key players in the market offer a wide range of interactive tables with varying sizes and features to cater to diverse educational settings and age groups.
Market Drivers of the market
The India interactive tables market is driven by several factors. Firstly, the growth of the education and e-learning industries in the country fuels the demand for interactive tables in classrooms and learning environments. Interactive tables offer innovative and engaging learning experiences, enhancing student participation and collaboration. Secondly, the expansion of the hospitality and entertainment sectors creates opportunities for interactive tables in hotels, restaurants, and entertainment venues. The focus on customer engagement and immersive experiences further stimulates the market`s growth. Additionally, the adoption of interactive tables in corporate settings for presentations, training, and collaborative work drives the demand for these advanced digital tools in India.
Challenges of the Market
The India interactive tables market faces challenges related to the need for advanced and user-friendly interactive technology. As businesses and educational institutions adopt digital solutions, manufacturers need to develop interactive tables that meet diverse customer requirements.
Covid-19 Impact on the Market
The India Interactive Tables market faced challenges during the Covid-19 pandemic, primarily due to disruptions in hospitality and education sectors. Interactive tables are used in restaurants, hotels, and educational institutions for interactive experiences and learning. With lockdowns and restrictions on public gatherings, the hospitality and education sectors faced significant disruptions, impacting the demand for interactive tables. Additionally, supply chain disruptions and logistic challenges impacted the availability of finished products. However, as the economy gradually reopens and the hospitality and education sectors adapt to the new normal, the demand for interactive tables is expected to recover. The emphasis on interactive and immersive experiences may drive the market`s growth in India.
Key Players of the Market
The India interactive tables market is driven by key players specializing in interactive technology and education solutions. Some prominent players in this sector include InFocus India Pvt. Ltd., Smart Technologies (India) Pvt. Ltd., Promethean India, and TouchMagix Media Private Limited. These companies provide interactive tables and displays used in education, corporate training, and entertainment settings. Their focus on innovation, user experience, and interactive content development has positioned them as key players in the interactive tables market in India.
Key Highlights of the Report:
- India Interactive Tables Market Outlook
- Market Size of India Interactive Tables Market, 2024
- Forecast of India Interactive Tables Market, 2031
- Historical Data and Forecast of India Interactive Tables Revenues & Volume for the Period 2021-2031
- India Interactive Tables Market Trend Evolution
- India Interactive Tables Market Drivers and Challenges
- India Interactive Tables Price Trends
- India Interactive Tables Porter's Five Forces
- India Interactive Tables Industry Life Cycle
- Historical Data and Forecast of India Interactive Tables Market Revenues & Volume By Technology for the Period 2021-2031
- Historical Data and Forecast of India Interactive Tables Market Revenues & Volume By LCD for the Period 2021-2031
- Historical Data and Forecast of India Interactive Tables Market Revenues & Volume By LED for the Period 2021-2031
- Historical Data and Forecast of India Interactive Tables Market Revenues & Volume By Capacitive for the Period 2021-2031
- Historical Data and Forecast of India Interactive Tables Market Revenues & Volume By Others for the Period 2021-2031
- Historical Data and Forecast of India Interactive Tables Market Revenues & Volume By Screen Size for the Period 2021-2031
- Historical Data and Forecast of India Interactive Tables Market Revenues & Volume By 32-65 Inch for the Period 2021-2031
- Historical Data and Forecast of India Interactive Tables Market Revenues & Volume By 65 Inch & Above for the Period 2021-2031
- Historical Data and Forecast of India Interactive Tables Market Revenues & Volume By Application for the Period 2021-2031
- Historical Data and Forecast of India Interactive Tables Market Revenues & Volume By Exhibition & Trade Shows for the Period 2021-2031
- Historical Data and Forecast of India Interactive Tables Market Revenues & Volume By Education for the Period 2021-2031
- Historical Data and Forecast of India Interactive Tables Market Revenues & Volume By Retail for the Period 2021-2031
- Historical Data and Forecast of India Interactive Tables Market Revenues & Volume By Control Room for the Period 2021-2031
- Historical Data and Forecast of India Interactive Tables Market Revenues & Volume By Hospitality for the Period 2021-2031
- Historical Data and Forecast of India Interactive Tables Market Revenues & Volume By Transportation for the Period 2021-2031
- Historical Data and Forecast of India Interactive Tables Market Revenues & Volume By Others for the Period 2021-2031
- India Interactive Tables Import Export Trade Statistics
- Market Opportunity Assessment By Technology
- Market Opportunity Assessment By Screen Size
- Market Opportunity Assessment By Application
- India Interactive Tables Top Companies Market Share
- India Interactive Tables Competitive Benchmarking By Technical and Operational Parameters
- India Interactive Tables Company Profiles
- India Interactive Tables Key Strategic Recommendations
Frequently Asked Questions About the Market Study (FAQs):
6Wresearch actively monitors the India Interactive Tables Market and publishes its comprehensive annual report, highlighting emerging trends, growth drivers, revenue analysis, and forecast outlook. Our insights help businesses to make data-backed strategic decisions with ongoing market dynamics. Our analysts track relevent industries related to the India Interactive Tables Market, allowing our clients with actionable intelligence and reliable forecasts tailored to emerging regional needs.
Yes, we provide customisation as per your requirements. To learn more, feel free to contact us on sales@6wresearch.com
1 Executive Summary |
2 Introduction |
2.1 Key Highlights of the Report |
2.2 Report Description |
2.3 Market Scope & Segmentation |
2.4 Research Methodology |
2.5 Assumptions |
3 India Interactive Tables Market Overview |
3.1 India Country Macro Economic Indicators |
3.2 India Interactive Tables Market Revenues & Volume, 2021 & 2031F |
3.3 India Interactive Tables Market - Industry Life Cycle |
3.4 India Interactive Tables Market - Porter's Five Forces |
3.5 India Interactive Tables Market Revenues & Volume Share, By Technology, 2021 & 2031F |
3.6 India Interactive Tables Market Revenues & Volume Share, By Screen Size, 2021 & 2031F |
3.7 India Interactive Tables Market Revenues & Volume Share, By Application, 2021 & 2031F |
4 India Interactive Tables Market Dynamics |
4.1 Impact Analysis |
4.2 Market Drivers |
4.2.1 Increasing demand for interactive and engaging technologies in educational institutions and corporate offices |
4.2.2 Growing adoption of interactive tables in retail stores to enhance customer experience and drive sales |
4.2.3 Technological advancements leading to more affordable interactive table solutions |
4.3 Market Restraints |
4.3.1 High initial investment and maintenance costs associated with interactive tables |
4.3.2 Limited awareness and understanding of the benefits of interactive tables among potential users |
4.3.3 Lack of skilled professionals to develop and implement interactive table solutions |
5 India Interactive Tables Market Trends |
6 India Interactive Tables Market, By Types |
6.1 India Interactive Tables Market, By Technology |
6.1.1 Overview and Analysis |
6.1.2 India Interactive Tables Market Revenues & Volume, By Technology, 2021-2031F |
6.1.3 India Interactive Tables Market Revenues & Volume, By LCD, 2021-2031F |
6.1.4 India Interactive Tables Market Revenues & Volume, By LED, 2021-2031F |
6.1.5 India Interactive Tables Market Revenues & Volume, By Capacitive, 2021-2031F |
6.1.6 India Interactive Tables Market Revenues & Volume, By Others, 2021-2031F |
6.2 India Interactive Tables Market, By Screen Size |
6.2.1 Overview and Analysis |
6.2.2 India Interactive Tables Market Revenues & Volume, By 32-65 Inch, 2021-2031F |
6.2.3 India Interactive Tables Market Revenues & Volume, By 65 Inch & Above, 2021-2031F |
6.3 India Interactive Tables Market, By Application |
6.3.1 Overview and Analysis |
6.3.2 India Interactive Tables Market Revenues & Volume, By Exhibition & Trade Shows, 2021-2031F |
6.3.3 India Interactive Tables Market Revenues & Volume, By Education, 2021-2031F |
6.3.4 India Interactive Tables Market Revenues & Volume, By Retail, 2021-2031F |
6.3.5 India Interactive Tables Market Revenues & Volume, By Control Room, 2021-2031F |
6.3.6 India Interactive Tables Market Revenues & Volume, By Hospitality, 2021-2031F |
6.3.7 India Interactive Tables Market Revenues & Volume, By Transportation, 2021-2031F |
7 India Interactive Tables Market Import-Export Trade Statistics |
7.1 India Interactive Tables Market Export to Major Countries |
7.2 India Interactive Tables Market Imports from Major Countries |
8 India Interactive Tables Market Key Performance Indicators |
8.1 Average session duration on interactive tables |
8.2 Number of new interactive table installations in educational institutions and corporate offices |
8.3 Percentage increase in usage of interactive tables in retail stores |
9 India Interactive Tables Market - Opportunity Assessment |
9.1 India Interactive Tables Market Opportunity Assessment, By Technology, 2021 & 2031F |
9.2 India Interactive Tables Market Opportunity Assessment, By Screen Size, 2021 & 2031F |
9.3 India Interactive Tables Market Opportunity Assessment, By Application, 2021 & 2031F |
10 India Interactive Tables Market - Competitive Landscape |
10.1 India Interactive Tables Market Revenue Share, By Companies, 2024 |
10.2 India Interactive Tables Market Competitive Benchmarking, By Operating and Technical Parameters |
11 Company Profiles |
12 Recommendations |
13 Disclaimer |
Global Go To Market Strategy - 2030
Export potential enables firms to identify high-growth global markets with greater confidence by combining advanced trade intelligence with a structured quantitative methodology. The framework analyzes emerging demand trends and country-level import patterns while integrating macroeconomic and trade datasets such as GDP and population forecasts, bilateral import–export flows, tariff structures, elasticity differentials between developed and developing economies, geographic distance, and import demand projections. Using weighted trade values from 2020–2024 as the base period to project country-to-country export potential for 2030, these inputs are operationalized through calculated drivers such as gravity model parameters, tariff impact factors, and projected GDP per-capita growth. Through an analysis of hidden potentials, demand hotspots, and market conditions that are most favorable to success, this method enables firms to focus on target countries, maximize returns, and global expansion with data, backed by accuracy.
By factoring in the projected importer demand gap that is currently unmet and could be potential opportunity, it identifies the potential for the Exporter (Country) among 190 countries, against the general trade analysis, which identifies the biggest importer or exporter.
To discover high-growth global markets and optimize your business strategy:
Click Here
Pricing
- Single User License$ 1,995
- Department License$ 2,400
- Site License$ 3,120
- Global License$ 3,795

Leadership Perspectives from Industry Events
Search
Thought Leadership and Analyst Meet


Our Clients
6WResearch In News
- India Air Conditioner Market Set for Strong Rebound in 2026 After Weather-Led Correction and GST-Driven Recovery: 6Wresearch
- ADAS in India: How Automatic Emergency Braking, Blind Spot Detection & Driver Monitoring are Transforming Road Safety
- Doha a strategic location for EV manufacturing hub: IPA Qatar
- Demand for luxury TVs surging in the GCC, says Samsung
- Empowering Growth: The Thriving Journey of Bangladesh’s Cable Industry
- Demand for luxury TVs surging in the GCC, says Samsung
Latest Reports
- Nicaragua RPG Gaming Market (2026-2032)
- New Zealand RPG Gaming Market (2026-2032)
- Netherlands RPG Gaming Market (2026-2032)
- Nauru RPG Gaming Market (2026-2032)
- Namibia RPG Gaming Market (2026-2032)
- Mozambique RPG Gaming Market (2026-2032)
- Montenegro RPG Gaming Market (2026-2032)
- Mongolia RPG Gaming Market (2026-2032)
- Monaco RPG Gaming Market (2026-2032)
- Micronesia RPG Gaming Market (2026-2032)
Industry Events and Analyst Meet

HIMTEX 2026

India Refining Summit 2026

India EV Show 2026

EV tech India Expo 2026

Auto Tech Asia 2026
Whitepaper
- Middle East & Africa Commercial Security Market Click here to view more.
- Middle East & Africa Fire Safety Systems & Equipment Market Click here to view more.
- GCC Drone Market Click here to view more.
- Middle East Lighting Fixture Market Click here to view more.
- GCC Physical & Perimeter Security Market Click here to view more.