India Polyurethane (PU) Microspheres Market (2025-2031) Outlook | Industry, Trends, Revenue, Growth, Analysis, Forecast, Companies, Value, Size & Share
Market Forecast By Applications (Encapsulation, Paints & coatings, Adhesives films, Cosmetics, Other applications) And Competitive Landscape
| Product Code: ETC4512205 | Publication Date: Jul 2023 | Updated Date: Nov 2025 | Product Type: Report | |
| Publisher: 6Wresearch | Author: Ravi Bhandari | No. of Pages: 85 | No. of Figures: 45 | No. of Tables: 25 |
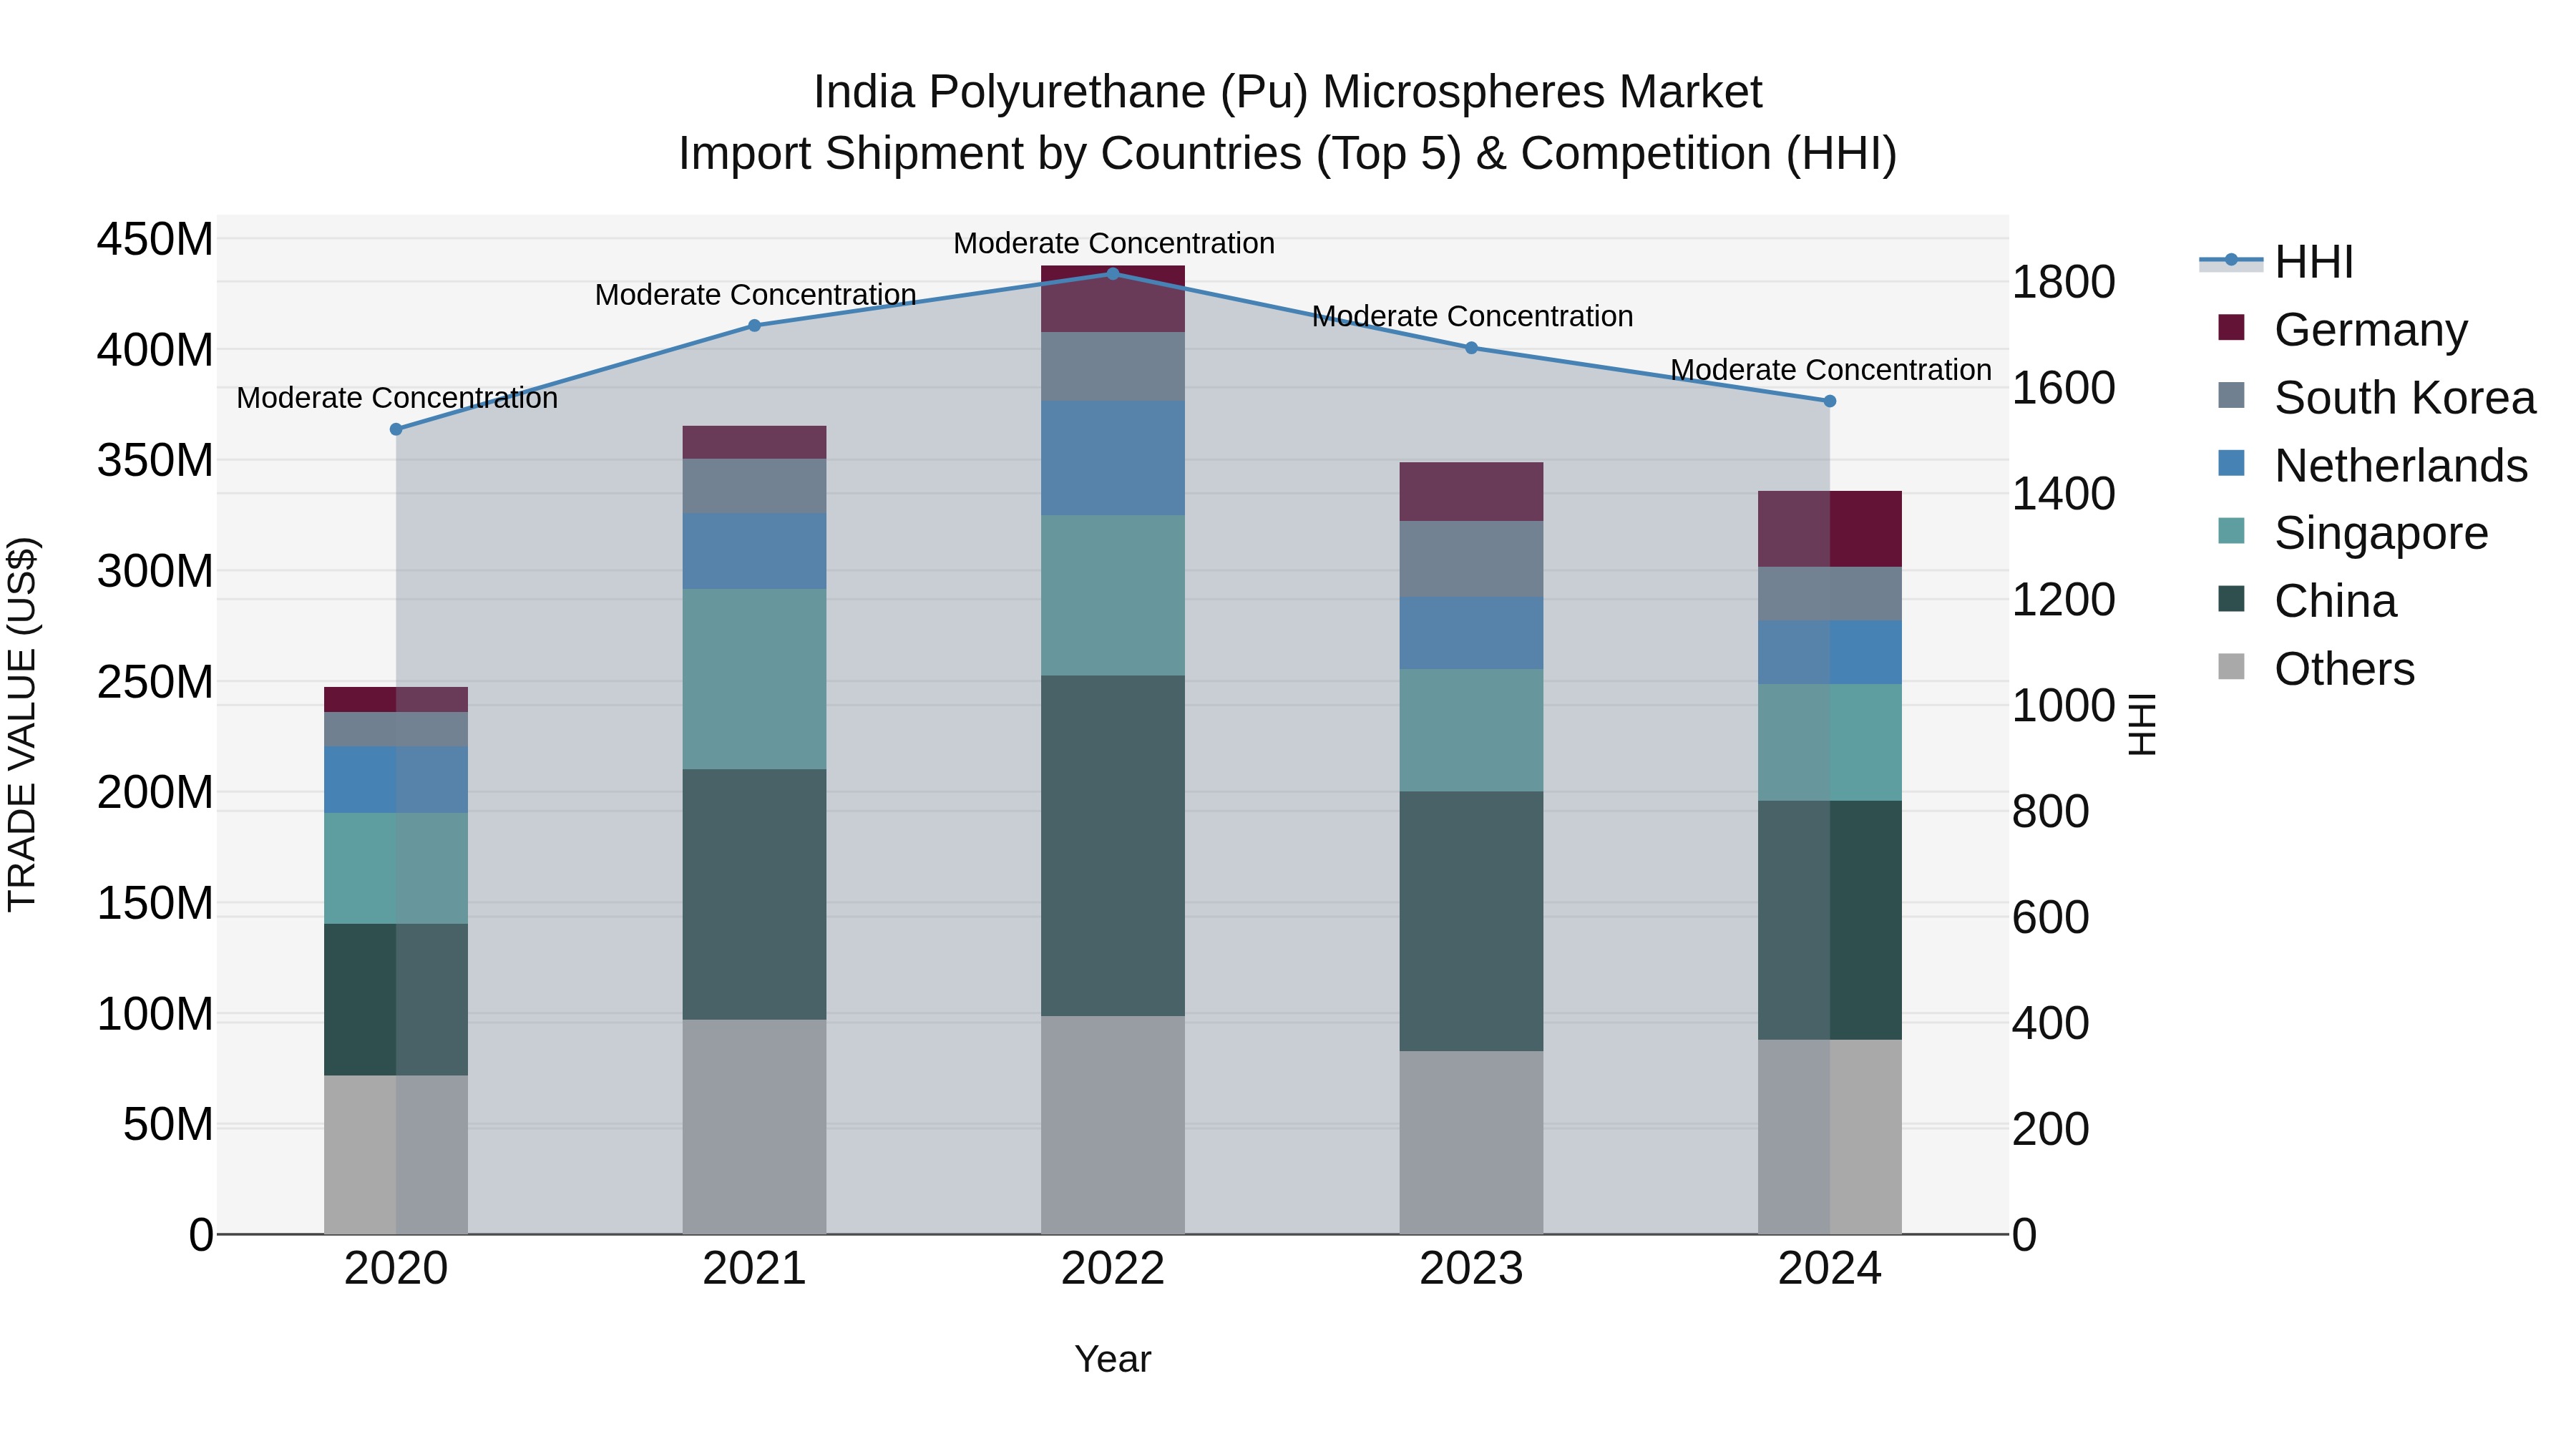
India Polyurethane (Pu) Microspheres Market Top 5 Importing Countries and Market Competition (HHI) Analysis
India`s polyurethane (PU) microspheres import market in 2024 saw consistent growth with a CAGR of 7.96% from 2020 to 2024. Despite a slight decline in growth rate from 2023 to 2024 at -3.67%, the market maintained a moderate concentration with top exporting countries being China, Singapore, Germany, Netherlands, and South Korea. This indicates a diverse import market for PU microspheres in India, offering a range of sources for these essential materials.
India Polyurethane (PU) Microspheres Market Overview
The India Polyurethane PU Microspheres market is an essential segment within the plastics and coatings industries. These microspheres are used to enhance product properties such as insulation, weight reduction, and durability. The market`s growth is driven by the need for innovative solutions in industries like construction and automotive.
Drivers of the Market
The India polyurethane microspheres market is growing due to their versatility and unique properties. Polyurethane microspheres are used in various industries, including paints and coatings, cosmetics, and composites. In the paint and coatings sector, they act as fillers, providing texture and enhancing properties like scratch resistance and matte finishes. In the cosmetics industry, they are used in personal care products for their texture-enhancing and matte effects. Additionally, polyurethane microspheres are used in composites to reduce weight and enhance insulation. The market is further driven by advancements in microsphere formulations and the need for innovative materials that offer functional benefits across multiple industries.
Challenges of the Market
Challenges in the polyurethane microspheres market include cost-effectiveness and product quality. Ensuring consistent microsphere size and performance while controlling production costs can be demanding. The need to meet environmental regulations and consumer demands for eco-friendly materials is another challenge this market faces.
COVID-19 Impact on the Market
The PU microspheres market in India experienced challenges during the pandemic due to disruptions in various end-use sectors like cosmetics, automotive, and construction. Reduced consumer spending and manufacturing disruptions affected the demand for products incorporating PU microspheres. The market has been gradually recovering as economic activities resume.
Key Players in the Market
Key players in the India polyurethane microspheres market consist of Chase Corporation, Supercolori S.p.A, Sanyo Chemical Industries, Ltd, MicroChemicals, and Matsumoto Yushi-Seiyaku Co., Ltd.
Key Highlights of the Report:
- India Polyurethane (PU) Microspheres Market Outlook
- Market Size of India Polyurethane (PU) Microspheres Market, 2024
- Forecast of India Polyurethane (PU) Microspheres Market, 2031
- Historical Data and Forecast of India Polyurethane (PU) Microspheres Revenues & Volume for the Period 2021-2031
- India Polyurethane (PU) Microspheres Market Trend Evolution
- India Polyurethane (PU) Microspheres Market Drivers and Challenges
- India Polyurethane (PU) Microspheres Price Trends
- India Polyurethane (PU) Microspheres Porter's Five Forces
- India Polyurethane (PU) Microspheres Industry Life Cycle
- Historical Data and Forecast of India Polyurethane (PU) Microspheres Market Revenues & Volume By Applications for the Period 2021-2031
- Historical Data and Forecast of India Polyurethane (PU) Microspheres Market Revenues & Volume By Encapsulation for the Period 2021-2031
- Historical Data and Forecast of India Polyurethane (PU) Microspheres Market Revenues & Volume By Paints & coatings for the Period 2021-2031
- Historical Data and Forecast of India Polyurethane (PU) Microspheres Market Revenues & Volume By Adhesives films for the Period 2021-2031
- Historical Data and Forecast of India Polyurethane (PU) Microspheres Market Revenues & Volume By Cosmetics for the Period 2021-2031
- Historical Data and Forecast of India Polyurethane (PU) Microspheres Market Revenues & Volume By Other applications for the Period 2021-2031
- India Polyurethane (PU) Microspheres Import Export Trade Statistics
- Market Opportunity Assessment By Applications
- India Polyurethane (PU) Microspheres Top Companies Market Share
- India Polyurethane (PU) Microspheres Competitive Benchmarking By Technical and Operational Parameters
- India Polyurethane (PU) Microspheres Company Profiles
- India Polyurethane (PU) Microspheres Key Strategic Recommendations
Frequently Asked Questions About the Market Study (FAQs):
6Wresearch actively monitors the India Polyurethane (PU) Microspheres Market and publishes its comprehensive annual report, highlighting emerging trends, growth drivers, revenue analysis, and forecast outlook. Our insights help businesses to make data-backed strategic decisions with ongoing market dynamics. Our analysts track relevent industries related to the India Polyurethane (PU) Microspheres Market, allowing our clients with actionable intelligence and reliable forecasts tailored to emerging regional needs.
Yes, we provide customisation as per your requirements. To learn more, feel free to contact us on sales@6wresearch.com
1 Executive Summary |
2 Introduction |
2.1 Key Highlights of the Report |
2.2 Report Description |
2.3 Market Scope & Segmentation |
2.4 Research Methodology |
2.5 Assumptions |
3 India Polyurethane (PU) Microspheres Market Overview |
3.1 India Country Macro Economic Indicators |
3.2 India Polyurethane (PU) Microspheres Market Revenues & Volume, 2021 & 2031F |
3.3 India Polyurethane (PU) Microspheres Market - Industry Life Cycle |
3.4 India Polyurethane (PU) Microspheres Market - Porter's Five Forces |
3.5 India Polyurethane (PU) Microspheres Market Revenues & Volume Share, By Applications, 2021 & 2031F |
4 India Polyurethane (PU) Microspheres Market Dynamics |
4.1 Impact Analysis |
4.2 Market Drivers |
4.2.1 Increasing demand for lightweight materials in various industries such as automotive, construction, and packaging |
4.2.2 Growing awareness about the benefits of using polyurethane microspheres in applications like coatings, adhesives, and composites |
4.3 Market Restraints |
4.3.1 Fluctuating raw material prices affecting the production cost of polyurethane microspheres |
4.3.2 Limited availability of skilled labor for manufacturing high-quality polyurethane microspheres |
5 India Polyurethane (PU) Microspheres Market Trends |
6 India Polyurethane (PU) Microspheres Market, By Types |
6.1 India Polyurethane (PU) Microspheres Market, By Applications |
6.1.1 Overview and Analysis |
6.1.2 India Polyurethane (PU) Microspheres Market Revenues & Volume, By Applications, 2021-2031F |
6.1.3 India Polyurethane (PU) Microspheres Market Revenues & Volume, By Encapsulation, 2021-2031F |
6.1.4 India Polyurethane (PU) Microspheres Market Revenues & Volume, By Paints & coatings, 2021-2031F |
6.1.5 India Polyurethane (PU) Microspheres Market Revenues & Volume, By Adhesives films, 2021-2031F |
6.1.6 India Polyurethane (PU) Microspheres Market Revenues & Volume, By Cosmetics, 2021-2031F |
6.1.7 India Polyurethane (PU) Microspheres Market Revenues & Volume, By Other applications, 2021-2031F |
7 India Polyurethane (PU) Microspheres Market Import-Export Trade Statistics |
7.1 India Polyurethane (PU) Microspheres Market Export to Major Countries |
7.2 India Polyurethane (PU) Microspheres Market Imports from Major Countries |
8 India Polyurethane (PU) Microspheres Market Key Performance Indicators |
8.1 Research and development investment in new polyurethane microsphere formulations |
8.2 Adoption rate of polyurethane microspheres in key industries |
8.3 Number of patents filed for polyurethane microsphere innovations |
8.4 Percentage increase in applications using polyurethane microspheres |
8.5 Environmental impact assessments for polyurethane microsphere production |
9 India Polyurethane (PU) Microspheres Market - Opportunity Assessment |
9.1 India Polyurethane (PU) Microspheres Market Opportunity Assessment, By Applications, 2021 & 2031F |
10 India Polyurethane (PU) Microspheres Market - Competitive Landscape |
10.1 India Polyurethane (PU) Microspheres Market Revenue Share, By Companies, 2024 |
10.2 India Polyurethane (PU) Microspheres Market Competitive Benchmarking, By Operating and Technical Parameters |
11 Company Profiles |
12 Recommendations |
13 Disclaimer |
Global Go To Market Strategy - 2030
Export potential enables firms to identify high-growth global markets with greater confidence by combining advanced trade intelligence with a structured quantitative methodology. The framework analyzes emerging demand trends and country-level import patterns while integrating macroeconomic and trade datasets such as GDP and population forecasts, bilateral import–export flows, tariff structures, elasticity differentials between developed and developing economies, geographic distance, and import demand projections. Using weighted trade values from 2020–2024 as the base period to project country-to-country export potential for 2030, these inputs are operationalized through calculated drivers such as gravity model parameters, tariff impact factors, and projected GDP per-capita growth. Through an analysis of hidden potentials, demand hotspots, and market conditions that are most favorable to success, this method enables firms to focus on target countries, maximize returns, and global expansion with data, backed by accuracy.
By factoring in the projected importer demand gap that is currently unmet and could be potential opportunity, it identifies the potential for the Exporter (Country) among 190 countries, against the general trade analysis, which identifies the biggest importer or exporter.
To discover high-growth global markets and optimize your business strategy:
Click Here
Pricing
- Single User License$ 1,995
- Department License$ 2,400
- Site License$ 3,120
- Global License$ 3,795

Leadership Perspectives from Industry Events
Search
Thought Leadership and Analyst Meet


Our Clients
6WResearch In News
- Doha a strategic location for EV manufacturing hub: IPA Qatar
- Demand for luxury TVs surging in the GCC, says Samsung
- Empowering Growth: The Thriving Journey of Bangladesh’s Cable Industry
- Demand for luxury TVs surging in the GCC, says Samsung
- Video call with a traditional healer? Once unthinkable, it’s now common in South Africa
- Intelligent Buildings To Smooth GCC’s Path To Net Zero
Latest Reports
- Cape Verde Portable Hand-Thrown Extinguisher Market (2026-2032)
- Canada Portable Hand-Thrown Extinguisher Market (2026-2032)
- Cameroon Portable Hand-Thrown Extinguisher Market (2026-2032)
- Burundi Portable Hand-Thrown Extinguisher Market (2026-2032)
- Burkina Faso Portable Hand-Thrown Extinguisher Market (2026-2032)
- Bulgaria Portable Hand-Thrown Extinguisher Market (2026-2032)
- Brunei Portable Hand-Thrown Extinguisher Market (2026-2032)
- Botswana Portable Hand-Thrown Extinguisher Market (2026-2032)
- Bosnia and Herzegovina Portable Hand-Thrown Extinguisher Market (2026-2032)
- Bolivia Portable Hand-Thrown Extinguisher Market (2026-2032)
Industry Events and Analyst Meet

HIMTEX 2026

India Refining Summit 2026

India EV Show 2026

EV tech India Expo 2026

Auto Tech Asia 2026
Whitepaper
- Middle East & Africa Commercial Security Market Click here to view more.
- Middle East & Africa Fire Safety Systems & Equipment Market Click here to view more.
- GCC Drone Market Click here to view more.
- Middle East Lighting Fixture Market Click here to view more.
- GCC Physical & Perimeter Security Market Click here to view more.