Indonesia Acidity Regulators Market (2026-2032) Outlook | Trends, Industry, Revenue, Companies, Growth, Share, Size, Forecast, Analysis & Value
Market Forecast By Type (Acetic Acid, Citric Acid, Lactic Acid, Malic Acid, Phosphoric Acid), By Application (Beverages, Sauces, Dressings & Condiments, Processed Foods, Bakery & Confectionery) And Competitive Landscape
| Product Code: ETC4547489 | Publication Date: Jul 2023 | Updated Date: Mar 2026 | Product Type: Report | |
| Publisher: 6Wresearch | Author: Ravi Bhandari | No. of Pages: 85 | No. of Figures: 45 | No. of Tables: 25 |
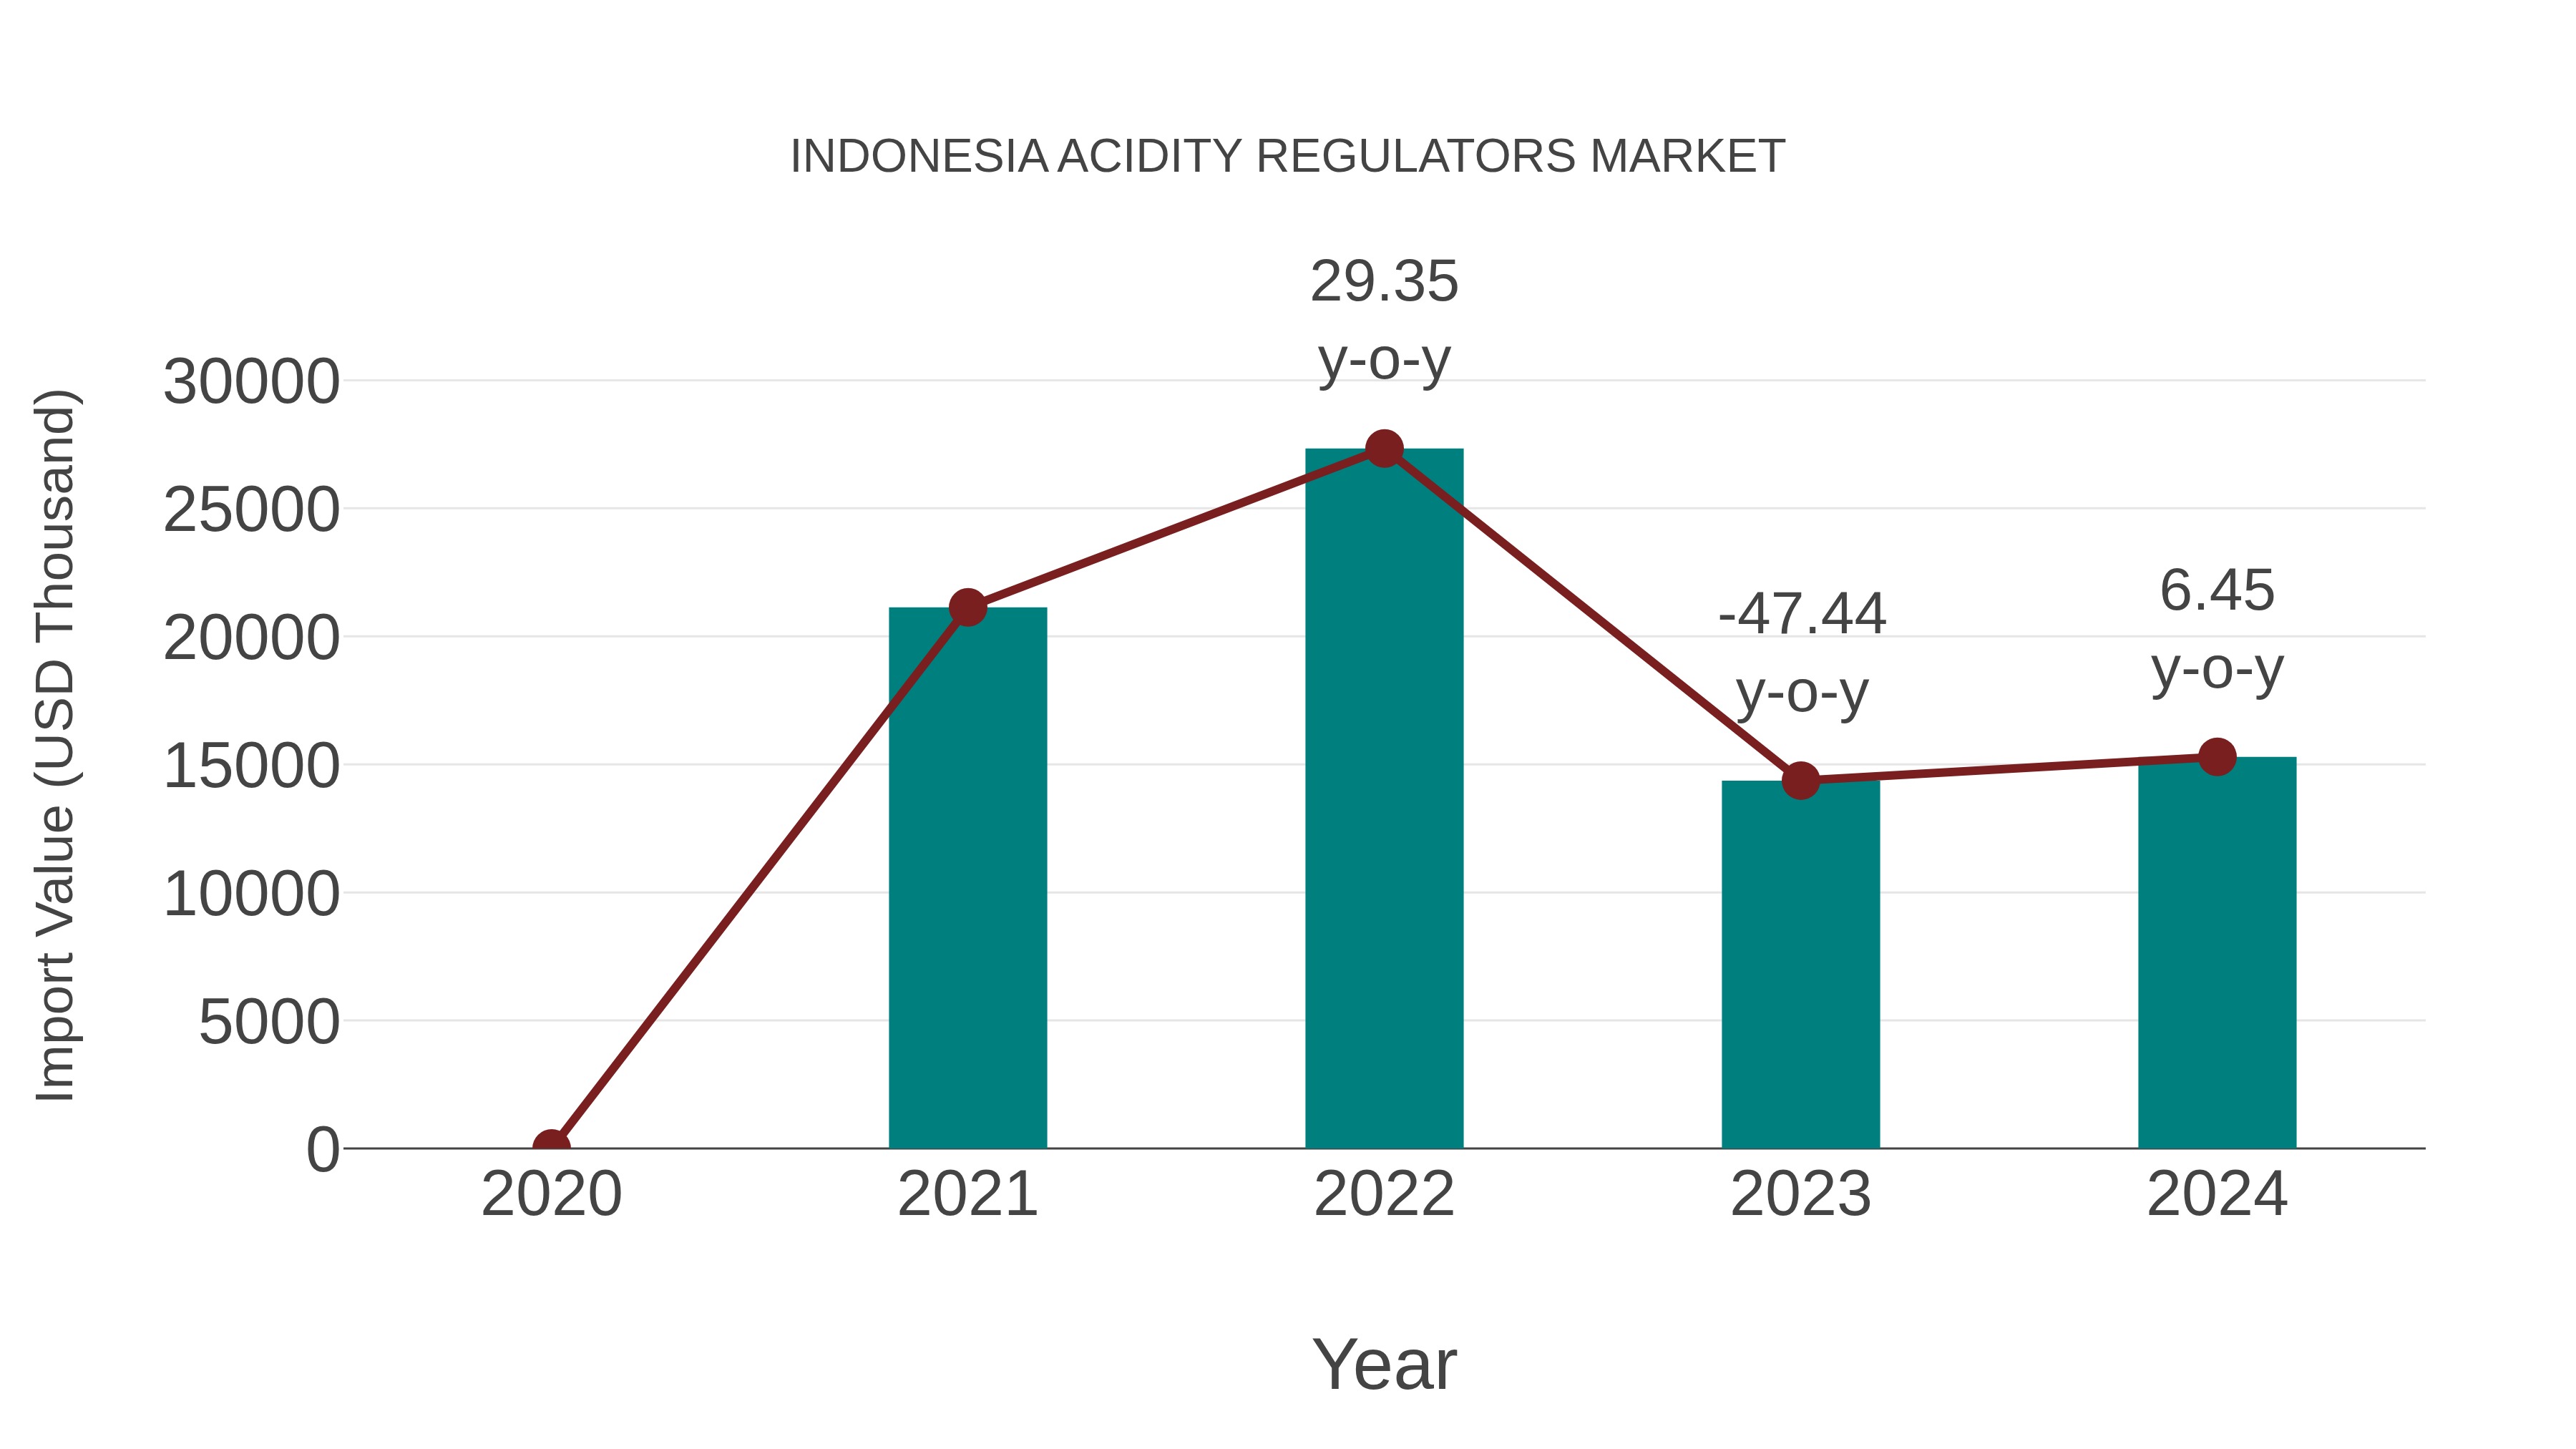
Indonesia Acidity Regulators Market: Import Trend Analysis
In the Indonesia acidity regulators market, the import trend showed a growth rate of 6.45% from 2023 to 2024, contrasting with a compound annual growth rate (CAGR) of -10.22% for the period 2020-2024. This shift may reflect changing consumer preferences or adjustments in import policies affecting market dynamics.
Indonesia Acidity Regulators Market Overview
The acidity regulators market in Indonesia focuses on ingredients that help control and maintain the pH level of food and beverages. These regulators play a critical role in ensuring the taste, safety, and shelf stability of products. As the food industry continues to grow, the demand for acidity regulators is also expected to rise.
Drivers of the Market
The Indonesia acidity regulators market is driven by the growing demand for processed foods and beverages in the country. As the Indonesian population continues to urbanize and lead busier lifestyles, there is an increased preference for convenience foods. Acidity regulators are essential in maintaining the quality and taste of these products, extending their shelf life, and meeting consumer preferences.
Challenges of the Market
The acidity regulators market faces challenges in developing natural and clean label options for pH control in food products, particularly in the context of maintaining product stability and taste.
COVID-19 Impacts on the Market
The Indonesia acidity regulators market experienced fluctuations due to the COVID-19 pandemic. Initially, disruptions in the supply chain and reduced production capacity affected the market. However, as the situation stabilized, the demand for acidity regulators saw a gradual recovery, driven by the food and beverage industry`s resilience in adapting to new consumer trends.
Key Players of the Makret
Acidity regulators are essential in the food industry, and companies like Tate & Lyle, Givaudan, and Kerry Group play a significant role in providing these solutions to maintain the desired pH levels in various food products in Indonesia.
Key Highlights of the Report:
- Indonesia Acidity Regulators Market Outlook
- Market Size of Indonesia Acidity Regulators Market, 2025
- Forecast of Indonesia Acidity Regulators Market, 2032
- Historical Data and Forecast of Indonesia Acidity Regulators Revenues & Volume for the Period 2022-2032F
- Indonesia Acidity Regulators Market Trend Evolution
- Indonesia Acidity Regulators Market Drivers and Challenges
- Indonesia Acidity Regulators Price Trends
- Indonesia Acidity Regulators Porter's Five Forces
- Indonesia Acidity Regulators Industry Life Cycle
- Historical Data and Forecast of Indonesia Acidity Regulators Market Revenues & Volume By Type for the Period 2022-2032F
- Historical Data and Forecast of Indonesia Acidity Regulators Market Revenues & Volume By Acetic Acid for the Period 2022-2032F
- Historical Data and Forecast of Indonesia Acidity Regulators Market Revenues & Volume By Citric Acid for the Period 2022-2032F
- Historical Data and Forecast of Indonesia Acidity Regulators Market Revenues & Volume By Lactic Acid for the Period 2022-2032F
- Historical Data and Forecast of Indonesia Acidity Regulators Market Revenues & Volume By Malic Acid for the Period 2022-2032F
- Historical Data and Forecast of Indonesia Acidity Regulators Market Revenues & Volume By Phosphoric Acid for the Period 2022-2032F
- Historical Data and Forecast of Indonesia Acidity Regulators Market Revenues & Volume By Application for the Period 2022-2032F
- Historical Data and Forecast of Indonesia Acidity Regulators Market Revenues & Volume By Beverages for the Period 2022-2032F
- Historical Data and Forecast of Indonesia Acidity Regulators Market Revenues & Volume By Sauces for the Period 2022-2032F
- Historical Data and Forecast of Indonesia Acidity Regulators Market Revenues & Volume By Dressings & Condiments for the Period 2022-2032F
- Historical Data and Forecast of Indonesia Acidity Regulators Market Revenues & Volume By Processed Foods for the Period 2022-2032F
- Historical Data and Forecast of Indonesia Acidity Regulators Market Revenues & Volume By Bakery & Confectionery for the Period 2022-2032F
- Indonesia Acidity Regulators Import Export Trade Statistics
- Market Opportunity Assessment By Type
- Market Opportunity Assessment By Application
- Indonesia Acidity Regulators Top Companies Market Share
- Indonesia Acidity Regulators Competitive Benchmarking By Technical and Operational Parameters
- Indonesia Acidity Regulators Company Profiles
- Indonesia Acidity Regulators Key Strategic Recommendations
Indonesia Acidity Regulators Market (2026-2032): FAQs
6Wresearch actively monitors the Indonesia Acidity Regulators Market and publishes its comprehensive annual report, highlighting emerging trends, growth drivers, revenue analysis, and forecast outlook. Our insights help businesses to make data-backed strategic decisions with ongoing market dynamics. Our analysts track relevent industries related to the Indonesia Acidity Regulators Market, allowing our clients with actionable intelligence and reliable forecasts tailored to emerging regional needs.
Yes, we provide customisation as per your requirements. To learn more, feel free to contact us on sales@6wresearch.com
1 Executive Summary |
2 Introduction |
2.1 Key Highlights of the Report |
2.2 Report Description |
2.3 Market Scope & Segmentation |
2.4 Research Methodology |
2.5 Assumptions |
3 Indonesia Acidity Regulators Market Overview |
3.1 Indonesia Country Macro Economic Indicators |
3.2 Indonesia Acidity Regulators Market Revenues & Volume, 2022 & 2032F |
3.3 Indonesia Acidity Regulators Market - Industry Life Cycle |
3.4 Indonesia Acidity Regulators Market - Porter's Five Forces |
3.5 Indonesia Acidity Regulators Market Revenues & Volume Share, By Type, 2022 & 2032F |
3.6 Indonesia Acidity Regulators Market Revenues & Volume Share, By Application, 2022 & 2032F |
4 Indonesia Acidity Regulators Market Dynamics |
4.1 Impact Analysis |
4.2 Market Drivers |
4.2.1 Increasing demand for processed food and beverages in Indonesia, leading to higher usage of acidity regulators. |
4.2.2 Growing awareness among consumers regarding health benefits of consuming products with controlled acidity levels. |
4.2.3 Rising disposable income and changing lifestyles driving the consumption of convenience foods and beverages. |
4.3 Market Restraints |
4.3.1 Fluctuating prices of raw materials used in acidity regulators production impacting the overall market. |
4.3.2 Stringent regulations and quality standards pertaining to food additives in Indonesia. |
4.3.3 Limited availability of advanced technology for acidity regulators production affecting market growth. |
5 Indonesia Acidity Regulators Market Trends |
6 Indonesia Acidity Regulators Market, By Types |
6.1 Indonesia Acidity Regulators Market, By Type |
6.1.1 Overview and Analysis |
6.1.2 Indonesia Acidity Regulators Market Revenues & Volume, By Type, 2022-2032F |
6.1.3 Indonesia Acidity Regulators Market Revenues & Volume, By Acetic Acid, 2022-2032F |
6.1.4 Indonesia Acidity Regulators Market Revenues & Volume, By Citric Acid, 2022-2032F |
6.1.5 Indonesia Acidity Regulators Market Revenues & Volume, By Lactic Acid, 2022-2032F |
6.1.6 Indonesia Acidity Regulators Market Revenues & Volume, By Malic Acid, 2022-2032F |
6.1.7 Indonesia Acidity Regulators Market Revenues & Volume, By Phosphoric Acid, 2022-2032F |
6.2 Indonesia Acidity Regulators Market, By Application |
6.2.1 Overview and Analysis |
6.2.2 Indonesia Acidity Regulators Market Revenues & Volume, By Beverages, 2022-2032F |
6.2.3 Indonesia Acidity Regulators Market Revenues & Volume, By Sauces, 2022-2032F |
6.2.4 Indonesia Acidity Regulators Market Revenues & Volume, By Dressings & Condiments, 2022-2032F |
6.2.5 Indonesia Acidity Regulators Market Revenues & Volume, By Processed Foods, 2022-2032F |
6.2.6 Indonesia Acidity Regulators Market Revenues & Volume, By Bakery & Confectionery, 2022-2032F |
7 Indonesia Acidity Regulators Market Import-Export Trade Statistics |
7.1 Indonesia Acidity Regulators Market Export to Major Countries |
7.2 Indonesia Acidity Regulators Market Imports from Major Countries |
8 Indonesia Acidity Regulators Market Key Performance Indicators |
8.1 Consumer awareness and perception surveys regarding the importance of acidity regulators in food and beverages. |
8.2 Number of new product launches incorporating acidity regulators in the Indonesian market. |
8.3 Investment and adoption rates of innovative production technologies for acidity regulators in the region. |
9 Indonesia Acidity Regulators Market - Opportunity Assessment |
9.1 Indonesia Acidity Regulators Market Opportunity Assessment, By Type, 2022 & 2032F |
9.2 Indonesia Acidity Regulators Market Opportunity Assessment, By Application, 2022 & 2032F |
10 Indonesia Acidity Regulators Market - Competitive Landscape |
10.1 Indonesia Acidity Regulators Market Revenue Share, By Companies, 2025 |
10.2 Indonesia Acidity Regulators Market Competitive Benchmarking, By Operating and Technical Parameters |
11 Company Profiles |
12 Recommendations |
13 Disclaimer |
Global Go To Market Strategy - 2030
Export potential enables firms to identify high-growth global markets with greater confidence by combining advanced trade intelligence with a structured quantitative methodology. The framework analyzes emerging demand trends and country-level import patterns while integrating macroeconomic and trade datasets such as GDP and population forecasts, bilateral import–export flows, tariff structures, elasticity differentials between developed and developing economies, geographic distance, and import demand projections. Using weighted trade values from 2020–2024 as the base period to project country-to-country export potential for 2030, these inputs are operationalized through calculated drivers such as gravity model parameters, tariff impact factors, and projected GDP per-capita growth. Through an analysis of hidden potentials, demand hotspots, and market conditions that are most favorable to success, this method enables firms to focus on target countries, maximize returns, and global expansion with data, backed by accuracy.
By factoring in the projected importer demand gap that is currently unmet and could be potential opportunity, it identifies the potential for the Exporter (Country) among 190 countries, against the general trade analysis, which identifies the biggest importer or exporter.
To discover high-growth global markets and optimize your business strategy:
Click Here
Pricing
- Single User License$ 1,995
- Department License$ 2,400
- Site License$ 3,120
- Global License$ 3,795

Leadership Perspectives from Industry Events
Search
Thought Leadership and Analyst Meet


Our Clients
6WResearch In News
- Doha a strategic location for EV manufacturing hub: IPA Qatar
- Demand for luxury TVs surging in the GCC, says Samsung
- Empowering Growth: The Thriving Journey of Bangladesh’s Cable Industry
- Demand for luxury TVs surging in the GCC, says Samsung
- Video call with a traditional healer? Once unthinkable, it’s now common in South Africa
- Intelligent Buildings To Smooth GCC’s Path To Net Zero
Latest Reports
- Taiwan Airport Wireless Infrastructure Market (2026-2032)
- Vietnam Airport Wireless Infrastructure Market (2026-2032)
- Thailand Airport Wireless Infrastructure Market (2026-2032)
- South Korea Airport Wireless Infrastructure Market (2026-2032)
- Romania Airport Wireless Infrastructure Market (2026-2032)
- Qatar Airport Wireless Infrastructure Market (2026-2032)
- Philippines Airport Wireless Infrastructure Market (2026-2032)
- Japan Airport Wireless Infrastructure Market (2026-2032)
- Taiwan Airport Winter Services Market (2026-2032)
- Vietnam Airport Winter Services Market (2026-2032)
Industry Events and Analyst Meet

HIMTEX 2026

India Refining Summit 2026

India EV Show 2026

EV tech India Expo 2026

Auto Tech Asia 2026
Whitepaper
- Middle East & Africa Commercial Security Market Click here to view more.
- Middle East & Africa Fire Safety Systems & Equipment Market Click here to view more.
- GCC Drone Market Click here to view more.
- Middle East Lighting Fixture Market Click here to view more.
- GCC Physical & Perimeter Security Market Click here to view more.