Indonesia Beverage Flavoring Systems Market (2026-2032) Outlook | Analysis, Value, Industry, Growth, Share, Trends, Size, Revenue, Companies & Forecast
Market Forecast By Ingredient (Flavorings, Carriers, Enhancers), By Type (Browns, Dairy, Botanicals, Fruits), By Origin (Natural, Artificial, Nature-identical), By Form (Dry, Liquid), By Origin (Natural, Artificial, Nature-identical) And Competitive Landscape
| Product Code: ETC4542929 | Publication Date: Jul 2023 | Updated Date: Mar 2026 | Product Type: Report | |
| Publisher: 6Wresearch | Author: Ravi Bhandari | No. of Pages: 85 | No. of Figures: 45 | No. of Tables: 25 |
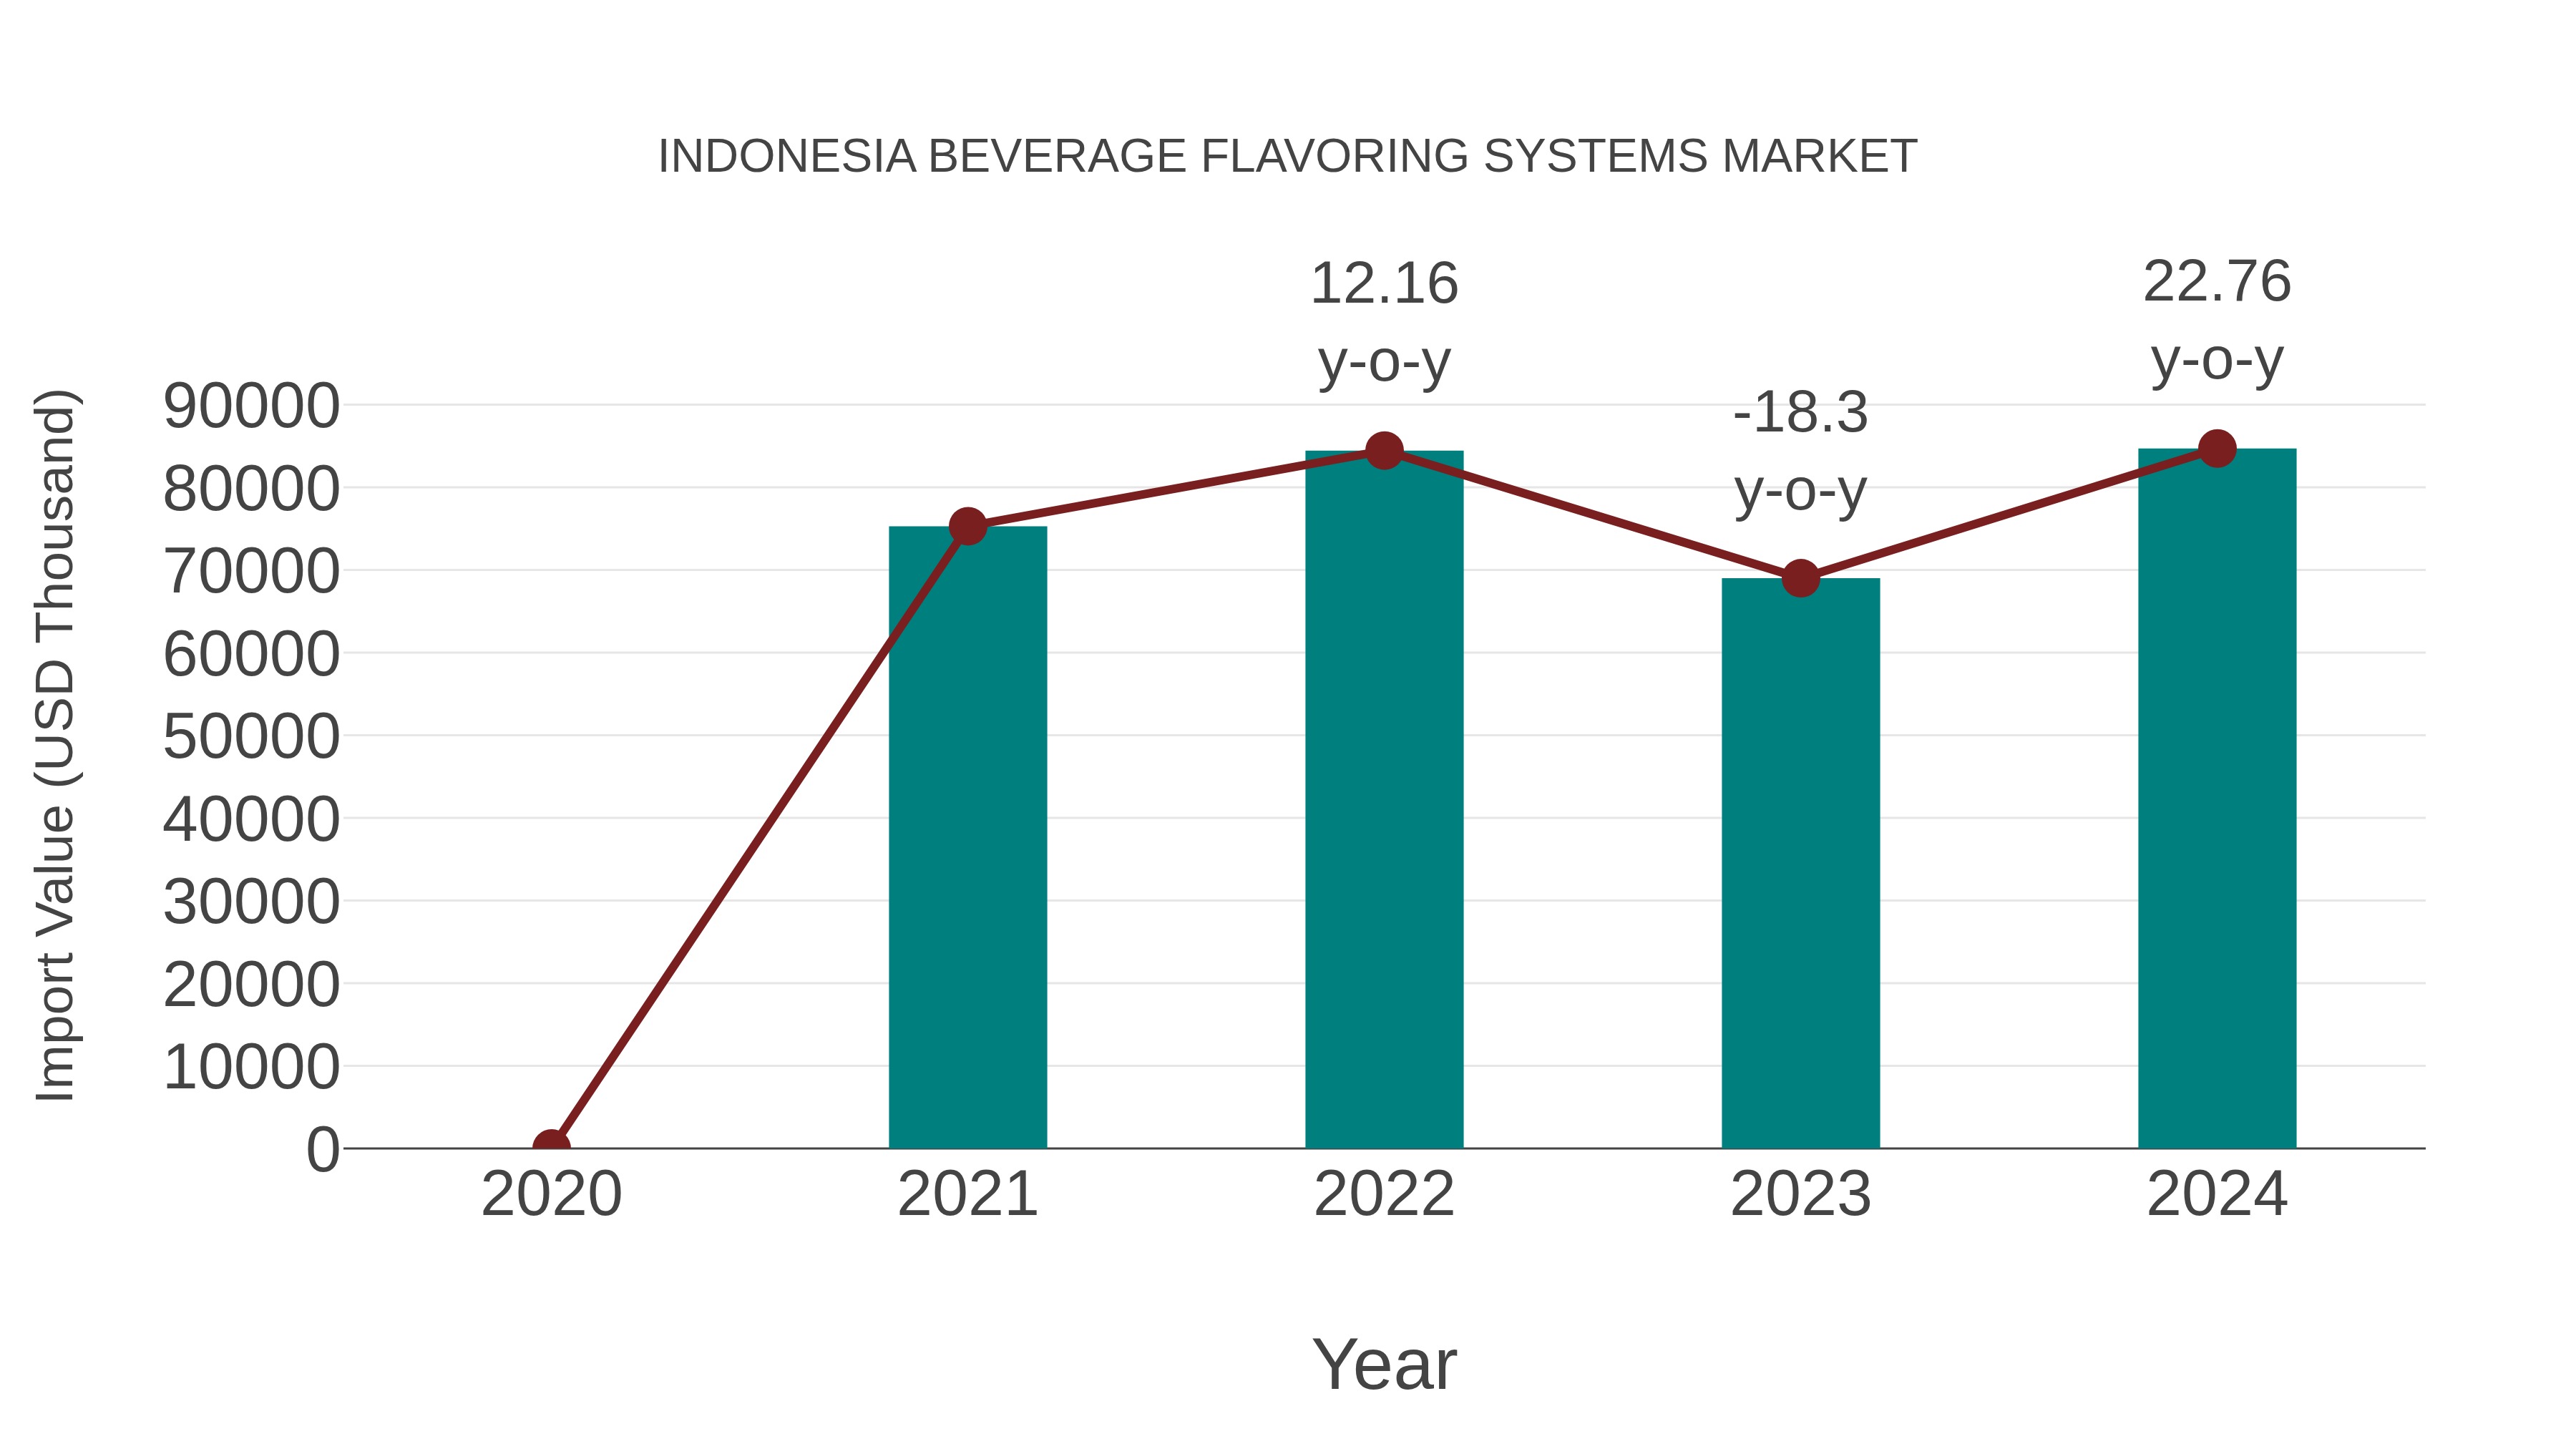
Indonesia Beverage Flavoring Systems Market: Import Trend Analysis
In the Indonesia beverage flavoring systems market, the import trend showed significant growth from 2023 to 2024, with a rate of 22.76%. The compound annual growth rate (CAGR) from 2020 to 2024 was 4.0%. This uptrend in imports can be attributed to the increasing demand for diverse flavor profiles and the country`s stable market conditions during this period.
Indonesia Beverage Flavoring Systems Market Overview
The beverage flavoring systems market in Indonesia is witnessing robust growth due to evolving consumer preferences for unique and customized beverage options. Manufacturers are investing in advanced flavoring systems to offer a wide array of choices in beverages, ranging from soft drinks to alcoholic beverages. The market is characterized by innovation and customization to cater to diverse consumer tastes.
Drivers of the Market
The beverage flavoring systems market in Indonesia is being driven by the desire to offer consumers customized taste experiences. As the beverage industry seeks to cater to diverse flavor preferences, the adoption of flavoring systems allows for the creation of unique and appealing beverages, addressing the evolving demands of consumers.
Challenges of the Market
The beverage flavoring systems market in Indonesia grapples with challenges related to consumer preferences and regulations. Adapting flavors to local tastes while complying with regulations on additives and labeling can be complex. Additionally, competition from local and international brands requires continuous innovation and marketing efforts to maintain market share and brand loyalty.
COVID-19 Impacts on the Market
The beverage flavoring systems market faced difficulties during the pandemic, as the foodservice industry was severely impacted. With reduced foot traffic in cafes and restaurants, the demand for beverage flavoring systems declined. Recovery in this market is closely linked to the reopening of the foodservice sector.
Key Players of the Makret
Companies like Givaudan, Firmenich, and Symrise are significant players in the beverage flavoring systems market. They supply flavoring solutions for a wide range of beverages, enhancing taste and aroma profiles.
Key Highlights of the Report:
- Indonesia Beverage Flavoring Systems Market Outlook
- Market Size of Indonesia Beverage Flavoring Systems Market, 2025
- Forecast of Indonesia Beverage Flavoring Systems Market, 2032
- Historical Data and Forecast of Indonesia Beverage Flavoring Systems Revenues & Volume for the Period 2022-2032F
- Indonesia Beverage Flavoring Systems Market Trend Evolution
- Indonesia Beverage Flavoring Systems Market Drivers and Challenges
- Indonesia Beverage Flavoring Systems Price Trends
- Indonesia Beverage Flavoring Systems Porter's Five Forces
- Indonesia Beverage Flavoring Systems Industry Life Cycle
- Historical Data and Forecast of Indonesia Beverage Flavoring Systems Market Revenues & Volume By Ingredient for the Period 2022-2032F
- Historical Data and Forecast of Indonesia Beverage Flavoring Systems Market Revenues & Volume By Flavorings for the Period 2022-2032F
- Historical Data and Forecast of Indonesia Beverage Flavoring Systems Market Revenues & Volume By Carriers for the Period 2022-2032F
- Historical Data and Forecast of Indonesia Beverage Flavoring Systems Market Revenues & Volume By Enhancers for the Period 2022-2032F
- Historical Data and Forecast of Indonesia Beverage Flavoring Systems Market Revenues & Volume By Type for the Period 2022-2032F
- Historical Data and Forecast of Indonesia Beverage Flavoring Systems Market Revenues & Volume By Browns for the Period 2022-2032F
- Historical Data and Forecast of Indonesia Beverage Flavoring Systems Market Revenues & Volume By Dairy for the Period 2022-2032F
- Historical Data and Forecast of Indonesia Beverage Flavoring Systems Market Revenues & Volume By Botanicals for the Period 2022-2032F
- Historical Data and Forecast of Indonesia Beverage Flavoring Systems Market Revenues & Volume By Fruits for the Period 2022-2032F
- Historical Data and Forecast of Indonesia Beverage Flavoring Systems Market Revenues & Volume By Origin for the Period 2022-2032F
- Historical Data and Forecast of Indonesia Beverage Flavoring Systems Market Revenues & Volume By Natural for the Period 2022-2032F
- Historical Data and Forecast of Indonesia Beverage Flavoring Systems Market Revenues & Volume By Artificial for the Period 2022-2032F
- Historical Data and Forecast of Indonesia Beverage Flavoring Systems Market Revenues & Volume By Nature-identical for the Period 2022-2032F
- Historical Data and Forecast of Indonesia Beverage Flavoring Systems Market Revenues & Volume By Form for the Period 2022-2032F
- Historical Data and Forecast of Indonesia Beverage Flavoring Systems Market Revenues & Volume By Dry for the Period 2022-2032F
- Historical Data and Forecast of Indonesia Beverage Flavoring Systems Market Revenues & Volume By Liquid for the Period 2022-2032F
- Historical Data and Forecast of Indonesia Beverage Flavoring Systems Market Revenues & Volume By Origin for the Period 2022-2032F
- Historical Data and Forecast of Indonesia Beverage Flavoring Systems Market Revenues & Volume By Natural for the Period 2022-2032F
- Historical Data and Forecast of Indonesia Beverage Flavoring Systems Market Revenues & Volume By Artificial for the Period 2022-2032F
- Historical Data and Forecast of Indonesia Beverage Flavoring Systems Market Revenues & Volume By Nature-identical for the Period 2022-2032F
- Indonesia Beverage Flavoring Systems Import Export Trade Statistics
- Market Opportunity Assessment By Ingredient
- Market Opportunity Assessment By Type
- Market Opportunity Assessment By Origin
- Market Opportunity Assessment By Form
- Market Opportunity Assessment By Origin
- Indonesia Beverage Flavoring Systems Top Companies Market Share
- Indonesia Beverage Flavoring Systems Competitive Benchmarking By Technical and Operational Parameters
- Indonesia Beverage Flavoring Systems Company Profiles
- Indonesia Beverage Flavoring Systems Key Strategic Recommendations
Indonesia Beverage Flavoring Systems Market (2026-2032): FAQs
6Wresearch actively monitors the Indonesia Beverage Flavoring Systems Market and publishes its comprehensive annual report, highlighting emerging trends, growth drivers, revenue analysis, and forecast outlook. Our insights help businesses to make data-backed strategic decisions with ongoing market dynamics. Our analysts track relevent industries related to the Indonesia Beverage Flavoring Systems Market, allowing our clients with actionable intelligence and reliable forecasts tailored to emerging regional needs.
Yes, we provide customisation as per your requirements. To learn more, feel free to contact us on sales@6wresearch.com
1 Executive Summary |
2 Introduction |
2.1 Key Highlights of the Report |
2.2 Report Description |
2.3 Market Scope & Segmentation |
2.4 Research Methodology |
2.5 Assumptions |
3 Indonesia Beverage Flavoring Systems Market Overview |
3.1 Indonesia Country Macro Economic Indicators |
3.2 Indonesia Beverage Flavoring Systems Market Revenues & Volume, 2022 & 2032F |
3.3 Indonesia Beverage Flavoring Systems Market - Industry Life Cycle |
3.4 Indonesia Beverage Flavoring Systems Market - Porter's Five Forces |
3.5 Indonesia Beverage Flavoring Systems Market Revenues & Volume Share, By Ingredient, 2022 & 2032F |
3.6 Indonesia Beverage Flavoring Systems Market Revenues & Volume Share, By Type, 2022 & 2032F |
3.7 Indonesia Beverage Flavoring Systems Market Revenues & Volume Share, By Origin, 2022 & 2032F |
3.8 Indonesia Beverage Flavoring Systems Market Revenues & Volume Share, By Form, 2022 & 2032F |
3.9 Indonesia Beverage Flavoring Systems Market Revenues & Volume Share, By Origin, 2022 & 2032F |
4 Indonesia Beverage Flavoring Systems Market Dynamics |
4.1 Impact Analysis |
4.2 Market Drivers |
4.2.1 Increasing demand for innovative and unique beverage flavors in Indonesia |
4.2.2 Growing consumer preference for natural and organic ingredients in beverages |
4.2.3 Rising disposable income and changing lifestyles driving the consumption of flavored beverages |
4.3 Market Restraints |
4.3.1 Fluctuating prices of raw materials impacting production costs |
4.3.2 Stringent food safety regulations and labeling requirements |
4.3.3 Limited availability of skilled labor for flavor development and production |
5 Indonesia Beverage Flavoring Systems Market Trends |
6 Indonesia Beverage Flavoring Systems Market, By Types |
6.1 Indonesia Beverage Flavoring Systems Market, By Ingredient |
6.1.1 Overview and Analysis |
6.1.2 Indonesia Beverage Flavoring Systems Market Revenues & Volume, By Ingredient, 2022-2032F |
6.1.3 Indonesia Beverage Flavoring Systems Market Revenues & Volume, By Flavorings, 2022-2032F |
6.1.4 Indonesia Beverage Flavoring Systems Market Revenues & Volume, By Carriers, 2022-2032F |
6.1.5 Indonesia Beverage Flavoring Systems Market Revenues & Volume, By Enhancers, 2022-2032F |
6.2 Indonesia Beverage Flavoring Systems Market, By Type |
6.2.1 Overview and Analysis |
6.2.2 Indonesia Beverage Flavoring Systems Market Revenues & Volume, By Browns, 2022-2032F |
6.2.3 Indonesia Beverage Flavoring Systems Market Revenues & Volume, By Dairy, 2022-2032F |
6.2.4 Indonesia Beverage Flavoring Systems Market Revenues & Volume, By Botanicals, 2022-2032F |
6.2.5 Indonesia Beverage Flavoring Systems Market Revenues & Volume, By Fruits, 2022-2032F |
6.3 Indonesia Beverage Flavoring Systems Market, By Origin |
6.3.1 Overview and Analysis |
6.3.2 Indonesia Beverage Flavoring Systems Market Revenues & Volume, By Natural, 2022-2032F |
6.3.3 Indonesia Beverage Flavoring Systems Market Revenues & Volume, By Artificial, 2022-2032F |
6.3.4 Indonesia Beverage Flavoring Systems Market Revenues & Volume, By Nature-identical, 2022-2032F |
6.4 Indonesia Beverage Flavoring Systems Market, By Form |
6.4.1 Overview and Analysis |
6.4.2 Indonesia Beverage Flavoring Systems Market Revenues & Volume, By Dry, 2022-2032F |
6.4.3 Indonesia Beverage Flavoring Systems Market Revenues & Volume, By Liquid, 2022-2032F |
6.5 Indonesia Beverage Flavoring Systems Market, By Origin |
6.5.1 Overview and Analysis |
6.5.2 Indonesia Beverage Flavoring Systems Market Revenues & Volume, By Natural, 2022-2032F |
6.5.3 Indonesia Beverage Flavoring Systems Market Revenues & Volume, By Artificial, 2022-2032F |
6.5.4 Indonesia Beverage Flavoring Systems Market Revenues & Volume, By Nature-identical, 2022-2032F |
7 Indonesia Beverage Flavoring Systems Market Import-Export Trade Statistics |
7.1 Indonesia Beverage Flavoring Systems Market Export to Major Countries |
7.2 Indonesia Beverage Flavoring Systems Market Imports from Major Countries |
8 Indonesia Beverage Flavoring Systems Market Key Performance Indicators |
8.1 Percentage of revenue from new flavor launches |
8.2 Customer satisfaction scores for flavor variety and quality |
8.3 Number of partnerships with local beverage manufacturers for flavor customization |
8.4 Research and development investment in new flavor formulations |
8.5 Percentage of repeat customers for flavored beverage products |
9 Indonesia Beverage Flavoring Systems Market - Opportunity Assessment |
9.1 Indonesia Beverage Flavoring Systems Market Opportunity Assessment, By Ingredient, 2022 & 2032F |
9.2 Indonesia Beverage Flavoring Systems Market Opportunity Assessment, By Type, 2022 & 2032F |
9.3 Indonesia Beverage Flavoring Systems Market Opportunity Assessment, By Origin, 2022 & 2032F |
9.4 Indonesia Beverage Flavoring Systems Market Opportunity Assessment, By Form, 2022 & 2032F |
9.5 Indonesia Beverage Flavoring Systems Market Opportunity Assessment, By Origin, 2022 & 2032F |
10 Indonesia Beverage Flavoring Systems Market - Competitive Landscape |
10.1 Indonesia Beverage Flavoring Systems Market Revenue Share, By Companies, 2025 |
10.2 Indonesia Beverage Flavoring Systems Market Competitive Benchmarking, By Operating and Technical Parameters |
11 Company Profiles |
12 Recommendations |
13 Disclaimer |
Export potential assessment - trade Analytics for 2030
Export potential enables firms to identify high-growth global markets with greater confidence by combining advanced trade intelligence with a structured quantitative methodology. The framework analyzes emerging demand trends and country-level import patterns while integrating macroeconomic and trade datasets such as GDP and population forecasts, bilateral import–export flows, tariff structures, elasticity differentials between developed and developing economies, geographic distance, and import demand projections. Using weighted trade values from 2020–2024 as the base period to project country-to-country export potential for 2030, these inputs are operationalized through calculated drivers such as gravity model parameters, tariff impact factors, and projected GDP per-capita growth. Through an analysis of hidden potentials, demand hotspots, and market conditions that are most favorable to success, this method enables firms to focus on target countries, maximize returns, and global expansion with data, backed by accuracy.
By factoring in the projected importer demand gap that is currently unmet and could be potential opportunity, it identifies the potential for the Exporter (Country) among 190 countries, against the general trade analysis, which identifies the biggest importer or exporter.
To discover high-growth global markets and optimize your business strategy:
Click Here
Pricing
- Single User License$ 1,995
- Department License$ 2,400
- Site License$ 3,120
- Global License$ 3,795

Search
Thought Leadership and Analyst Meet


Our Clients
Latest Reports
- Taiwan Food Delivery Platform Market (2026-2032) | Companies, Outlook, Analysis, Trends, Value, Revenue, Segmentation, Share, Forecast, Competitive Landscape, Growth, Size & Forecast
- United Kingdom (UK) Long-term Care Insurance Market (2026-2032) | Growth, Share, Consumer Insights, Drivers, Opportunities, Competition, Pricing Analysis, Segments, Restraints, Companies, Competitive, Value, Outlook, Size, Demand, Analysis, Challenges, Strategic Insights, Investment Trends, Revenue, Trends, Supply, Forecast
- United Kingdom (UK) Long Term Care Market (2026-2032) | Companies, Outlook, Analysis, Trends, Value, Revenue, Segmentation, Share, Forecast, Competitive Landscape, Growth, Size & Forecast
- Iraq Insulation and Waterproofing Market (2026-2032) | Outlook, Drivers, Growth, Size, Share, Industry, Revenue, Trends, Demand, Competitive, Strategic Insights, Opportunities, Segments, Companies, Challenges, Strategy, Consumer Insights, Analysis, Investment Trends, Value, Segmentation, Forecast, Restraints
- India Switchgear Market Outlook (2026-2032) | Size, Share, Trends, Growth, Revenue, Forecast, Analysis, Value, Outlook
- Pakistan Contraceptive Implants Market (2025-2031) | Demand, Growth, Size, Share, Industry, Pricing Analysis, Competitive, Strategic Insights, Strategy, Consumer Insights, Analysis, Investment Trends, Opportunities, Revenue, Segments, Value, Segmentation, Supply, Forecast, Restraints, Outlook, Competition, Drivers, Trends, Companies, Challenges
- Sri Lanka Packaging Market (2026-2032) | Outlook, Competition, Drivers, Trends, Demand, Pricing Analysis, Competitive, Strategic Insights, Companies, Challenges, Strategy, Consumer Insights, Analysis, Investment Trends, Opportunities, Growth, Size, Share, Industry, Revenue, Segments, Value, Segmentation, Supply, Forecast, Restraints
- India Kids Watches Market (2026-2032) | Strategy, Consumer Insights, Analysis, Investment Trends, Opportunities, Growth, Size, Share, Industry, Revenue, Segments, Value, Segmentation, Supply, Forecast, Restraints, Outlook, Competition, Drivers, Trends, Demand, Pricing Analysis, Competitive, Strategic Insights, Companies, Challenges
- Saudi Arabia Core Assurance Service Market (2025-2031) | Strategy, Consumer Insights, Analysis, Investment Trends, Opportunities, Growth, Size, Share, Industry, Revenue, Segments, Value, Segmentation, Supply, Forecast, Restraints, Outlook, Competition, Drivers, Trends, Demand, Pricing Analysis, Competitive, Strategic Insights, Companies, Challenges
- Romania Uninterruptible Power Supply (UPS) Market (2026-2032) | Industry, Analysis, Revenue, Size, Forecast, Outlook, Value, Trends, Share, Growth & Companies
Industry Events and Analyst Meet

India EV Show 2026

EV tech India Expo 2026

Auto Tech Asia 2026

Battery Tech India 2026

Smart Production Solutions Guangzhou 2026
Whitepaper
- Middle East & Africa Commercial Security Market Click here to view more.
- Middle East & Africa Fire Safety Systems & Equipment Market Click here to view more.
- GCC Drone Market Click here to view more.
- Middle East Lighting Fixture Market Click here to view more.
- GCC Physical & Perimeter Security Market Click here to view more.
6WResearch In News
- Doha a strategic location for EV manufacturing hub: IPA Qatar
- Demand for luxury TVs surging in the GCC, says Samsung
- Empowering Growth: The Thriving Journey of Bangladesh’s Cable Industry
- Demand for luxury TVs surging in the GCC, says Samsung
- Video call with a traditional healer? Once unthinkable, it’s now common in South Africa
- Intelligent Buildings To Smooth GCC’s Path To Net Zero