Indonesia Ceramic Inks Market (2026-2032) Outlook | Industry, Value, Growth, Trends, Companies, Revenue, Analysis, Share, Forecast & Size
Market Forecast By Type (Decorative , Functional), By Technology (Digital , Analog), By Application (Ceramic Tiles, Glass Printing, Food Container Printing) And Competitive Landscape
| Product Code: ETC4497629 | Publication Date: Jul 2023 | Updated Date: Mar 2026 | Product Type: Report | |
| Publisher: 6Wresearch | Author: Ravi Bhandari | No. of Pages: 85 | No. of Figures: 45 | No. of Tables: 25 |
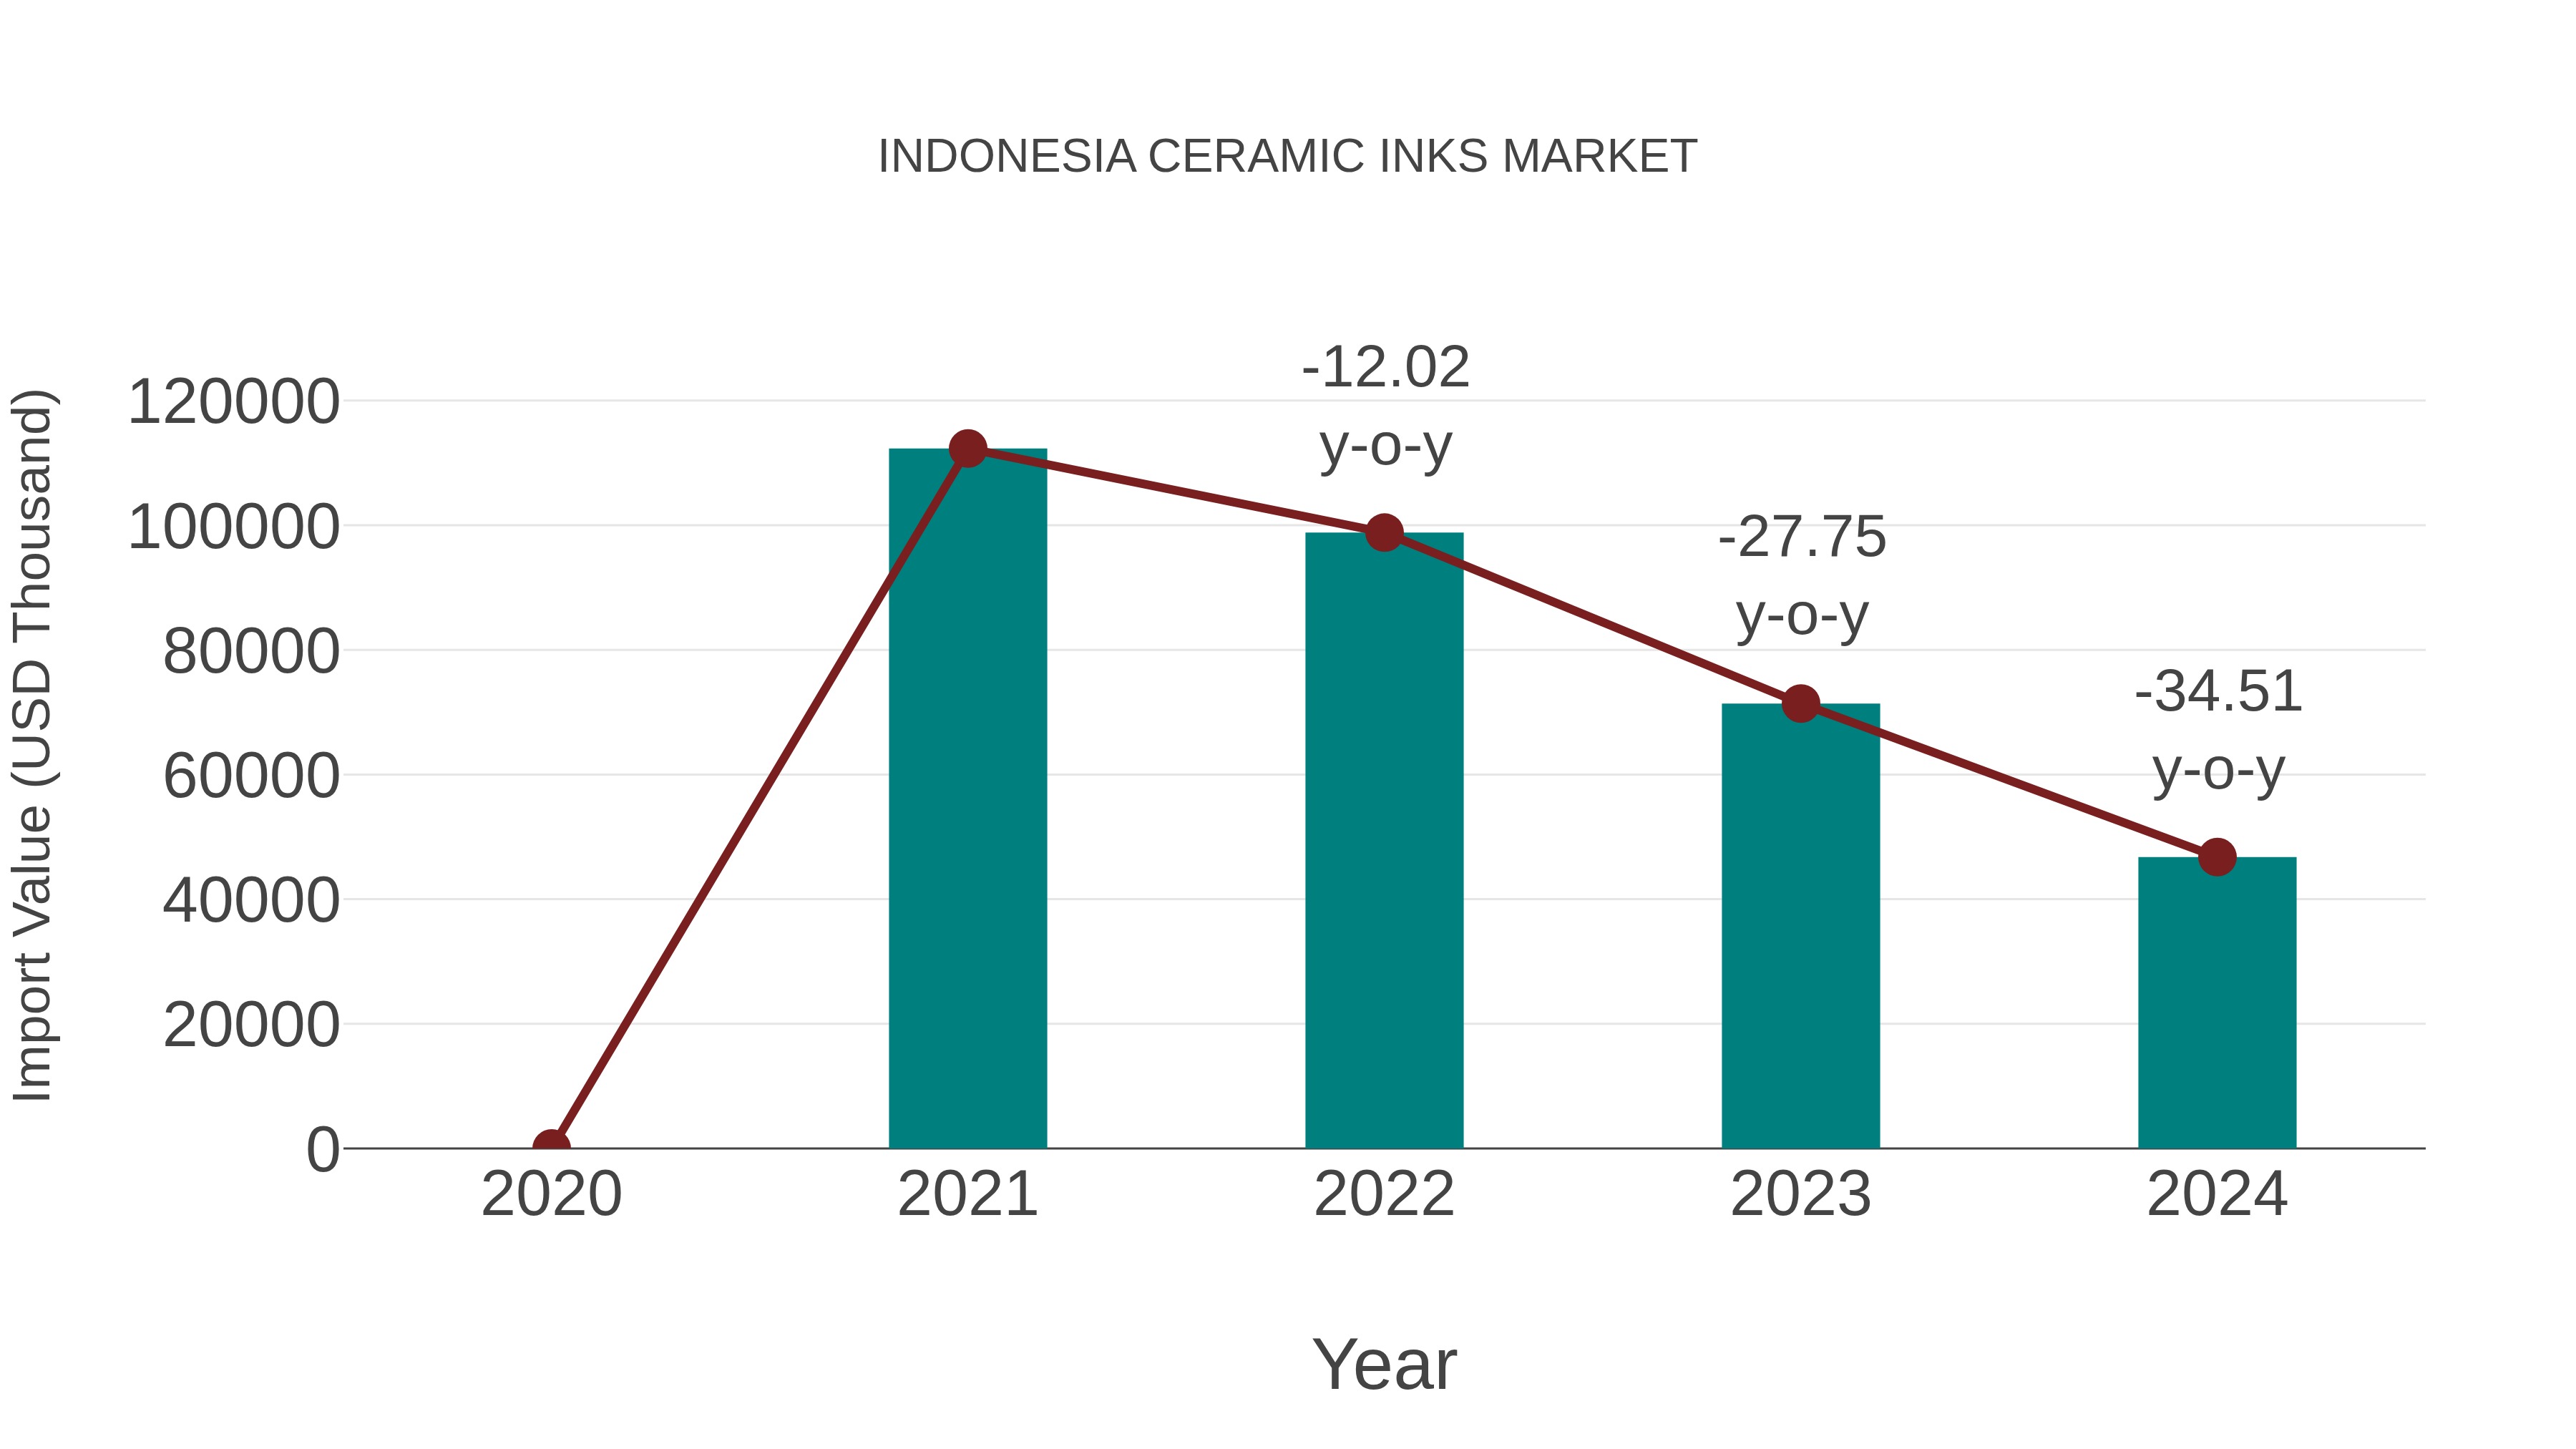
Indonesia Ceramic Inks Market: Import Trend Analysis
Indonesia`s import trend for ceramic inks in 2024 experienced a decline, with a growth rate of -34.51% compared to the previous year. The compound annual growth rate (CAGR) for the period 2020-2024 stood at -25.33%. This substantial decrease in import momentum may be attributed to shifts in demand, potentially influenced by changing consumer preferences or market conditions in the ceramic industry.
Indonesia Ceramic Inks Market Overview
The ceramic inks market in Indonesia is experiencing a surge in demand, primarily driven by the expanding ceramic tile industry. These inks are essential for achieving intricate designs and patterns on tiles and pottery. With a growing preference for aesthetically pleasing interiors and exteriors, the ceramic inks market is poised for sustained growth.
Drivers of the Market
The ceramic inks market in Indonesia is expanding as the country experiences growth in the ceramic tile and pottery industry. The rising construction and interior decoration sectors are driving the demand for ceramic tiles and related products. Ceramic inks play a crucial role in the printing of intricate designs and patterns on these products, thus supporting market growth.
Challenges of the Market
Challenges in the ceramic inks market include the need for compatibility with various printing methods and substrates. Developing inks that can work with different ceramic materials and printing technologies can be complex.
COVID-19 Impacts on the Market
The ceramic inks market in Indonesia has been driven by the expanding construction and ceramics industry. The COVID-19 pandemic had some impact, leading to a temporary decline in demand due to disruptions in the construction sector. The market has since seen a resurgence as construction activities resumed.
Key Players of the Makret
The market for ceramic inks in Indonesia is driven by companies like Ferro Corporation, Esmalglass-Itaca, and Zschimmer & Schwarz. These companies provide high-quality ceramic inks used in the decoration of ceramic tiles and tableware. The vibrant and diverse ceramic tile industry in Indonesia relies heavily on these ceramic inks for producing aesthetically pleasing and durable products.
Key Highlights of the Report:
- Indonesia Ceramic Inks Market Outlook
- Market Size of Indonesia Ceramic Inks Market, 2025
- Forecast of Indonesia Ceramic Inks Market, 2032
- Historical Data and Forecast of Indonesia Ceramic Inks Revenues & Volume for the Period 2022-2032F
- Indonesia Ceramic Inks Market Trend Evolution
- Indonesia Ceramic Inks Market Drivers and Challenges
- Indonesia Ceramic Inks Price Trends
- Indonesia Ceramic Inks Porter's Five Forces
- Indonesia Ceramic Inks Industry Life Cycle
- Historical Data and Forecast of Indonesia Ceramic Inks Market Revenues & Volume By Type for the Period 2022-2032F
- Historical Data and Forecast of Indonesia Ceramic Inks Market Revenues & Volume By Decorative for the Period 2022-2032F
- Historical Data and Forecast of Indonesia Ceramic Inks Market Revenues & Volume By Functional for the Period 2022-2032F
- Historical Data and Forecast of Indonesia Ceramic Inks Market Revenues & Volume By Technology for the Period 2022-2032F
- Historical Data and Forecast of Indonesia Ceramic Inks Market Revenues & Volume By Digital for the Period 2022-2032F
- Historical Data and Forecast of Indonesia Ceramic Inks Market Revenues & Volume By Analog for the Period 2022-2032F
- Historical Data and Forecast of Indonesia Ceramic Inks Market Revenues & Volume By Application for the Period 2022-2032F
- Historical Data and Forecast of Indonesia Ceramic Inks Market Revenues & Volume By Ceramic Tiles for the Period 2022-2032F
- Historical Data and Forecast of Indonesia Ceramic Inks Market Revenues & Volume By Glass Printing for the Period 2022-2032F
- Historical Data and Forecast of Indonesia Ceramic Inks Market Revenues & Volume By Food Container Printing for the Period 2022-2032F
- Indonesia Ceramic Inks Import Export Trade Statistics
- Market Opportunity Assessment By Type
- Market Opportunity Assessment By Technology
- Market Opportunity Assessment By Application
- Indonesia Ceramic Inks Top Companies Market Share
- Indonesia Ceramic Inks Competitive Benchmarking By Technical and Operational Parameters
- Indonesia Ceramic Inks Company Profiles
- Indonesia Ceramic Inks Key Strategic Recommendations
Indonesia Ceramic Inks Market (2026-2032): FAQs
6Wresearch actively monitors the Indonesia Ceramic Inks Market and publishes its comprehensive annual report, highlighting emerging trends, growth drivers, revenue analysis, and forecast outlook. Our insights help businesses to make data-backed strategic decisions with ongoing market dynamics. Our analysts track relevent industries related to the Indonesia Ceramic Inks Market, allowing our clients with actionable intelligence and reliable forecasts tailored to emerging regional needs.
Yes, we provide customisation as per your requirements. To learn more, feel free to contact us on sales@6wresearch.com
1 Executive Summary |
2 Introduction |
2.1 Key Highlights of the Report |
2.2 Report Description |
2.3 Market Scope & Segmentation |
2.4 Research Methodology |
2.5 Assumptions |
3 Indonesia Ceramic Inks Market Overview |
3.1 Indonesia Country Macro Economic Indicators |
3.2 Indonesia Ceramic Inks Market Revenues & Volume, 2022 & 2032F |
3.3 Indonesia Ceramic Inks Market - Industry Life Cycle |
3.4 Indonesia Ceramic Inks Market - Porter's Five Forces |
3.5 Indonesia Ceramic Inks Market Revenues & Volume Share, By Type, 2022 & 2032F |
3.6 Indonesia Ceramic Inks Market Revenues & Volume Share, By Technology, 2022 & 2032F |
3.7 Indonesia Ceramic Inks Market Revenues & Volume Share, By Application, 2022 & 2032F |
4 Indonesia Ceramic Inks Market Dynamics |
4.1 Impact Analysis |
4.2 Market Drivers |
4.2.1 Growth in the construction industry leading to increased demand for ceramic tiles and subsequently ceramic inks. |
4.2.2 Technological advancements in ceramic ink formulations improving product quality and performance. |
4.2.3 Rising disposable income and changing consumer preferences favoring customized ceramic products. |
4.3 Market Restraints |
4.3.1 Fluctuations in raw material prices impacting production costs. |
4.3.2 Environmental regulations and sustainability concerns affecting the use of certain types of ceramic inks. |
4.3.3 Intense competition from alternative materials like digital printing technologies. |
5 Indonesia Ceramic Inks Market Trends |
6 Indonesia Ceramic Inks Market, By Types |
6.1 Indonesia Ceramic Inks Market, By Type |
6.1.1 Overview and Analysis |
6.1.2 Indonesia Ceramic Inks Market Revenues & Volume, By Type, 2022-2032F |
6.1.3 Indonesia Ceramic Inks Market Revenues & Volume, By Decorative , 2022-2032F |
6.1.4 Indonesia Ceramic Inks Market Revenues & Volume, By Functional, 2022-2032F |
6.2 Indonesia Ceramic Inks Market, By Technology |
6.2.1 Overview and Analysis |
6.2.2 Indonesia Ceramic Inks Market Revenues & Volume, By Digital , 2022-2032F |
6.2.3 Indonesia Ceramic Inks Market Revenues & Volume, By Analog, 2022-2032F |
6.3 Indonesia Ceramic Inks Market, By Application |
6.3.1 Overview and Analysis |
6.3.2 Indonesia Ceramic Inks Market Revenues & Volume, By Ceramic Tiles, 2022-2032F |
6.3.3 Indonesia Ceramic Inks Market Revenues & Volume, By Glass Printing, 2022-2032F |
6.3.4 Indonesia Ceramic Inks Market Revenues & Volume, By Food Container Printing, 2022-2032F |
7 Indonesia Ceramic Inks Market Import-Export Trade Statistics |
7.1 Indonesia Ceramic Inks Market Export to Major Countries |
7.2 Indonesia Ceramic Inks Market Imports from Major Countries |
8 Indonesia Ceramic Inks Market Key Performance Indicators |
8.1 Research and development investment in innovative ceramic ink formulations. |
8.2 Consumer sentiment towards customization and personalized ceramic products. |
8.3 Adoption rate of digital printing technologies in the ceramic industry. |
9 Indonesia Ceramic Inks Market - Opportunity Assessment |
9.1 Indonesia Ceramic Inks Market Opportunity Assessment, By Type, 2022 & 2032F |
9.2 Indonesia Ceramic Inks Market Opportunity Assessment, By Technology, 2022 & 2032F |
9.3 Indonesia Ceramic Inks Market Opportunity Assessment, By Application, 2022 & 2032F |
10 Indonesia Ceramic Inks Market - Competitive Landscape |
10.1 Indonesia Ceramic Inks Market Revenue Share, By Companies, 2025 |
10.2 Indonesia Ceramic Inks Market Competitive Benchmarking, By Operating and Technical Parameters |
11 Company Profiles |
12 Recommendations |
13 Disclaimer |
Export potential assessment - trade Analytics for 2030
Export potential enables firms to identify high-growth global markets with greater confidence by combining advanced trade intelligence with a structured quantitative methodology. The framework analyzes emerging demand trends and country-level import patterns while integrating macroeconomic and trade datasets such as GDP and population forecasts, bilateral import–export flows, tariff structures, elasticity differentials between developed and developing economies, geographic distance, and import demand projections. Using weighted trade values from 2020–2024 as the base period to project country-to-country export potential for 2030, these inputs are operationalized through calculated drivers such as gravity model parameters, tariff impact factors, and projected GDP per-capita growth. Through an analysis of hidden potentials, demand hotspots, and market conditions that are most favorable to success, this method enables firms to focus on target countries, maximize returns, and global expansion with data, backed by accuracy.
By factoring in the projected importer demand gap that is currently unmet and could be potential opportunity, it identifies the potential for the Exporter (Country) among 190 countries, against the general trade analysis, which identifies the biggest importer or exporter.
To discover high-growth global markets and optimize your business strategy:
Click Here
Pricing
- Single User License$ 1,995
- Department License$ 2,400
- Site License$ 3,120
- Global License$ 3,795

Search
Thought Leadership and Analyst Meet


Our Clients
Latest Reports
- Philippines Polyhydroxybutyrate-co-Hydroxyvalerate Market (2026-2032) | Trends, Insights, Challenges, Restraints, Competition, Size, Value, Forecast, Pricing, Share, Outlook, Revenue, Investment Opportunities, Strategy, Drivers, Demand, Growth, segmentation, Analysis, Companies
- Peru Polyhydroxybutyrate-co-Hydroxyvalerate Market (2026-2032) | Growth, Demand, Challenges, Share, Trends, Analysis, Pricing, Investment Opportunities, Drivers, Value, Forecast, Competition, Size, Companies, Insights, Outlook, Restraints, segmentation, Revenue, Strategy
- Pakistan Polyhydroxybutyrate-co-Hydroxyvalerate Market (2026-2032) | Restraints, segmentation, Pricing, Forecast, Share, Strategy, Competition, Trends, Insights, Drivers, Challenges, Growth, Revenue, Outlook, Value, Investment Opportunities, Companies, Size, Analysis, Demand
- Oman Polyhydroxybutyrate-co-Hydroxyvalerate Market (2026-2032) | Drivers, segmentation, Insights, Competition, Pricing, Outlook, Size, Revenue, Challenges, Forecast, Analysis, Growth, Value, Share, Trends, Investment Opportunities, Strategy, Restraints, Companies, Demand
- Nigeria Polyhydroxybutyrate-co-Hydroxyvalerate Market (2026-2032) | Value, Investment Opportunities, Analysis, Revenue, Restraints, Pricing, Outlook, Competition, Demand, Growth, Forecast, Companies, Trends, Challenges, segmentation, Drivers, Insights, Share, Size, Strategy
- Nepal Polyhydroxybutyrate-co-Hydroxyvalerate Market (2026-2032) | Insights, Analysis, Drivers, Share, Revenue, Demand, segmentation, Investment Opportunities, Competition, Forecast, Growth, Pricing, Companies, Strategy, Trends, Restraints, Challenges, Outlook, Size, Value
- Myanmar Polyhydroxybutyrate-co-Hydroxyvalerate Market (2026-2032) | Outlook, Revenue, Strategy, Restraints, Drivers, segmentation, Share, Forecast, Competition, Insights, Growth, Pricing, Size, Demand, Value, Companies, Trends, Challenges, Investment Opportunities, Analysis
- Morocco Polyhydroxybutyrate-co-Hydroxyvalerate Market (2026-2032) | Outlook, Investment Opportunities, Restraints, Strategy, Forecast, Challenges, Drivers, Growth, Companies, segmentation, Trends, Size, Competition, Revenue, Demand, Insights, Share, Analysis, Value, Pricing
- Mexico Polyhydroxybutyrate-co-Hydroxyvalerate Market (2026-2032) | Size, Drivers, Outlook, Share, Strategy, Growth, Pricing, Challenges, Companies, Demand, Value, Investment Opportunities, Restraints, Trends, Forecast, segmentation, Analysis, Insights, Competition, Revenue
- Malaysia Polyhydroxybutyrate-co-Hydroxyvalerate Market (2026-2032) | Share, segmentation, Size, Companies, Analysis, Insights, Forecast, Value, Revenue, Drivers, Restraints, Challenges, Investment Opportunities, Trends, Competition, Strategy, Demand, Growth, Outlook, Pricing
Industry Events and Analyst Meet

HIMTEX 2026

India Refining Summit 2026

India EV Show 2026

EV tech India Expo 2026

Auto Tech Asia 2026
Whitepaper
- Middle East & Africa Commercial Security Market Click here to view more.
- Middle East & Africa Fire Safety Systems & Equipment Market Click here to view more.
- GCC Drone Market Click here to view more.
- Middle East Lighting Fixture Market Click here to view more.
- GCC Physical & Perimeter Security Market Click here to view more.
6WResearch In News
- Doha a strategic location for EV manufacturing hub: IPA Qatar
- Demand for luxury TVs surging in the GCC, says Samsung
- Empowering Growth: The Thriving Journey of Bangladesh’s Cable Industry
- Demand for luxury TVs surging in the GCC, says Samsung
- Video call with a traditional healer? Once unthinkable, it’s now common in South Africa
- Intelligent Buildings To Smooth GCC’s Path To Net Zero