Indonesia Dried Fruit Snacks Market (2026-2032) | Value, Competitive Landscape, Analysis, Share, Size & Revenue, Segmentation, Companies, Outlook, Trends, Industry, Growth, Forecast
Market Forecast By Fruit Type (Raisins (Dried Grapes), Tropical & Exotic Fruits, Berries), By Form (Slices & Granulates, Powder, Whole Dried Fruits), By Nature (Organic, Conventional), By End-User (Individual, Food Service Providers, Food Processing Industry) And Competitive Landscape
| Product Code: ETC7563618 | Publication Date: Sep 2024 | Updated Date: Feb 2026 | Product Type: Market Research Report | |
| Publisher: 6Wresearch | Author: Sumit Sagar | No. of Pages: 75 | No. of Figures: 35 | No. of Tables: 20 |
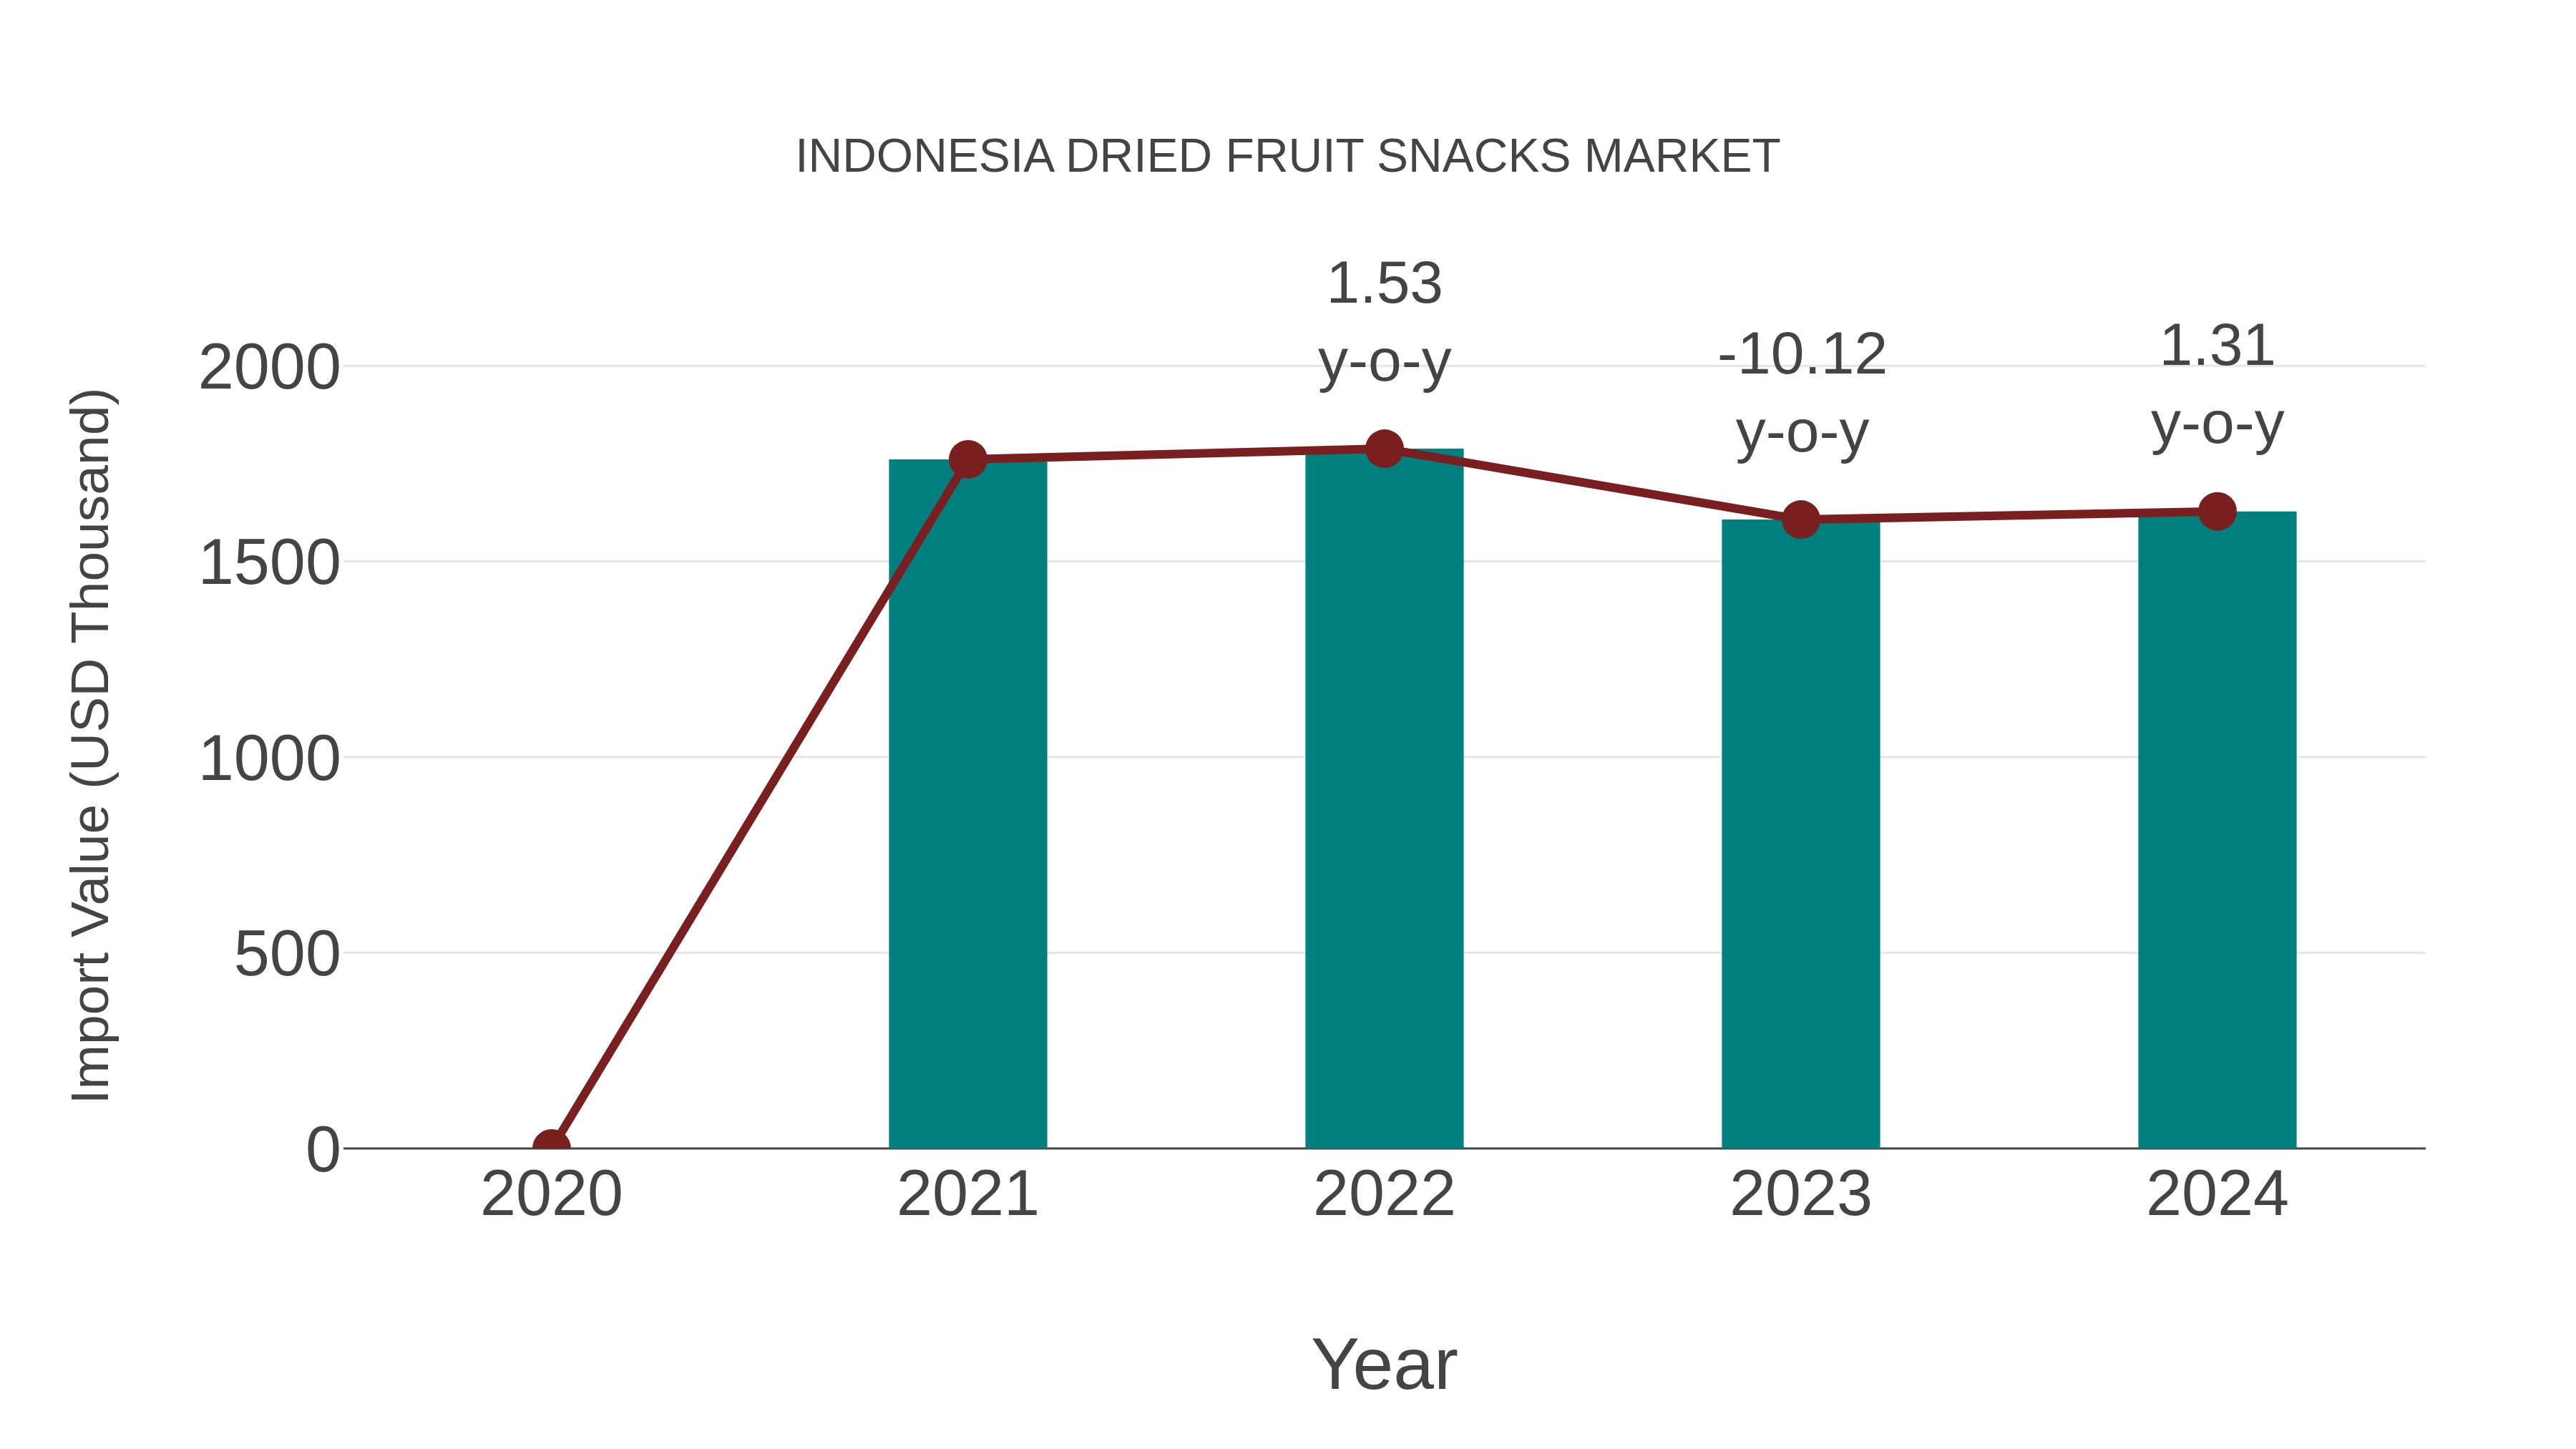
Indonesia Dried Fruit Snacks Market: Import Trend Analysis
In the Indonesia dried fruit snacks market, the import trend showed a growth rate of 1.31% from 2023 to 2024, with a compound annual growth rate (CAGR) of -2.58% from 2020 to 2024. This decline could be attributed to shifting consumer preferences towards healthier snack options, impacting the demand for traditional dried fruit snacks.
Key Highlights of the Report:
- Indonesia Dried Fruit Snacks Market Outlook
- Market Size of Indonesia Dried Fruit Snacks Market, 2025
- Forecast of Indonesia Dried Fruit Snacks Market, 2032
- Historical Data and Forecast of Indonesia Dried Fruit Snacks Revenues & Volume for the Period 2022-2032F
- Indonesia Dried Fruit Snacks Market Trend Evolution
- Indonesia Dried Fruit Snacks Market Drivers and Challenges
- Indonesia Dried Fruit Snacks Price Trends
- Indonesia Dried Fruit Snacks Porter's Five Forces
- Indonesia Dried Fruit Snacks Industry Life Cycle
- Historical Data and Forecast of Indonesia Dried Fruit Snacks Market Revenues & Volume By Fruit Type for the Period 2022-2032F
- Historical Data and Forecast of Indonesia Dried Fruit Snacks Market Revenues & Volume By Raisins (Dried Grapes) for the Period 2022-2032F
- Historical Data and Forecast of Indonesia Dried Fruit Snacks Market Revenues & Volume By Tropical & Exotic Fruits for the Period 2022-2032F
- Historical Data and Forecast of Indonesia Dried Fruit Snacks Market Revenues & Volume By Berries for the Period 2022-2032F
- Historical Data and Forecast of Indonesia Dried Fruit Snacks Market Revenues & Volume By Form for the Period 2022-2032F
- Historical Data and Forecast of Indonesia Dried Fruit Snacks Market Revenues & Volume By Slices & Granulates for the Period 2022-2032F
- Historical Data and Forecast of Indonesia Dried Fruit Snacks Market Revenues & Volume By Powder for the Period 2022-2032F
- Historical Data and Forecast of Indonesia Dried Fruit Snacks Market Revenues & Volume By Whole Dried Fruits for the Period 2022-2032F
- Historical Data and Forecast of Indonesia Dried Fruit Snacks Market Revenues & Volume By Nature for the Period 2022-2032F
- Historical Data and Forecast of Indonesia Dried Fruit Snacks Market Revenues & Volume By Organic for the Period 2022-2032F
- Historical Data and Forecast of Indonesia Dried Fruit Snacks Market Revenues & Volume By Conventional for the Period 2022-2032F
- Historical Data and Forecast of Indonesia Dried Fruit Snacks Market Revenues & Volume By End-User for the Period 2022-2032F
- Historical Data and Forecast of Indonesia Dried Fruit Snacks Market Revenues & Volume By Individual for the Period 2022-2032F
- Historical Data and Forecast of Indonesia Dried Fruit Snacks Market Revenues & Volume By Food Service Providers for the Period 2022-2032F
- Historical Data and Forecast of Indonesia Dried Fruit Snacks Market Revenues & Volume By Food Processing Industry for the Period 2022-2032F
- Indonesia Dried Fruit Snacks Import Export Trade Statistics
- Market Opportunity Assessment By Fruit Type
- Market Opportunity Assessment By Form
- Market Opportunity Assessment By Nature
- Market Opportunity Assessment By End-User
- Indonesia Dried Fruit Snacks Top Companies Market Share
- Indonesia Dried Fruit Snacks Competitive Benchmarking By Technical and Operational Parameters
- Indonesia Dried Fruit Snacks Company Profiles
- Indonesia Dried Fruit Snacks Key Strategic Recommendations
Frequently Asked Questions About the Market Study (FAQs):
6Wresearch actively monitors the Indonesia Dried Fruit Snacks Market and publishes its comprehensive annual report, highlighting emerging trends, growth drivers, revenue analysis, and forecast outlook. Our insights help businesses to make data-backed strategic decisions with ongoing market dynamics. Our analysts track relevent industries related to the Indonesia Dried Fruit Snacks Market, allowing our clients with actionable intelligence and reliable forecasts tailored to emerging regional needs.
Yes, we provide customisation as per your requirements. To learn more, feel free to contact us on sales@6wresearch.com
1 Executive Summary |
2 Introduction |
2.1 Key Highlights of the Report |
2.2 Report Description |
2.3 Market Scope & Segmentation |
2.4 Research Methodology |
2.5 Assumptions |
3 Indonesia Dried Fruit Snacks Market Overview |
3.1 Indonesia Country Macro Economic Indicators |
3.2 Indonesia Dried Fruit Snacks Market Revenues & Volume, 2022 & 2032F |
3.3 Indonesia Dried Fruit Snacks Market - Industry Life Cycle |
3.4 Indonesia Dried Fruit Snacks Market - Porter's Five Forces |
3.5 Indonesia Dried Fruit Snacks Market Revenues & Volume Share, By Fruit Type, 2022 & 2032F |
3.6 Indonesia Dried Fruit Snacks Market Revenues & Volume Share, By Form, 2022 & 2032F |
3.7 Indonesia Dried Fruit Snacks Market Revenues & Volume Share, By Nature, 2022 & 2032F |
3.8 Indonesia Dried Fruit Snacks Market Revenues & Volume Share, By End-User, 2022 & 2032F |
4 Indonesia Dried Fruit Snacks Market Dynamics |
4.1 Impact Analysis |
4.2 Market Drivers |
4.2.1 Increasing consumer awareness about health and wellness leading to a preference for healthier snack options like dried fruit snacks. |
4.2.2 Growing demand for convenient and on-the-go snack options due to busy lifestyles. |
4.2.3 Rising disposable incomes and changing consumer preferences towards natural and organic food products. |
4.2.4 Expansion of retail channels and e-commerce platforms increasing accessibility and availability of dried fruit snacks. |
4.2.5 Innovation in product offerings and flavors to cater to evolving consumer tastes and preferences. |
4.3 Market Restraints |
4.3.1 Seasonal availability and fluctuations in supply of fresh fruits impacting the production of dried fruit snacks. |
4.3.2 Price volatility of raw materials affecting the cost of production and pricing of dried fruit snacks. |
4.3.3 Competition from other snack categories like chips, chocolates, and nuts impacting market penetration and growth. |
4.3.4 Challenges in maintaining product quality and freshness during packaging and distribution. |
4.3.5 Regulatory hurdles and compliance requirements related to food safety and labeling impacting market entry and expansion. |
5 Indonesia Dried Fruit Snacks Market Trends |
6 Indonesia Dried Fruit Snacks Market, By Types |
6.1 Indonesia Dried Fruit Snacks Market, By Fruit Type |
6.1.1 Overview and Analysis |
6.1.2 Indonesia Dried Fruit Snacks Market Revenues & Volume, By Fruit Type, 2022-2032F |
6.1.3 Indonesia Dried Fruit Snacks Market Revenues & Volume, By Raisins (Dried Grapes), 2022-2032F |
6.1.4 Indonesia Dried Fruit Snacks Market Revenues & Volume, By Tropical & Exotic Fruits, 2022-2032F |
6.1.5 Indonesia Dried Fruit Snacks Market Revenues & Volume, By Berries, 2022-2032F |
6.2 Indonesia Dried Fruit Snacks Market, By Form |
6.2.1 Overview and Analysis |
6.2.2 Indonesia Dried Fruit Snacks Market Revenues & Volume, By Slices & Granulates, 2022-2032F |
6.2.3 Indonesia Dried Fruit Snacks Market Revenues & Volume, By Powder, 2022-2032F |
6.2.4 Indonesia Dried Fruit Snacks Market Revenues & Volume, By Whole Dried Fruits, 2022-2032F |
6.3 Indonesia Dried Fruit Snacks Market, By Nature |
6.3.1 Overview and Analysis |
6.3.2 Indonesia Dried Fruit Snacks Market Revenues & Volume, By Organic, 2022-2032F |
6.3.3 Indonesia Dried Fruit Snacks Market Revenues & Volume, By Conventional, 2022-2032F |
6.4 Indonesia Dried Fruit Snacks Market, By End-User |
6.4.1 Overview and Analysis |
6.4.2 Indonesia Dried Fruit Snacks Market Revenues & Volume, By Individual, 2022-2032F |
6.4.3 Indonesia Dried Fruit Snacks Market Revenues & Volume, By Food Service Providers, 2022-2032F |
6.4.4 Indonesia Dried Fruit Snacks Market Revenues & Volume, By Food Processing Industry, 2022-2032F |
7 Indonesia Dried Fruit Snacks Market Import-Export Trade Statistics |
7.1 Indonesia Dried Fruit Snacks Market Export to Major Countries |
7.2 Indonesia Dried Fruit Snacks Market Imports from Major Countries |
8 Indonesia Dried Fruit Snacks Market Key Performance Indicators |
8.1 Consumer engagement metrics such as social media interactions, website traffic, and online reviews indicating interest and demand for dried fruit snacks. |
8.2 Customer retention rates and repeat purchase frequency reflecting product satisfaction and brand loyalty. |
8.3 Distribution network expansion metrics like number of new retail partnerships, geographic coverage, and shelf space allocation. |
8.4 Product innovation success rate measured by the launch of new flavors or variants and their acceptance in the market. |
8.5 Sustainability initiatives and certifications showcasing commitment to ethical sourcing, environmental responsibility, and community impact. |
9 Indonesia Dried Fruit Snacks Market - Opportunity Assessment |
9.1 Indonesia Dried Fruit Snacks Market Opportunity Assessment, By Fruit Type, 2022 & 2032F |
9.2 Indonesia Dried Fruit Snacks Market Opportunity Assessment, By Form, 2022 & 2032F |
9.3 Indonesia Dried Fruit Snacks Market Opportunity Assessment, By Nature, 2022 & 2032F |
9.4 Indonesia Dried Fruit Snacks Market Opportunity Assessment, By End-User, 2022 & 2032F |
10 Indonesia Dried Fruit Snacks Market - Competitive Landscape |
10.1 Indonesia Dried Fruit Snacks Market Revenue Share, By Companies, 2025 |
10.2 Indonesia Dried Fruit Snacks Market Competitive Benchmarking, By Operating and Technical Parameters |
11 Company Profiles |
12 Recommendations |
13 Disclaimer |
Global Go To Market Strategy - 2030
Export potential enables firms to identify high-growth global markets with greater confidence by combining advanced trade intelligence with a structured quantitative methodology. The framework analyzes emerging demand trends and country-level import patterns while integrating macroeconomic and trade datasets such as GDP and population forecasts, bilateral import–export flows, tariff structures, elasticity differentials between developed and developing economies, geographic distance, and import demand projections. Using weighted trade values from 2020–2024 as the base period to project country-to-country export potential for 2030, these inputs are operationalized through calculated drivers such as gravity model parameters, tariff impact factors, and projected GDP per-capita growth. Through an analysis of hidden potentials, demand hotspots, and market conditions that are most favorable to success, this method enables firms to focus on target countries, maximize returns, and global expansion with data, backed by accuracy.
By factoring in the projected importer demand gap that is currently unmet and could be potential opportunity, it identifies the potential for the Exporter (Country) among 190 countries, against the general trade analysis, which identifies the biggest importer or exporter.
To discover high-growth global markets and optimize your business strategy:
Click Here
Pricing
- Single User License$ 1,995
- Department License$ 2,400
- Site License$ 3,120
- Global License$ 3,795

Leadership Perspectives from Industry Events
Search
Thought Leadership and Analyst Meet


Our Clients
6WResearch In News
- India Air Conditioner Market Set for Strong Rebound in 2026 After Weather-Led Correction and GST-Driven Recovery: 6Wresearch
- ADAS in India: How Automatic Emergency Braking, Blind Spot Detection & Driver Monitoring are Transforming Road Safety
- Doha a strategic location for EV manufacturing hub: IPA Qatar
- Demand for luxury TVs surging in the GCC, says Samsung
- Empowering Growth: The Thriving Journey of Bangladesh’s Cable Industry
- Demand for luxury TVs surging in the GCC, says Samsung
Latest Reports
- Poland Fire Protection Systems Market (2026-2032)
- Cape Verde Portable Hand-Thrown Extinguisher Market (2026-2032)
- Canada Portable Hand-Thrown Extinguisher Market (2026-2032)
- Cameroon Portable Hand-Thrown Extinguisher Market (2026-2032)
- Burundi Portable Hand-Thrown Extinguisher Market (2026-2032)
- Burkina Faso Portable Hand-Thrown Extinguisher Market (2026-2032)
- Bulgaria Portable Hand-Thrown Extinguisher Market (2026-2032)
- Brunei Portable Hand-Thrown Extinguisher Market (2026-2032)
- Botswana Portable Hand-Thrown Extinguisher Market (2026-2032)
- Bosnia and Herzegovina Portable Hand-Thrown Extinguisher Market (2026-2032)
Industry Events and Analyst Meet

HIMTEX 2026

India Refining Summit 2026

India EV Show 2026

EV tech India Expo 2026

Auto Tech Asia 2026
Whitepaper
- Middle East & Africa Commercial Security Market Click here to view more.
- Middle East & Africa Fire Safety Systems & Equipment Market Click here to view more.
- GCC Drone Market Click here to view more.
- Middle East Lighting Fixture Market Click here to view more.
- GCC Physical & Perimeter Security Market Click here to view more.