Indonesia E Coat Market (2026-2032) | Share, Segments, Competition, Restraints, Segmentation, Analysis, Competitive, Size, Industry, Outlook, Growth, Investment Trends, Value, Drivers, Strategy, Opportunities, Pricing Analysis, Supply, Trends, Consumer Insights, Revenue, Challenges, Demand, Companies, Forecast, Strategic Insights
Market Forecast By Type (Cathodic Epoxy E-Coat, Cathodic Acrylic E-Coat, Anodic E-Coat), By Application (Automotive, Industrial Equipment, Consumer Goods), By Technology (UV-Cured E-Coat, Thermal Cured E-Coat), By End-Use (Automotive & Transportation, Construction, Appliances) And Competitive Landscape
| Product Code: ETC12032719 | Publication Date: Apr 2025 | Updated Date: Mar 2026 | Product Type: Market Research Report | |
| Publisher: 6Wresearch | Author: Sachin Kumar Rai | No. of Pages: 65 | No. of Figures: 34 | No. of Tables: 19 |
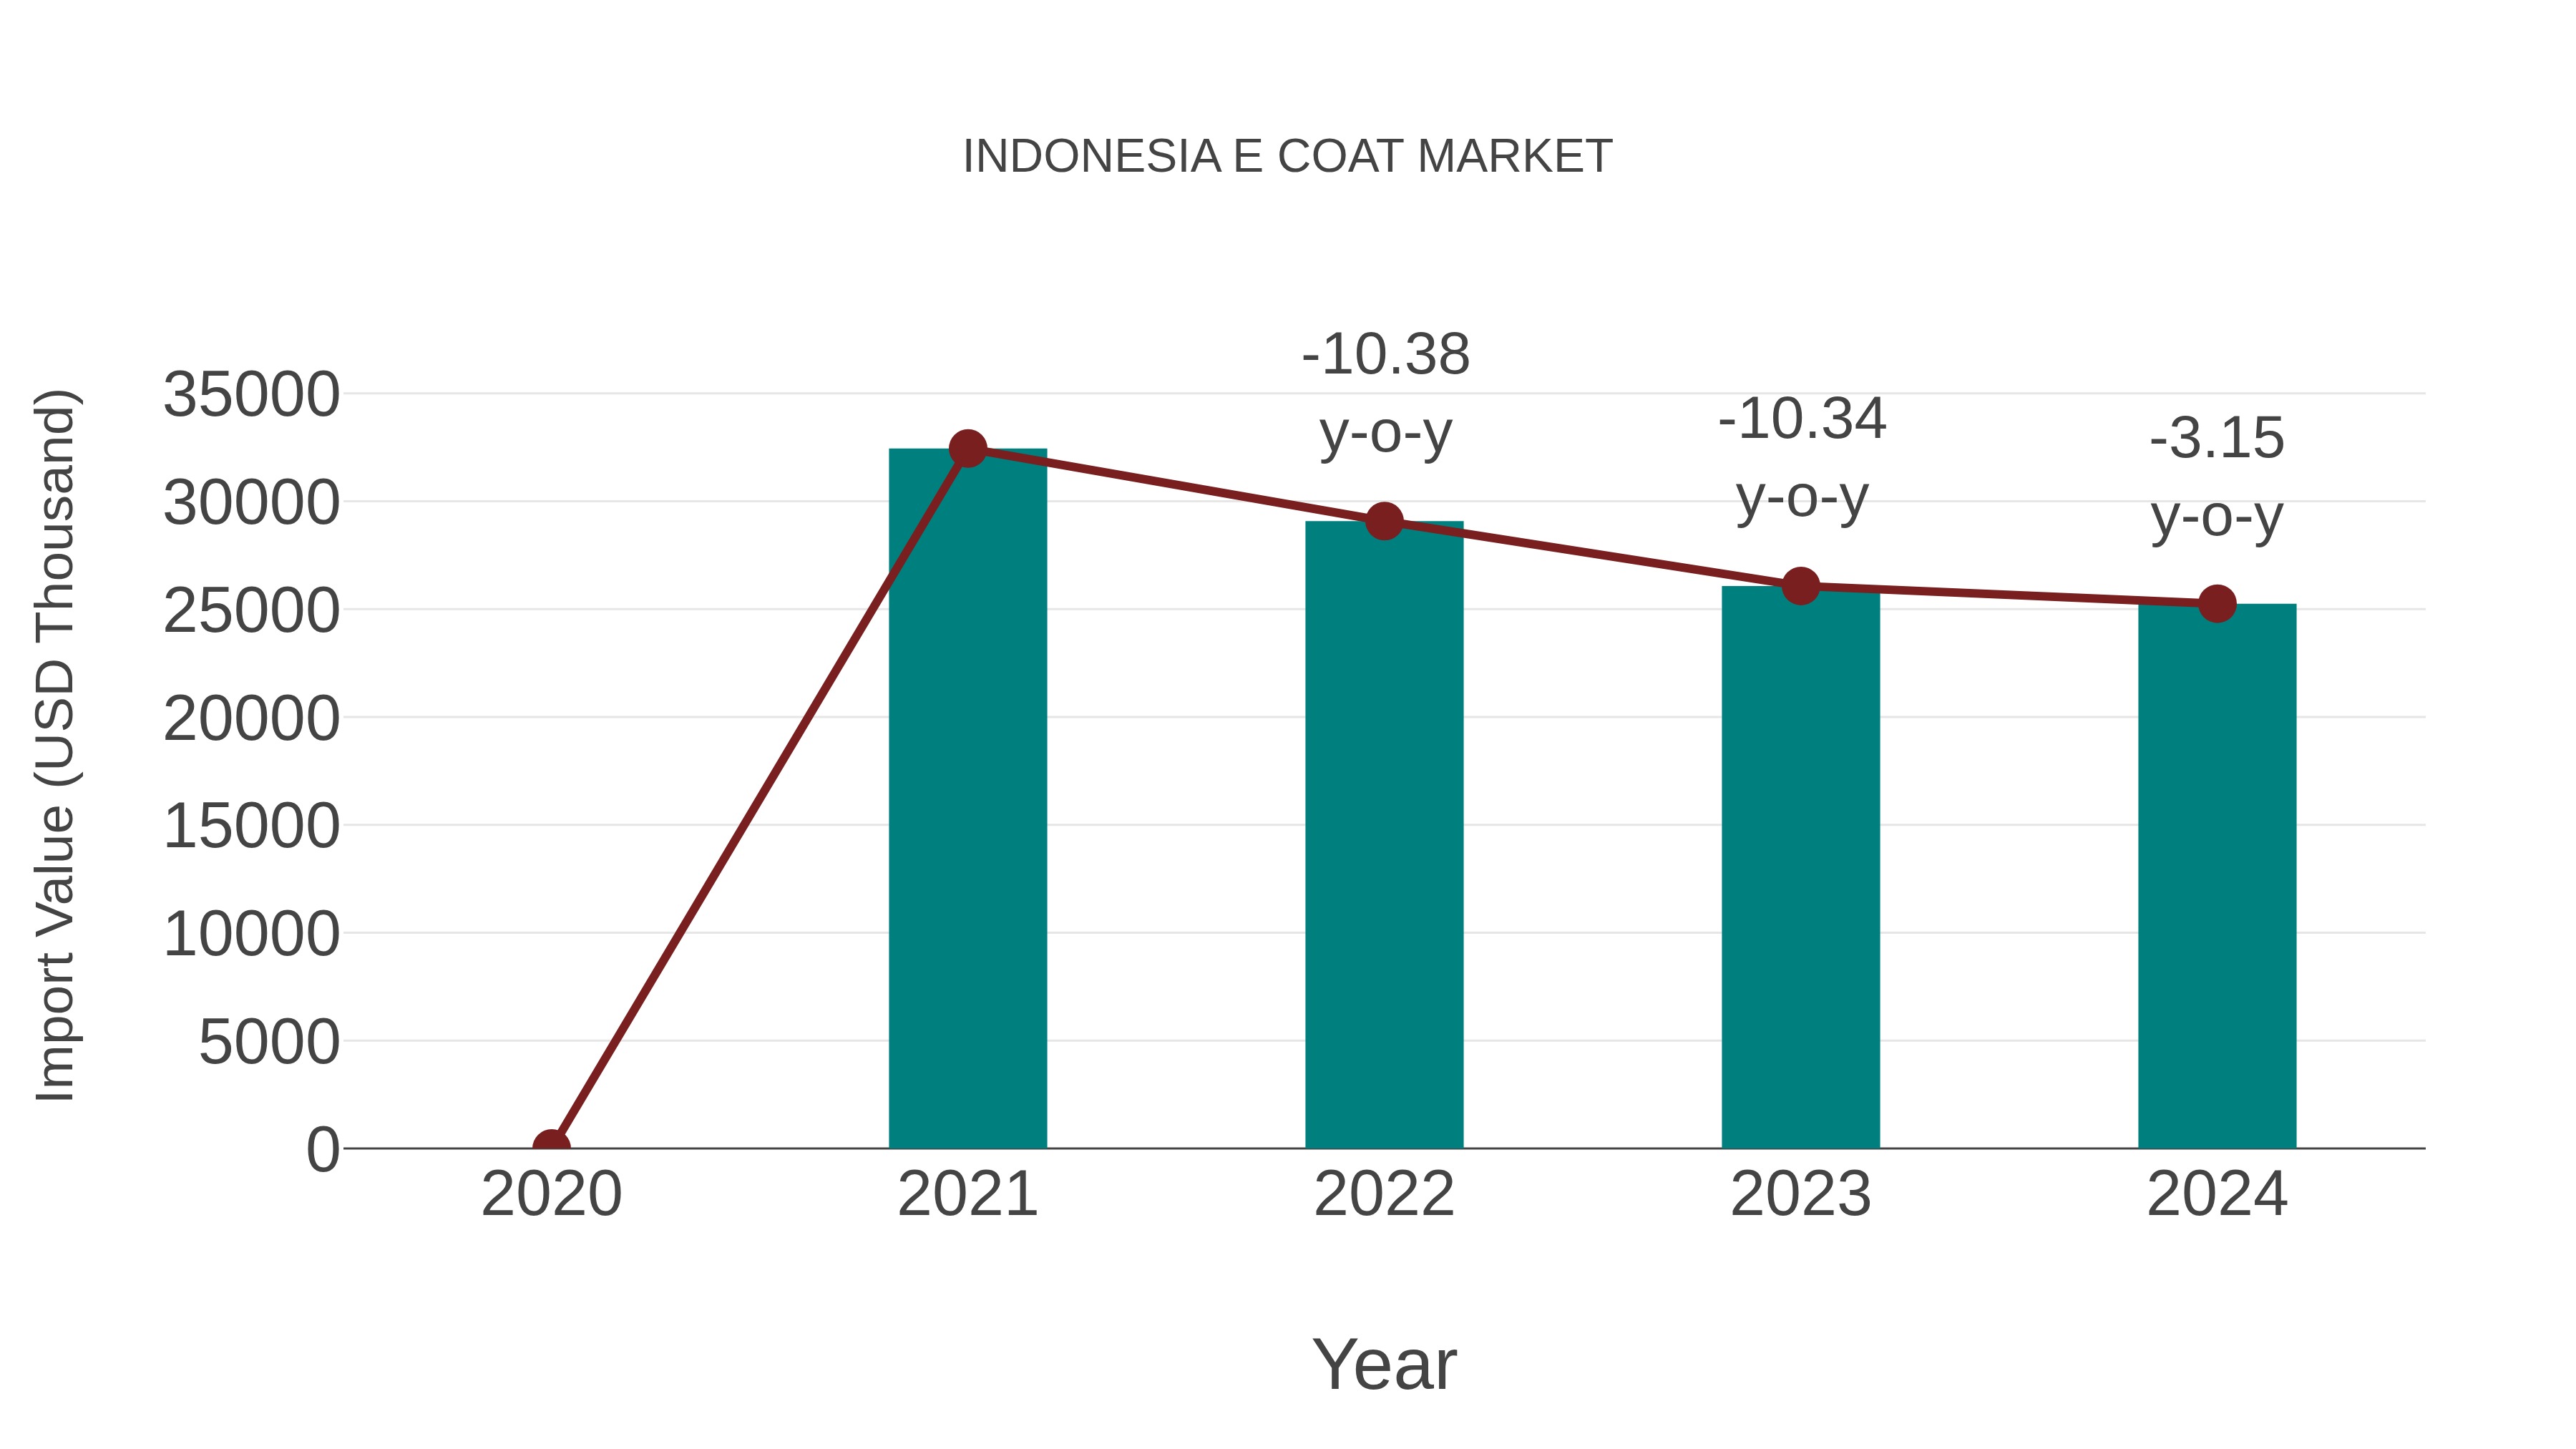
Indonesia E Coat Market: Import Trend Analysis
Indonesia`s import trend for the e-coat market experienced a decline from 2023 to 2024, with a negative growth rate of -3.15%. The compound annual growth rate (CAGR) from 2020 to 2024 stood at -8.02%. This downward trajectory may be attributed to shifting demand patterns or changes in trade policies impacting market stability.
Indonesia E Coat Market Overview
The Indonesia e-coat market is experiencing steady growth due to increasing demand in various end-use industries such as automotive, electronics, and construction. E-coating, also known as electrodeposition coating, provides excellent corrosion resistance and uniform coating thickness, making it a preferred choice for protecting metal surfaces. The automotive sector particularly drives the market growth, with stringent regulations mandating the use of eco-friendly coatings. Additionally, the expanding electronics industry in Indonesia further boosts the demand for e-coat applications to protect sensitive electronic components. Key market players are focusing on expanding their product offerings and investing in research and development to cater to evolving customer needs. Overall, the Indonesia e-coat market is poised for continued growth in the coming years.
Indonesia E Coat Market Trends
The Indonesia e-coat market is experiencing significant growth driven by various factors such as increasing demand from the automotive and electronics industries, stringent environmental regulations, and the growing focus on sustainable coatings. The market is witnessing a shift towards water-based e-coat solutions due to their eco-friendly nature and lower volatile organic compound (VOC) emissions. Additionally, advancements in e-coat technology, such as improved corrosion resistance and enhanced durability, are attracting more players to invest in this market. The automotive sector remains a key end-user of e-coat coatings in Indonesia, with rising vehicle production and the need for high-quality protective coatings driving the market growth. Overall, the Indonesia e-coat market is poised for continued expansion in the coming years, driven by technological advancements and increasing awareness of environmental sustainability.
Indonesia E Coat Market Challenges
In the Indonesia e-coat market, several challenges are faced including increasing competition from local and international players, fluctuating raw material prices, stringent environmental regulations, and limited awareness among end-users about the benefits of e-coating. Additionally, the high initial investment required for setting up e-coating facilities and the need for skilled labor to operate the equipment pose significant challenges for companies operating in the market. Furthermore, the lack of standardized quality control measures and the presence of counterfeit products in the market also impact the growth and credibility of the e-coat industry in Indonesia. Overcoming these challenges will require strategic partnerships, continuous innovation, and effective marketing strategies to educate consumers about the advantages of e-coating technology.
Indonesia E Coat Market Investment Opportunities
The Indonesia e-coat market presents promising investment opportunities due to the growing automotive and electronics industries in the country. E-coating, also known as electrocoating, is a method of applying a protective coating to metal surfaces, providing corrosion resistance and durability. With the increasing demand for high-quality finishes and protection against environmental factors, the e-coat market is expected to expand significantly in Indonesia. Investing in e-coating facilities or technology in Indonesia could be lucrative, especially with the government`s focus on industrial development and infrastructure projects. Additionally, the rising adoption of e-coating in various sectors such as automotive, electronics, and appliances further enhances the market potential for investors looking to capitalize on the country`s growing industrial landscape.
Indonesia E Coat Market Government Policy
The Indonesian government has implemented various policies to regulate the e-coat market in the country. These include environmental regulations to ensure that e-coat manufacturers comply with sustainability standards and minimize their impact on the environment. The government also enforces quality control measures to maintain product standards and consumer safety. Additionally, there are import and export regulations in place to monitor the flow of e-coat materials and products in and out of the country. Overall, the government`s policies aim to promote a competitive and sustainable e-coat market in Indonesia while safeguarding the interests of consumers and the environment.
Indonesia E Coat Market Future Outlook
The Indonesia e-coat market is expected to witness steady growth in the coming years, driven by increasing demand from the automotive, electronics, and industrial sectors. The growing focus on eco-friendly and sustainable coatings, along with stringent environmental regulations, will propel the adoption of e-coat technology in the region. Additionally, the expanding construction and infrastructure industries in Indonesia will further boost the market for e-coat applications. Advancements in e-coat formulations, such as improved corrosion resistance and enhanced performance properties, will also contribute to the market expansion. Overall, the Indonesia e-coat market is poised for significant growth opportunities, supported by rising industrial activities and the shift towards environmentally friendly coating solutions.
Key Highlights of the Report:
- Indonesia E Coat Market Outlook
- Market Size of Indonesia E Coat Market,2025
- Forecast of Indonesia E Coat Market, 2032
- Historical Data and Forecast of Indonesia E Coat Revenues & Volume for the Period 2022-2032F
- Indonesia E Coat Market Trend Evolution
- Indonesia E Coat Market Drivers and Challenges
- Indonesia E Coat Price Trends
- Indonesia E Coat Porter's Five Forces
- Indonesia E Coat Industry Life Cycle
- Historical Data and Forecast of Indonesia E Coat Market Revenues & Volume By Type for the Period 2022-2032F
- Historical Data and Forecast of Indonesia E Coat Market Revenues & Volume By Cathodic Epoxy E-Coat for the Period 2022-2032F
- Historical Data and Forecast of Indonesia E Coat Market Revenues & Volume By Cathodic Acrylic E-Coat for the Period 2022-2032F
- Historical Data and Forecast of Indonesia E Coat Market Revenues & Volume By Anodic E-Coat for the Period 2022-2032F
- Historical Data and Forecast of Indonesia E Coat Market Revenues & Volume By Application for the Period 2022-2032F
- Historical Data and Forecast of Indonesia E Coat Market Revenues & Volume By Automotive for the Period 2022-2032F
- Historical Data and Forecast of Indonesia E Coat Market Revenues & Volume By Industrial Equipment for the Period 2022-2032F
- Historical Data and Forecast of Indonesia E Coat Market Revenues & Volume By Consumer Goods for the Period 2022-2032F
- Historical Data and Forecast of Indonesia E Coat Market Revenues & Volume By Technology for the Period 2022-2032F
- Historical Data and Forecast of Indonesia E Coat Market Revenues & Volume By UV-Cured E-Coat for the Period 2022-2032F
- Historical Data and Forecast of Indonesia E Coat Market Revenues & Volume By Thermal Cured E-Coat for the Period 2022-2032F
- Historical Data and Forecast of Indonesia E Coat Market Revenues & Volume By End-Use for the Period 2022-2032F
- Historical Data and Forecast of Indonesia E Coat Market Revenues & Volume By Automotive & Transportation for the Period 2022-2032F
- Historical Data and Forecast of Indonesia E Coat Market Revenues & Volume By Construction for the Period 2022-2032F
- Historical Data and Forecast of Indonesia E Coat Market Revenues & Volume By Appliances for the Period 2022-2032F
- Indonesia E Coat Import Export Trade Statistics
- Market Opportunity Assessment By Type
- Market Opportunity Assessment By Application
- Market Opportunity Assessment By Technology
- Market Opportunity Assessment By End-Use
- Indonesia E Coat Top Companies Market Share
- Indonesia E Coat Competitive Benchmarking By Technical and Operational Parameters
- Indonesia E Coat Company Profiles
- Indonesia E Coat Key Strategic Recommendations
Indonesia E Coat Market (2026-2032): FAQs
6Wresearch actively monitors the Indonesia E Coat Market and publishes its comprehensive annual report, highlighting emerging trends, growth drivers, revenue analysis, and forecast outlook. Our insights help businesses to make data-backed strategic decisions with ongoing market dynamics. Our analysts track relevent industries related to the Indonesia E Coat Market, allowing our clients with actionable intelligence and reliable forecasts tailored to emerging regional needs.
Yes, we provide customisation as per your requirements. To learn more, feel free to contact us on sales@6wresearch.com
1 Executive Summary |
2 Introduction |
2.1 Key Highlights of the Report |
2.2 Report Description |
2.3 Market Scope & Segmentation |
2.4 Research Methodology |
2.5 Assumptions |
3 Indonesia E Coat Market Overview |
3.1 Indonesia Country Macro Economic Indicators |
3.2 Indonesia E Coat Market Revenues & Volume, 2022 & 2032F |
3.3 Indonesia E Coat Market - Industry Life Cycle |
3.4 Indonesia E Coat Market - Porter's Five Forces |
3.5 Indonesia E Coat Market Revenues & Volume Share, By Type, 2022 & 2032F |
3.6 Indonesia E Coat Market Revenues & Volume Share, By Application, 2022 & 2032F |
3.7 Indonesia E Coat Market Revenues & Volume Share, By Technology, 2022 & 2032F |
3.8 Indonesia E Coat Market Revenues & Volume Share, By End-Use, 2022 & 2032F |
4 Indonesia E Coat Market Dynamics |
4.1 Impact Analysis |
4.2 Market Drivers |
4.2.1 Growing demand for environmentally friendly and sustainable coating solutions in Indonesia |
4.2.2 Increasing investments in infrastructure development and industrial activities driving the need for high-performance coatings |
4.2.3 Technological advancements leading to the development of innovative e-coat products |
4.3 Market Restraints |
4.3.1 High initial setup costs associated with e-coating facilities may deter small and medium-sized enterprises from adopting e-coat solutions |
4.3.2 Limited awareness and understanding of the benefits of e-coating among potential end-users in Indonesia |
5 Indonesia E Coat Market Trends |
6 Indonesia E Coat Market, By Types |
6.1 Indonesia E Coat Market, By Type |
6.1.1 Overview and Analysis |
6.1.2 Indonesia E Coat Market Revenues & Volume, By Type, 2022-2032F |
6.1.3 Indonesia E Coat Market Revenues & Volume, By Cathodic Epoxy E-Coat, 2022-2032F |
6.1.4 Indonesia E Coat Market Revenues & Volume, By Cathodic Acrylic E-Coat, 2022-2032F |
6.1.5 Indonesia E Coat Market Revenues & Volume, By Anodic E-Coat, 2022-2032F |
6.2 Indonesia E Coat Market, By Application |
6.2.1 Overview and Analysis |
6.2.2 Indonesia E Coat Market Revenues & Volume, By Automotive, 2022-2032F |
6.2.3 Indonesia E Coat Market Revenues & Volume, By Industrial Equipment, 2022-2032F |
6.2.4 Indonesia E Coat Market Revenues & Volume, By Consumer Goods, 2022-2032F |
6.3 Indonesia E Coat Market, By Technology |
6.3.1 Overview and Analysis |
6.3.2 Indonesia E Coat Market Revenues & Volume, By UV-Cured E-Coat, 2022-2032F |
6.3.3 Indonesia E Coat Market Revenues & Volume, By Thermal Cured E-Coat, 2022-2032F |
6.4 Indonesia E Coat Market, By End-Use |
6.4.1 Overview and Analysis |
6.4.2 Indonesia E Coat Market Revenues & Volume, By Automotive & Transportation, 2022-2032F |
6.4.3 Indonesia E Coat Market Revenues & Volume, By Construction, 2022-2032F |
6.4.4 Indonesia E Coat Market Revenues & Volume, By Appliances, 2022-2032F |
7 Indonesia E Coat Market Import-Export Trade Statistics |
7.1 Indonesia E Coat Market Export to Major Countries |
7.2 Indonesia E Coat Market Imports from Major Countries |
8 Indonesia E Coat Market Key Performance Indicators |
8.1 Percentage increase in the adoption of e-coat solutions in key industries in Indonesia |
8.2 Number of new partnerships and collaborations between e-coat manufacturers and local businesses |
8.3 Percentage growth in research and development investments in e-coating technologies in Indonesia |
9 Indonesia E Coat Market - Opportunity Assessment |
9.1 Indonesia E Coat Market Opportunity Assessment, By Type, 2022 & 2032F |
9.2 Indonesia E Coat Market Opportunity Assessment, By Application, 2022 & 2032F |
9.3 Indonesia E Coat Market Opportunity Assessment, By Technology, 2022 & 2032F |
9.4 Indonesia E Coat Market Opportunity Assessment, By End-Use, 2022 & 2032F |
10 Indonesia E Coat Market - Competitive Landscape |
10.1 Indonesia E Coat Market Revenue Share, By Companies, 2025 |
10.2 Indonesia E Coat Market Competitive Benchmarking, By Operating and Technical Parameters |
11 Company Profiles |
12 Recommendations |
13 Disclaimer |
Export potential assessment - trade Analytics for 2030
Export potential enables firms to identify high-growth global markets with greater confidence by combining advanced trade intelligence with a structured quantitative methodology. The framework analyzes emerging demand trends and country-level import patterns while integrating macroeconomic and trade datasets such as GDP and population forecasts, bilateral import–export flows, tariff structures, elasticity differentials between developed and developing economies, geographic distance, and import demand projections. Using weighted trade values from 2020–2024 as the base period to project country-to-country export potential for 2030, these inputs are operationalized through calculated drivers such as gravity model parameters, tariff impact factors, and projected GDP per-capita growth. Through an analysis of hidden potentials, demand hotspots, and market conditions that are most favorable to success, this method enables firms to focus on target countries, maximize returns, and global expansion with data, backed by accuracy.
By factoring in the projected importer demand gap that is currently unmet and could be potential opportunity, it identifies the potential for the Exporter (Country) among 190 countries, against the general trade analysis, which identifies the biggest importer or exporter.
To discover high-growth global markets and optimize your business strategy:
Click Here
Pricing
- Single User License$ 1,995
- Department License$ 2,400
- Site License$ 3,120
- Global License$ 3,795

Search
Thought Leadership and Analyst Meet


Our Clients
Latest Reports
- Taiwan Food Delivery Platform Market (2026-2032) | Companies, Outlook, Analysis, Trends, Value, Revenue, Segmentation, Share, Forecast, Competitive Landscape, Growth, Size & Forecast
- United Kingdom (UK) Long-term Care Insurance Market (2026-2032) | Growth, Share, Consumer Insights, Drivers, Opportunities, Competition, Pricing Analysis, Segments, Restraints, Companies, Competitive, Value, Outlook, Size, Demand, Analysis, Challenges, Strategic Insights, Investment Trends, Revenue, Trends, Supply, Forecast
- United Kingdom (UK) Long Term Care Market (2026-2032) | Companies, Outlook, Analysis, Trends, Value, Revenue, Segmentation, Share, Forecast, Competitive Landscape, Growth, Size & Forecast
- Iraq Insulation and Waterproofing Market (2026-2032) | Outlook, Drivers, Growth, Size, Share, Industry, Revenue, Trends, Demand, Competitive, Strategic Insights, Opportunities, Segments, Companies, Challenges, Strategy, Consumer Insights, Analysis, Investment Trends, Value, Segmentation, Forecast, Restraints
- India Switchgear Market Outlook (2026-2032) | Size, Share, Trends, Growth, Revenue, Forecast, Analysis, Value, Outlook
- Pakistan Contraceptive Implants Market (2025-2031) | Demand, Growth, Size, Share, Industry, Pricing Analysis, Competitive, Strategic Insights, Strategy, Consumer Insights, Analysis, Investment Trends, Opportunities, Revenue, Segments, Value, Segmentation, Supply, Forecast, Restraints, Outlook, Competition, Drivers, Trends, Companies, Challenges
- Sri Lanka Packaging Market (2026-2032) | Outlook, Competition, Drivers, Trends, Demand, Pricing Analysis, Competitive, Strategic Insights, Companies, Challenges, Strategy, Consumer Insights, Analysis, Investment Trends, Opportunities, Growth, Size, Share, Industry, Revenue, Segments, Value, Segmentation, Supply, Forecast, Restraints
- India Kids Watches Market (2026-2032) | Strategy, Consumer Insights, Analysis, Investment Trends, Opportunities, Growth, Size, Share, Industry, Revenue, Segments, Value, Segmentation, Supply, Forecast, Restraints, Outlook, Competition, Drivers, Trends, Demand, Pricing Analysis, Competitive, Strategic Insights, Companies, Challenges
- Saudi Arabia Core Assurance Service Market (2025-2031) | Strategy, Consumer Insights, Analysis, Investment Trends, Opportunities, Growth, Size, Share, Industry, Revenue, Segments, Value, Segmentation, Supply, Forecast, Restraints, Outlook, Competition, Drivers, Trends, Demand, Pricing Analysis, Competitive, Strategic Insights, Companies, Challenges
- Romania Uninterruptible Power Supply (UPS) Market (2026-2032) | Industry, Analysis, Revenue, Size, Forecast, Outlook, Value, Trends, Share, Growth & Companies
Industry Events and Analyst Meet

India EV Show 2026

EV tech India Expo 2026

Auto Tech Asia 2026

Battery Tech India 2026

Smart Production Solutions Guangzhou 2026
Whitepaper
- Middle East & Africa Commercial Security Market Click here to view more.
- Middle East & Africa Fire Safety Systems & Equipment Market Click here to view more.
- GCC Drone Market Click here to view more.
- Middle East Lighting Fixture Market Click here to view more.
- GCC Physical & Perimeter Security Market Click here to view more.
6WResearch In News
- Doha a strategic location for EV manufacturing hub: IPA Qatar
- Demand for luxury TVs surging in the GCC, says Samsung
- Empowering Growth: The Thriving Journey of Bangladesh’s Cable Industry
- Demand for luxury TVs surging in the GCC, says Samsung
- Video call with a traditional healer? Once unthinkable, it’s now common in South Africa
- Intelligent Buildings To Smooth GCC’s Path To Net Zero