Indonesia Earthenware Market (2026-2032) Outlook | Analysis, Trends, Value, Companies, Growth, Forecast, Revenue, Share, Size & Industry
Market Forecast By Type (Delftware, Creamware, Terracotta, Ironstone Ware, Yellowware, Raku, Victorian Majolica, Others), By Application (Tableware, Flower Pots, Decorative Articles, Others) And Competitive Landscape
| Product Code: ETC252148 | Publication Date: Aug 2023 | Updated Date: Mar 2026 | Product Type: Market Research Report | |
| Publisher: 6Wresearch | Author: Ravi Bhandari | No. of Pages: 75 | No. of Figures: 35 | No. of Tables: 20 |
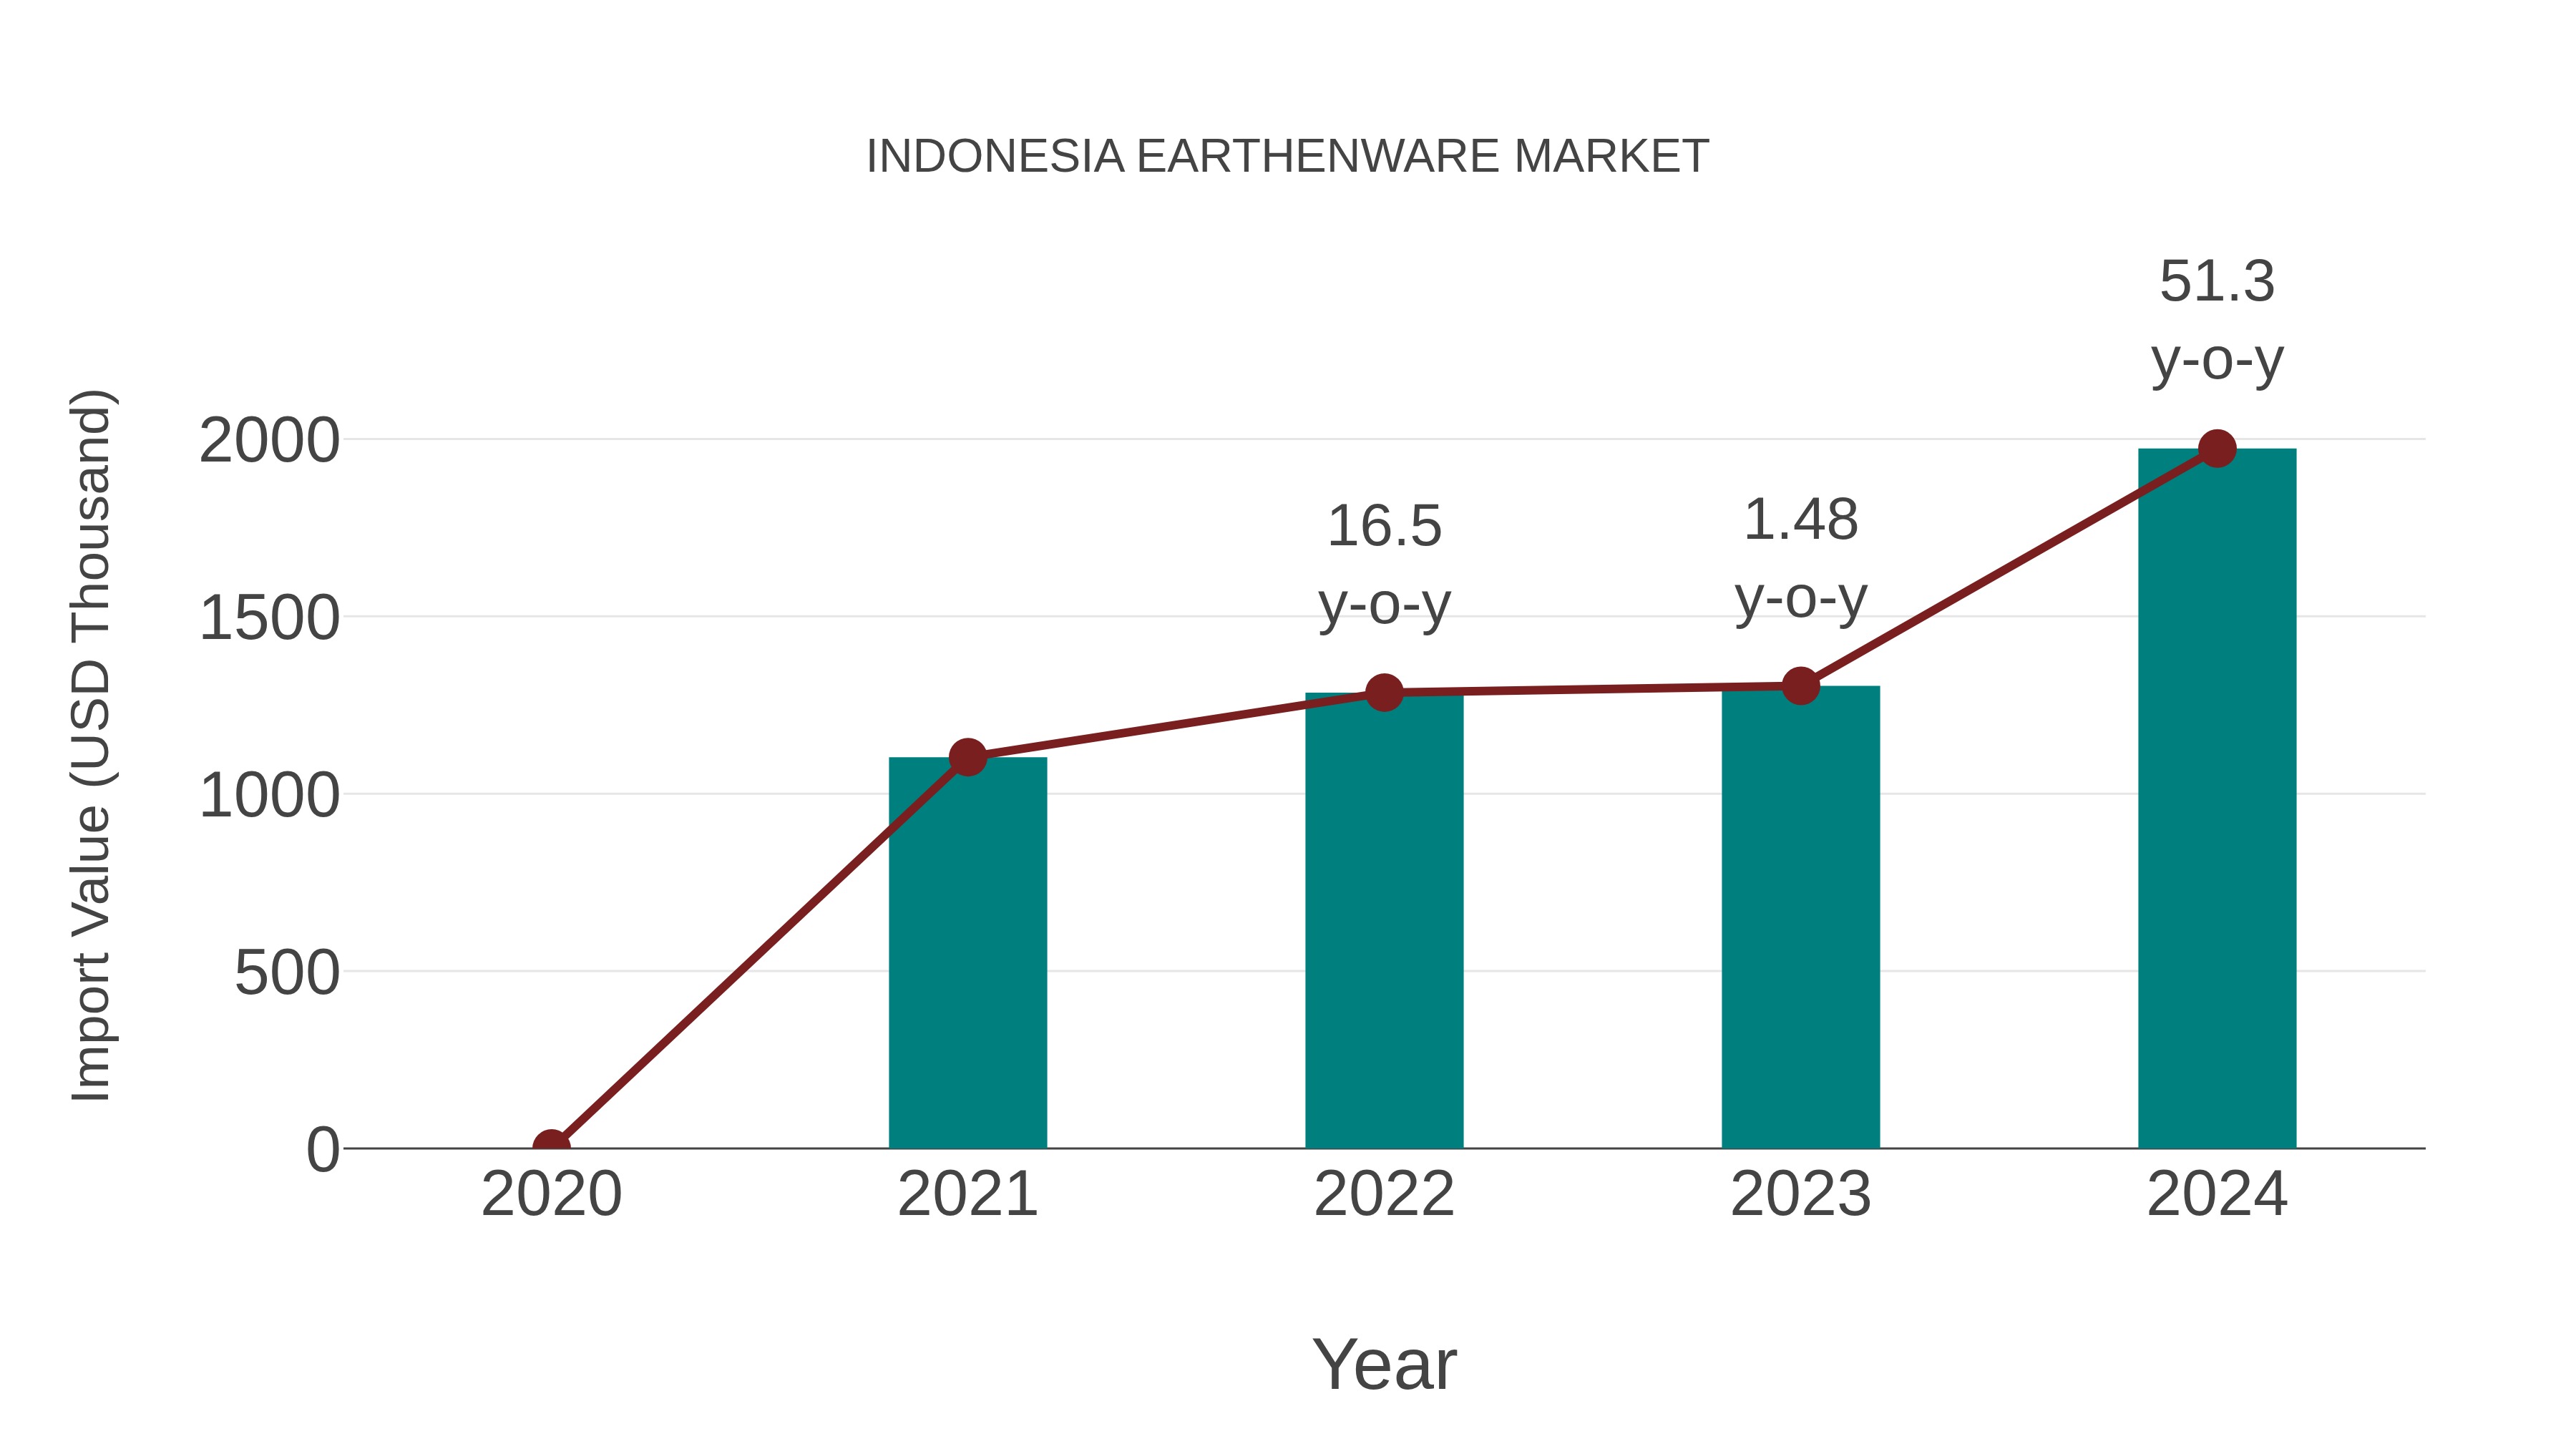
Indonesia Earthenware Market: Import Trend Analysis
Indonesia`s import trend for the earthenware market experienced significant growth from 2023 to 2024, with a growth rate of 51.3%. The compound annual growth rate (CAGR) for the period 2020-2024 stood at 21.39%. This surge in imports can be attributed to a notable shift in consumer demand towards Indonesian earthenware products, indicating a strong market recovery and increased international trade activity within the sector.
Indonesia Earthenware Market Synopsis
The Indonesia Earthenware Market is expected to witness steady growth as earthenware products gain popularity for their eco-friendly and traditional appeal. The market is driven by the increasing demand for unique and handcrafted household items, along with the growing interest in sustainable consumer products.
Drivers of the Market
The Indonesia earthenware market is anticipated to witness growth, driven by the traditional and cultural significance of earthenware products in the country. Earthenware items, such as pottery and clay utensils, have a strong demand in both rural and urban areas due to their aesthetic appeal and eco-friendly nature. Additionally, the rise of tourism and the popularity of traditional crafts among tourists are expected to boost the earthenware market.
Challenges of the Market
The earthenware market may face challenges due to competition from alternative materials like plastic and metal. Additionally, maintaining consistent quality in earthenware products and ensuring that they meet safety standards might be crucial to build consumer trust.
COVID-19 Impact on the Market
The earthenware market in Indonesia has been thriving, driven by the country`s rich cultural heritage and traditional pottery craftsmanship. The demand for artisanal earthenware products has been increasing among tourists and locals alike. The pandemic posed challenges to this market, particularly with the decline in tourism and art-related events. However, the rise of e-commerce platforms and online marketing initiatives helped sustain sales during the pandemic.
Key Highlights of the Report:
- Indonesia Earthenware Market Outlook
- Market Size of Indonesia Earthenware Market, 2025
- Forecast of Indonesia Earthenware Market, 2032
- Historical Data and Forecast of Indonesia Earthenware Revenues & Volume for the Period 2022-2032F
- Indonesia Earthenware Market Trend Evolution
- Indonesia Earthenware Market Drivers and Challenges
- Indonesia Earthenware Price Trends
- Indonesia Earthenware Porter's Five Forces
- Indonesia Earthenware Industry Life Cycle
- Historical Data and Forecast of Indonesia Earthenware Market Revenues & Volume By Type for the Period 2022-2032F
- Historical Data and Forecast of Indonesia Earthenware Market Revenues & Volume By Delftware for the Period 2022-2032F
- Historical Data and Forecast of Indonesia Earthenware Market Revenues & Volume By Creamware for the Period 2022-2032F
- Historical Data and Forecast of Indonesia Earthenware Market Revenues & Volume By Terracotta for the Period 2022-2032F
- Historical Data and Forecast of Indonesia Earthenware Market Revenues & Volume By Ironstone Ware for the Period 2022-2032F
- Historical Data and Forecast of Indonesia Earthenware Market Revenues & Volume By Yellowware for the Period 2022-2032F
- Historical Data and Forecast of Indonesia Earthenware Market Revenues & Volume By Raku for the Period 2022-2032F
- Historical Data and Forecast of Indonesia Earthenware Market Revenues & Volume By Victorian Majolica for the Period 2022-2032F
- Historical Data and Forecast of Indonesia Delftware Earthenware Market Revenues & Volume By Others for the Period 2022-2032F
- Historical Data and Forecast of Indonesia Earthenware Market Revenues & Volume By Application for the Period 2022-2032F
- Historical Data and Forecast of Indonesia Earthenware Market Revenues & Volume By Tableware for the Period 2022-2032F
- Historical Data and Forecast of Indonesia Earthenware Market Revenues & Volume By Flower Pots for the Period 2022-2032F
- Historical Data and Forecast of Indonesia Earthenware Market Revenues & Volume By Decorative Articles for the Period 2022-2032F
- Historical Data and Forecast of Indonesia Earthenware Market Revenues & Volume By Others for the Period 2022-2032F
- Indonesia Earthenware Import Export Trade Statistics
- Market Opportunity Assessment By Type
- Market Opportunity Assessment By Application
- Indonesia Earthenware Top Companies Market Share
- Indonesia Earthenware Competitive Benchmarking By Technical and Operational Parameters
- Indonesia Earthenware Company Profiles
- Indonesia Earthenware Key Strategic Recommendations
Indonesia Earthenware Market (2026-2032): FAQs
6Wresearch actively monitors the Indonesia Earthenware Market and publishes its comprehensive annual report, highlighting emerging trends, growth drivers, revenue analysis, and forecast outlook. Our insights help businesses to make data-backed strategic decisions with ongoing market dynamics. Our analysts track relevent industries related to the Indonesia Earthenware Market, allowing our clients with actionable intelligence and reliable forecasts tailored to emerging regional needs.
Yes, we provide customisation as per your requirements. To learn more, feel free to contact us on sales@6wresearch.com
1 Executive Summary |
2 Introduction |
2.1 Key Highlights of the Report |
2.2 Report Description |
2.3 Market Scope & Segmentation |
2.4 Research Methodology |
2.5 Assumptions |
3 Indonesia Earthenware Market Overview |
3.1 Indonesia Country Macro Economic Indicators |
3.2 Indonesia Earthenware Market Revenues & Volume, 2022 & 2032F |
3.3 Indonesia Earthenware Market - Industry Life Cycle |
3.4 Indonesia Earthenware Market - Porter's Five Forces |
3.5 Indonesia Earthenware Market Revenues & Volume Share, By Type, 2022 & 2032F |
3.6 Indonesia Earthenware Market Revenues & Volume Share, By Application, 2022 & 2032F |
4 Indonesia Earthenware Market Dynamics |
4.1 Impact Analysis |
4.2 Market Drivers |
4.2.1 Cultural significance of earthenware in Indonesia |
4.2.2 Growing interest in traditional crafts and handmade products |
4.2.3 Increasing tourism promoting local artisanal products |
4.3 Market Restraints |
4.3.1 Competition from cheaper imported ceramic products |
4.3.2 Limited access to modern production technology |
4.3.3 Fluctuating raw material prices affecting production costs |
5 Indonesia Earthenware Market Trends |
6 Indonesia Earthenware Market, By Types |
6.1 Indonesia Earthenware Market, By Type |
6.1.1 Overview and Analysis |
6.1.2 Indonesia Earthenware Market Revenues & Volume, By Type, 2022-2032F |
6.1.3 Indonesia Earthenware Market Revenues & Volume, By Delftware, 2022-2032F |
6.1.4 Indonesia Earthenware Market Revenues & Volume, By Creamware, 2022-2032F |
6.1.5 Indonesia Earthenware Market Revenues & Volume, By Terracotta, 2022-2032F |
6.1.6 Indonesia Earthenware Market Revenues & Volume, By Ironstone Ware, 2022-2032F |
6.1.7 Indonesia Earthenware Market Revenues & Volume, By Yellowware, 2022-2032F |
6.1.8 Indonesia Earthenware Market Revenues & Volume, By Raku, 2022-2032F |
6.1.9 Indonesia Earthenware Market Revenues & Volume, By Others, 2022-2032F |
6.1.10 Indonesia Earthenware Market Revenues & Volume, By Others, 2022-2032F |
6.2 Indonesia Earthenware Market, By Application |
6.2.1 Overview and Analysis |
6.2.2 Indonesia Earthenware Market Revenues & Volume, By Tableware, 2022-2032F |
6.2.3 Indonesia Earthenware Market Revenues & Volume, By Flower Pots, 2022-2032F |
6.2.4 Indonesia Earthenware Market Revenues & Volume, By Decorative Articles, 2022-2032F |
6.2.5 Indonesia Earthenware Market Revenues & Volume, By Others, 2022-2032F |
7 Indonesia Earthenware Market Import-Export Trade Statistics |
7.1 Indonesia Earthenware Market Export to Major Countries |
7.2 Indonesia Earthenware Market Imports from Major Countries |
8 Indonesia Earthenware Market Key Performance Indicators |
8.1 Percentage of revenue from new product innovations |
8.2 Number of collaborations with local artists and designers |
8.3 Percentage of revenue from exports to international markets |
9 Indonesia Earthenware Market - Opportunity Assessment |
9.1 Indonesia Earthenware Market Opportunity Assessment, By Type, 2022 & 2032F |
9.2 Indonesia Earthenware Market Opportunity Assessment, By Application, 2022 & 2032F |
10 Indonesia Earthenware Market - Competitive Landscape |
10.1 Indonesia Earthenware Market Revenue Share, By Companies, 2025 |
10.2 Indonesia Earthenware Market Competitive Benchmarking, By Operating and Technical Parameters |
11 Company Profiles |
12 Recommendations |
13 Disclaimer |
Global Go To Market Strategy - 2030
Export potential enables firms to identify high-growth global markets with greater confidence by combining advanced trade intelligence with a structured quantitative methodology. The framework analyzes emerging demand trends and country-level import patterns while integrating macroeconomic and trade datasets such as GDP and population forecasts, bilateral import–export flows, tariff structures, elasticity differentials between developed and developing economies, geographic distance, and import demand projections. Using weighted trade values from 2020–2024 as the base period to project country-to-country export potential for 2030, these inputs are operationalized through calculated drivers such as gravity model parameters, tariff impact factors, and projected GDP per-capita growth. Through an analysis of hidden potentials, demand hotspots, and market conditions that are most favorable to success, this method enables firms to focus on target countries, maximize returns, and global expansion with data, backed by accuracy.
By factoring in the projected importer demand gap that is currently unmet and could be potential opportunity, it identifies the potential for the Exporter (Country) among 190 countries, against the general trade analysis, which identifies the biggest importer or exporter.
To discover high-growth global markets and optimize your business strategy:
Click Here
Pricing
- Single User License$ 1,995
- Department License$ 2,400
- Site License$ 3,120
- Global License$ 3,795

Leadership Perspectives from Industry Events
Search
Thought Leadership and Analyst Meet


Our Clients
6WResearch In News
- Doha a strategic location for EV manufacturing hub: IPA Qatar
- Demand for luxury TVs surging in the GCC, says Samsung
- Empowering Growth: The Thriving Journey of Bangladesh’s Cable Industry
- Demand for luxury TVs surging in the GCC, says Samsung
- Video call with a traditional healer? Once unthinkable, it’s now common in South Africa
- Intelligent Buildings To Smooth GCC’s Path To Net Zero
Latest Reports
- Cape Verde Portable Hand-Thrown Extinguisher Market (2026-2032)
- Canada Portable Hand-Thrown Extinguisher Market (2026-2032)
- Cameroon Portable Hand-Thrown Extinguisher Market (2026-2032)
- Burundi Portable Hand-Thrown Extinguisher Market (2026-2032)
- Burkina Faso Portable Hand-Thrown Extinguisher Market (2026-2032)
- Bulgaria Portable Hand-Thrown Extinguisher Market (2026-2032)
- Brunei Portable Hand-Thrown Extinguisher Market (2026-2032)
- Botswana Portable Hand-Thrown Extinguisher Market (2026-2032)
- Bosnia and Herzegovina Portable Hand-Thrown Extinguisher Market (2026-2032)
- Bolivia Portable Hand-Thrown Extinguisher Market (2026-2032)
Industry Events and Analyst Meet

HIMTEX 2026

India Refining Summit 2026

India EV Show 2026

EV tech India Expo 2026

Auto Tech Asia 2026
Whitepaper
- Middle East & Africa Commercial Security Market Click here to view more.
- Middle East & Africa Fire Safety Systems & Equipment Market Click here to view more.
- GCC Drone Market Click here to view more.
- Middle East Lighting Fixture Market Click here to view more.
- GCC Physical & Perimeter Security Market Click here to view more.