Indonesia Epoxy Composite Market (2026-2032) Outlook | Value, Forecast, Growth, Analysis, Share, Revenue, Companies, Size, Trends & Industry
Market Forecast By Fiber Type (Glass, Carbon), By Manufacturing Process (Lay-up, Compression Molding, Resin Injection, Resin Transfer Molding, Filament Winding, Pultrusion) And Competitive Landscape
| Product Code: ETC4501049 | Publication Date: Jul 2023 | Updated Date: Mar 2026 | Product Type: Report | |
| Publisher: 6Wresearch | Author: Ravi Bhandari | No. of Pages: 85 | No. of Figures: 45 | No. of Tables: 25 |
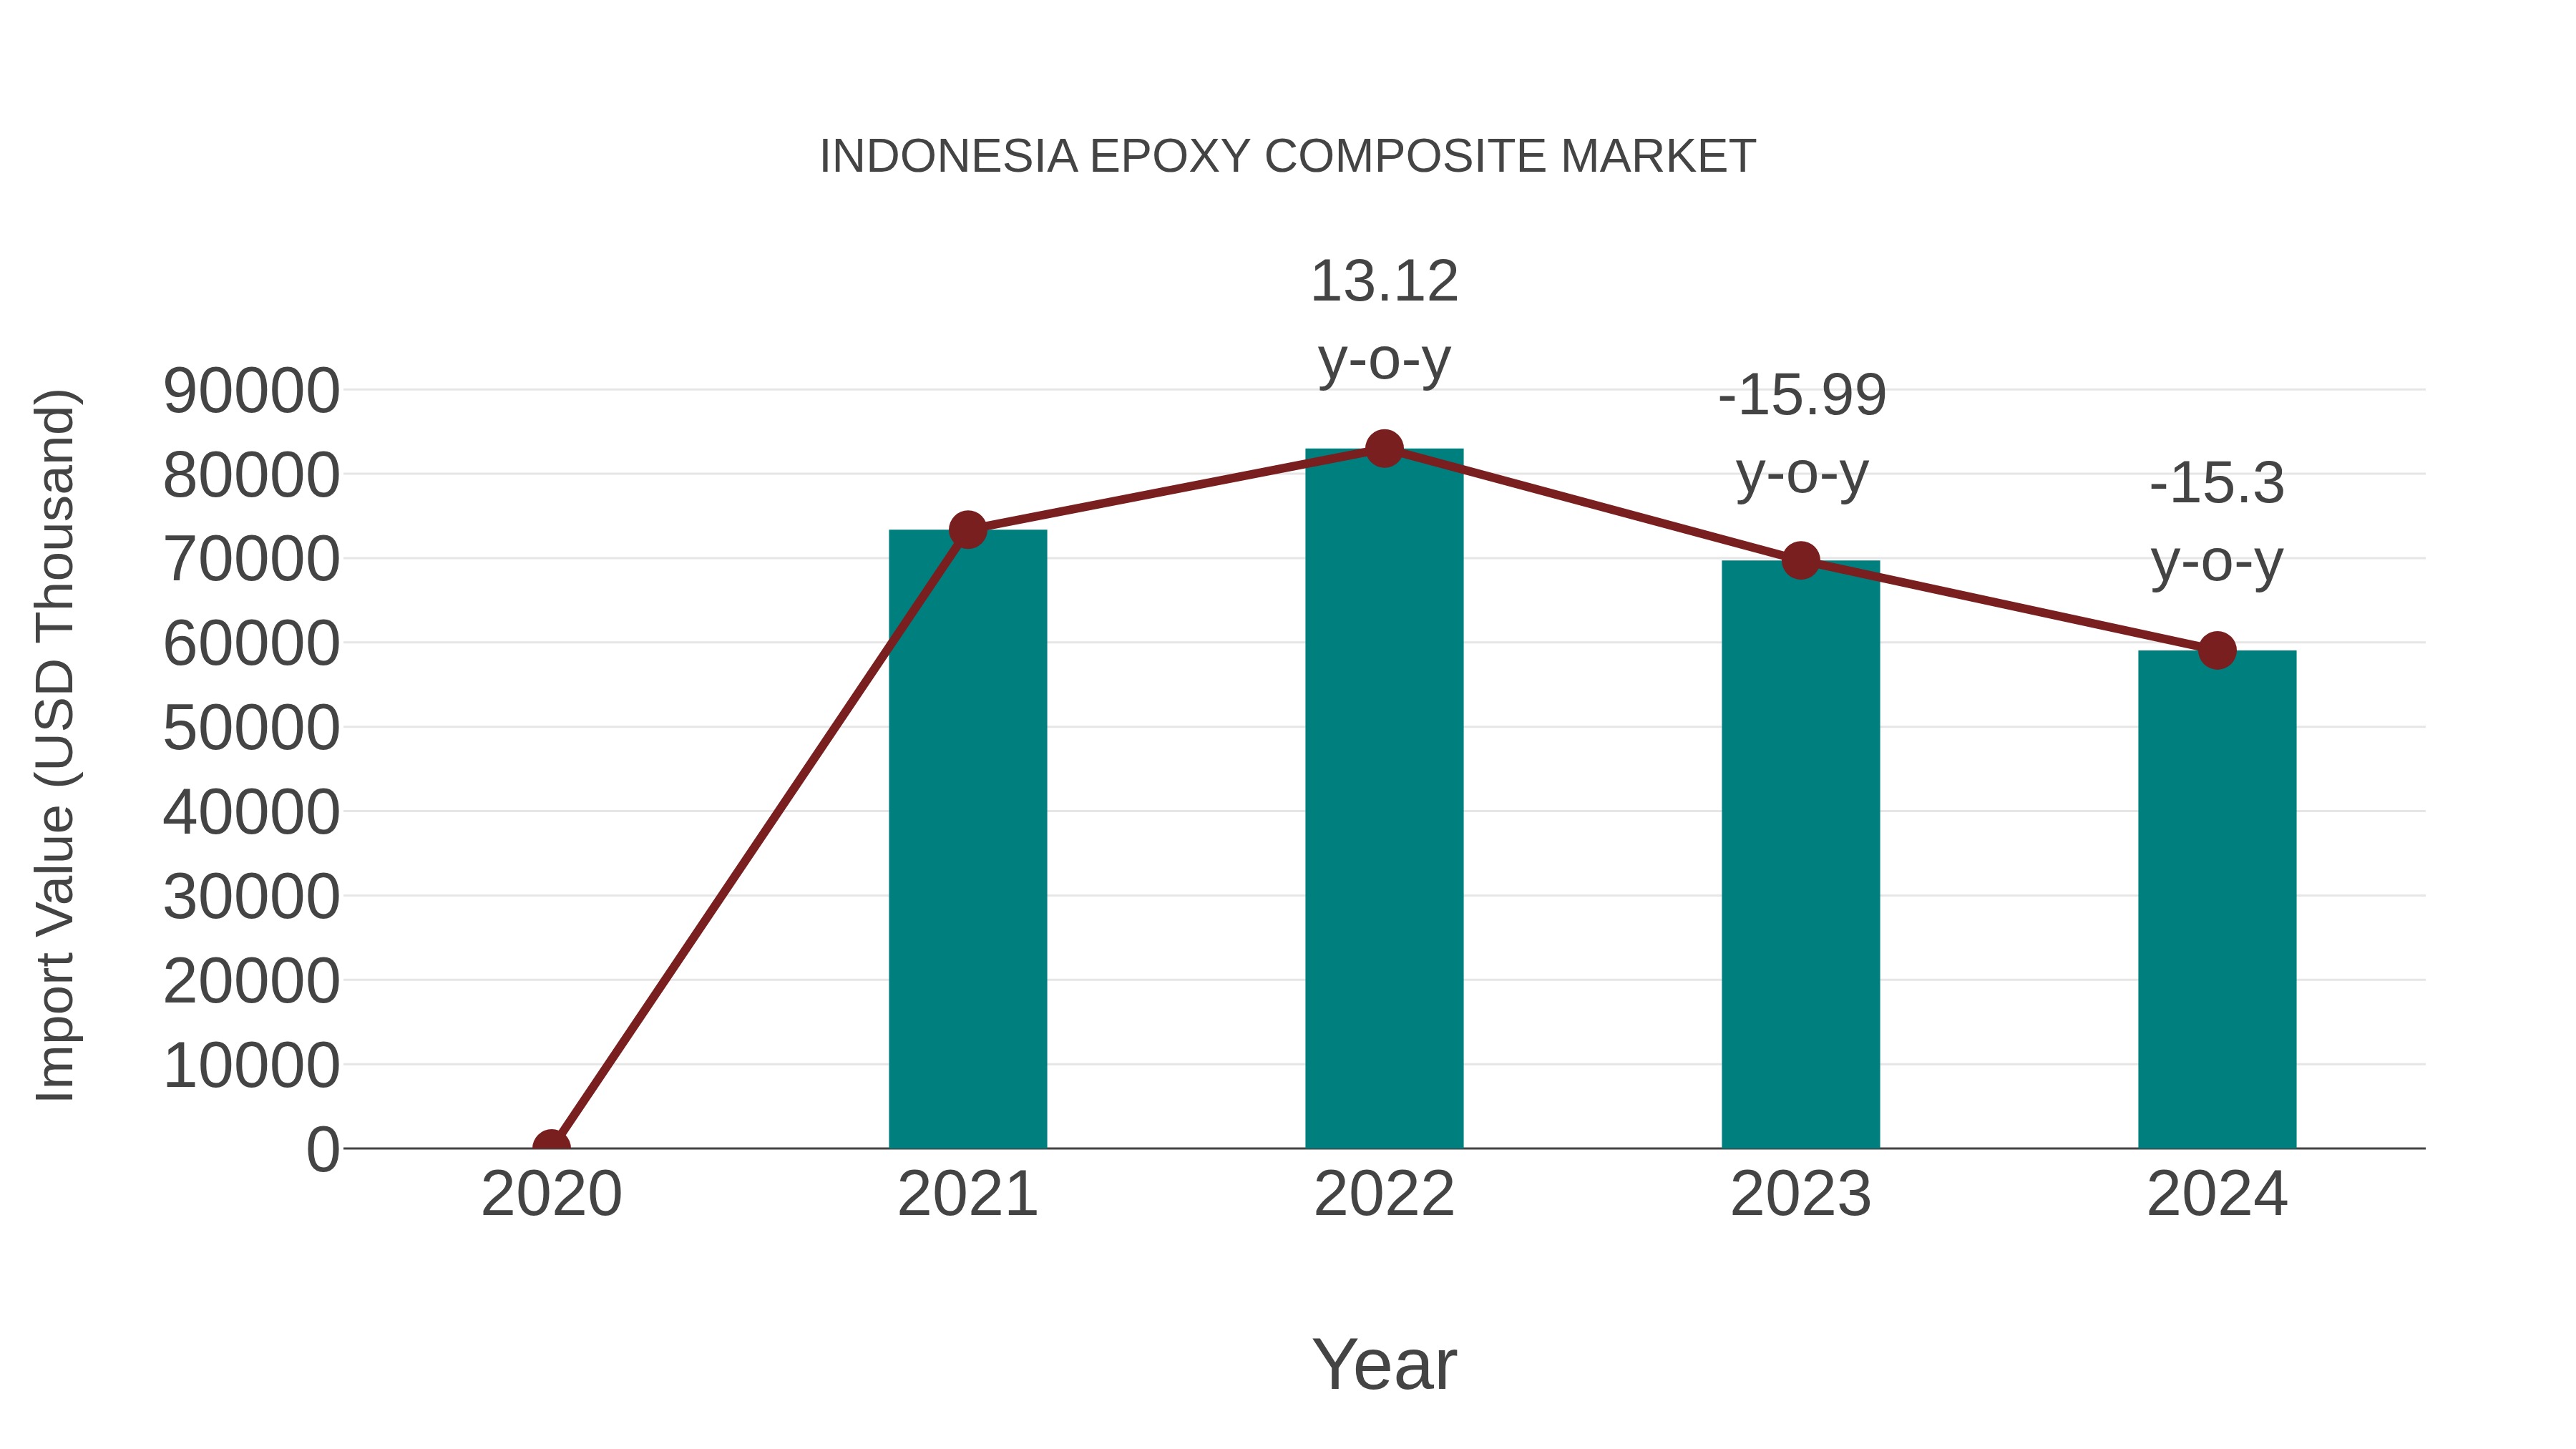
Indonesia Epoxy Composite Market: Import Trend Analysis
In the Indonesia epoxy composite market, the import trend from 2023 to 2024 experienced a decline of -15.3%. The compound annual growth rate (CAGR) for imports during the period from 2020 to 2024 stood at -6.98%. This negative growth can be attributed to shifts in demand dynamics or changes in trade policies impacting market stability.
Indonesia Epoxy Composite Market Overview
Epoxy composites offer a versatile range of applications, particularly in the construction and manufacturing sectors. Their strong adhesive properties, durability, and resistance to moisture are attractive qualities for various industries in Indonesia.
Drivers of the Market
The epoxy composite market in Indonesia is experiencing growth due to the expanding construction and automotive sectors. The strong adhesive properties and durability of epoxy composites are driving their demand in various applications. Moreover, the increasing awareness of environmental sustainability is encouraging the use of epoxy composites as they are often recyclable and contribute to resource conservation.
Challenges of the Market
The epoxy composite market in Indonesia faces challenges related to the availability of raw materials and the environmental impact of epoxy resin production. Environmental regulations and sustainability concerns are becoming increasingly important, which may require the industry to adapt to more eco-friendly alternatives.
COVID-19 Impacts on the Market
The Indonesia epoxy composite market faced challenges during the COVID-19 pandemic, with disruptions in manufacturing and construction activities. However, as the demand for durable and adhesive materials grows, the epoxy composite market may regain momentum, particularly in the construction and automotive sectors.
Key Players of the Makret
Key players in the epoxy composite market in Indonesia include PT Dumasari Kemasindo, PT Sarana Baja Persada, and PT Mitra Anugrah Abadi. They provide epoxy composite materials for applications in manufacturing, construction, and infrastructure projects.
Key Highlights of the Report:
- Indonesia Epoxy Composite Market Outlook
- Market Size of Indonesia Epoxy Composite Market, 2025
- Forecast of Indonesia Epoxy Composite Market, 2032
- Historical Data and Forecast of Indonesia Epoxy Composite Revenues & Volume for the Period 2022-2032F
- Indonesia Epoxy Composite Market Trend Evolution
- Indonesia Epoxy Composite Market Drivers and Challenges
- Indonesia Epoxy Composite Price Trends
- Indonesia Epoxy Composite Porter's Five Forces
- Indonesia Epoxy Composite Industry Life Cycle
- Historical Data and Forecast of Indonesia Epoxy Composite Market Revenues & Volume By Fiber Type for the Period 2022-2032F
- Historical Data and Forecast of Indonesia Epoxy Composite Market Revenues & Volume By Glass for the Period 2022-2032F
- Historical Data and Forecast of Indonesia Epoxy Composite Market Revenues & Volume By Carbon for the Period 2022-2032F
- Historical Data and Forecast of Indonesia Epoxy Composite Market Revenues & Volume By Manufacturing Process for the Period 2022-2032F
- Historical Data and Forecast of Indonesia Epoxy Composite Market Revenues & Volume By Lay-up for the Period 2022-2032F
- Historical Data and Forecast of Indonesia Epoxy Composite Market Revenues & Volume By Compression Molding for the Period 2022-2032F
- Historical Data and Forecast of Indonesia Epoxy Composite Market Revenues & Volume By Resin Injection for the Period 2022-2032F
- Historical Data and Forecast of Indonesia Epoxy Composite Market Revenues & Volume By Resin Transfer Molding for the Period 2022-2032F
- Historical Data and Forecast of Indonesia Epoxy Composite Market Revenues & Volume By Filament Winding for the Period 2022-2032F
- Historical Data and Forecast of Indonesia Epoxy Composite Market Revenues & Volume By Pultrusion for the Period 2022-2032F
- Indonesia Epoxy Composite Import Export Trade Statistics
- Market Opportunity Assessment By Fiber Type
- Market Opportunity Assessment By Manufacturing Process
- Indonesia Epoxy Composite Top Companies Market Share
- Indonesia Epoxy Composite Competitive Benchmarking By Technical and Operational Parameters
- Indonesia Epoxy Composite Company Profiles
- Indonesia Epoxy Composite Key Strategic Recommendations
Indonesia Epoxy Composite Market (2026-2032): FAQs
6Wresearch actively monitors the Indonesia Epoxy Composite Market and publishes its comprehensive annual report, highlighting emerging trends, growth drivers, revenue analysis, and forecast outlook. Our insights help businesses to make data-backed strategic decisions with ongoing market dynamics. Our analysts track relevent industries related to the Indonesia Epoxy Composite Market, allowing our clients with actionable intelligence and reliable forecasts tailored to emerging regional needs.
Yes, we provide customisation as per your requirements. To learn more, feel free to contact us on sales@6wresearch.com
1 Executive Summary |
2 Introduction |
2.1 Key Highlights of the Report |
2.2 Report Description |
2.3 Market Scope & Segmentation |
2.4 Research Methodology |
2.5 Assumptions |
3 Indonesia Epoxy Composite Market Overview |
3.1 Indonesia Country Macro Economic Indicators |
3.2 Indonesia Epoxy Composite Market Revenues & Volume, 2022 & 2032F |
3.3 Indonesia Epoxy Composite Market - Industry Life Cycle |
3.4 Indonesia Epoxy Composite Market - Porter's Five Forces |
3.5 Indonesia Epoxy Composite Market Revenues & Volume Share, By Fiber Type, 2022 & 2032F |
3.6 Indonesia Epoxy Composite Market Revenues & Volume Share, By Manufacturing Process, 2022 & 2032F |
4 Indonesia Epoxy Composite Market Dynamics |
4.1 Impact Analysis |
4.2 Market Drivers |
4.2.1 Increasing demand for lightweight and high-strength materials in various industries such as automotive, construction, and aerospace. |
4.2.2 Growing focus on infrastructure development and maintenance projects in Indonesia. |
4.2.3 Rising awareness about the benefits of epoxy composites over traditional materials like steel and concrete. |
4.3 Market Restraints |
4.3.1 High initial investment required for setting up epoxy composite manufacturing facilities. |
4.3.2 Limited availability of raw materials and skilled labor in the region. |
4.3.3 Price volatility in raw material costs impacting the overall production cost of epoxy composites. |
5 Indonesia Epoxy Composite Market Trends |
6 Indonesia Epoxy Composite Market, By Types |
6.1 Indonesia Epoxy Composite Market, By Fiber Type |
6.1.1 Overview and Analysis |
6.1.2 Indonesia Epoxy Composite Market Revenues & Volume, By Fiber Type, 2022-2032F |
6.1.3 Indonesia Epoxy Composite Market Revenues & Volume, By Glass, 2022-2032F |
6.1.4 Indonesia Epoxy Composite Market Revenues & Volume, By Carbon, 2022-2032F |
6.2 Indonesia Epoxy Composite Market, By Manufacturing Process |
6.2.1 Overview and Analysis |
6.2.2 Indonesia Epoxy Composite Market Revenues & Volume, By Lay-up, 2022-2032F |
6.2.3 Indonesia Epoxy Composite Market Revenues & Volume, By Compression Molding, 2022-2032F |
6.2.4 Indonesia Epoxy Composite Market Revenues & Volume, By Resin Injection, 2022-2032F |
6.2.5 Indonesia Epoxy Composite Market Revenues & Volume, By Resin Transfer Molding, 2022-2032F |
6.2.6 Indonesia Epoxy Composite Market Revenues & Volume, By Filament Winding, 2022-2032F |
6.2.7 Indonesia Epoxy Composite Market Revenues & Volume, By Pultrusion, 2022-2032F |
7 Indonesia Epoxy Composite Market Import-Export Trade Statistics |
7.1 Indonesia Epoxy Composite Market Export to Major Countries |
7.2 Indonesia Epoxy Composite Market Imports from Major Countries |
8 Indonesia Epoxy Composite Market Key Performance Indicators |
8.1 Research and development investment in innovative epoxy composite technologies. |
8.2 Number of infrastructure projects utilizing epoxy composites. |
8.3 Adoption rate of epoxy composites in key industries such as automotive, construction, and aerospace. |
9 Indonesia Epoxy Composite Market - Opportunity Assessment |
9.1 Indonesia Epoxy Composite Market Opportunity Assessment, By Fiber Type, 2022 & 2032F |
9.2 Indonesia Epoxy Composite Market Opportunity Assessment, By Manufacturing Process, 2022 & 2032F |
10 Indonesia Epoxy Composite Market - Competitive Landscape |
10.1 Indonesia Epoxy Composite Market Revenue Share, By Companies, 2025 |
10.2 Indonesia Epoxy Composite Market Competitive Benchmarking, By Operating and Technical Parameters |
11 Company Profiles |
12 Recommendations |
13 Disclaimer |
Export potential assessment - trade Analytics for 2030
Export potential enables firms to identify high-growth global markets with greater confidence by combining advanced trade intelligence with a structured quantitative methodology. The framework analyzes emerging demand trends and country-level import patterns while integrating macroeconomic and trade datasets such as GDP and population forecasts, bilateral import–export flows, tariff structures, elasticity differentials between developed and developing economies, geographic distance, and import demand projections. Using weighted trade values from 2020–2024 as the base period to project country-to-country export potential for 2030, these inputs are operationalized through calculated drivers such as gravity model parameters, tariff impact factors, and projected GDP per-capita growth. Through an analysis of hidden potentials, demand hotspots, and market conditions that are most favorable to success, this method enables firms to focus on target countries, maximize returns, and global expansion with data, backed by accuracy.
By factoring in the projected importer demand gap that is currently unmet and could be potential opportunity, it identifies the potential for the Exporter (Country) among 190 countries, against the general trade analysis, which identifies the biggest importer or exporter.
To discover high-growth global markets and optimize your business strategy:
Click Here
Pricing
- Single User License$ 1,995
- Department License$ 2,400
- Site License$ 3,120
- Global License$ 3,795

Search
Thought Leadership and Analyst Meet


Our Clients
Latest Reports
- Taiwan Food Delivery Platform Market (2026-2032) | Companies, Outlook, Analysis, Trends, Value, Revenue, Segmentation, Share, Forecast, Competitive Landscape, Growth, Size & Forecast
- United Kingdom (UK) Long-term Care Insurance Market (2026-2032) | Growth, Share, Consumer Insights, Drivers, Opportunities, Competition, Pricing Analysis, Segments, Restraints, Companies, Competitive, Value, Outlook, Size, Demand, Analysis, Challenges, Strategic Insights, Investment Trends, Revenue, Trends, Supply, Forecast
- United Kingdom (UK) Long Term Care Market (2026-2032) | Companies, Outlook, Analysis, Trends, Value, Revenue, Segmentation, Share, Forecast, Competitive Landscape, Growth, Size & Forecast
- Iraq Insulation and Waterproofing Market (2026-2032) | Outlook, Drivers, Growth, Size, Share, Industry, Revenue, Trends, Demand, Competitive, Strategic Insights, Opportunities, Segments, Companies, Challenges, Strategy, Consumer Insights, Analysis, Investment Trends, Value, Segmentation, Forecast, Restraints
- India Switchgear Market Outlook (2026-2032) | Size, Share, Trends, Growth, Revenue, Forecast, Analysis, Value, Outlook
- Pakistan Contraceptive Implants Market (2025-2031) | Demand, Growth, Size, Share, Industry, Pricing Analysis, Competitive, Strategic Insights, Strategy, Consumer Insights, Analysis, Investment Trends, Opportunities, Revenue, Segments, Value, Segmentation, Supply, Forecast, Restraints, Outlook, Competition, Drivers, Trends, Companies, Challenges
- Sri Lanka Packaging Market (2026-2032) | Outlook, Competition, Drivers, Trends, Demand, Pricing Analysis, Competitive, Strategic Insights, Companies, Challenges, Strategy, Consumer Insights, Analysis, Investment Trends, Opportunities, Growth, Size, Share, Industry, Revenue, Segments, Value, Segmentation, Supply, Forecast, Restraints
- India Kids Watches Market (2026-2032) | Strategy, Consumer Insights, Analysis, Investment Trends, Opportunities, Growth, Size, Share, Industry, Revenue, Segments, Value, Segmentation, Supply, Forecast, Restraints, Outlook, Competition, Drivers, Trends, Demand, Pricing Analysis, Competitive, Strategic Insights, Companies, Challenges
- Saudi Arabia Core Assurance Service Market (2025-2031) | Strategy, Consumer Insights, Analysis, Investment Trends, Opportunities, Growth, Size, Share, Industry, Revenue, Segments, Value, Segmentation, Supply, Forecast, Restraints, Outlook, Competition, Drivers, Trends, Demand, Pricing Analysis, Competitive, Strategic Insights, Companies, Challenges
- Romania Uninterruptible Power Supply (UPS) Market (2026-2032) | Industry, Analysis, Revenue, Size, Forecast, Outlook, Value, Trends, Share, Growth & Companies
Industry Events and Analyst Meet

India EV Show 2026

EV tech India Expo 2026

Auto Tech Asia 2026

Battery Tech India 2026

Smart Production Solutions Guangzhou 2026
Whitepaper
- Middle East & Africa Commercial Security Market Click here to view more.
- Middle East & Africa Fire Safety Systems & Equipment Market Click here to view more.
- GCC Drone Market Click here to view more.
- Middle East Lighting Fixture Market Click here to view more.
- GCC Physical & Perimeter Security Market Click here to view more.
6WResearch In News
- Doha a strategic location for EV manufacturing hub: IPA Qatar
- Demand for luxury TVs surging in the GCC, says Samsung
- Empowering Growth: The Thriving Journey of Bangladesh’s Cable Industry
- Demand for luxury TVs surging in the GCC, says Samsung
- Video call with a traditional healer? Once unthinkable, it’s now common in South Africa
- Intelligent Buildings To Smooth GCC’s Path To Net Zero