Indonesia Guar Market (2026-2032) | Strategy, Pricing Analysis, Trends, Segments, Value, Supply, Forecast, Analysis, Competition, Segmentation, Restraints, Opportunities, Strategic Insights, Companies, Share, Drivers, Size, Outlook, Industry, Revenue, Consumer Insights, Demand, Investment Trends, Competitive, Growth, Challenges
Market Forecast By Type (Guar Gum, Guar Split, Guar Meal), By Application (Food Thickening, Oil Drilling, Animal Feed), By End User (Food Industry, Petroleum Industry, Livestock Farming), By Certification (USDA Organic, ISO 22000, Non-GMO Certified), By Category (Premium, Mid-Range, Budget-Friendly) And Competitive Landscape
| Product Code: ETC12399631 | Publication Date: Apr 2025 | Updated Date: Mar 2026 | Product Type: Market Research Report | |
| Publisher: 6Wresearch | Author: Summon Dutta | No. of Pages: 65 | No. of Figures: 34 | No. of Tables: 19 |
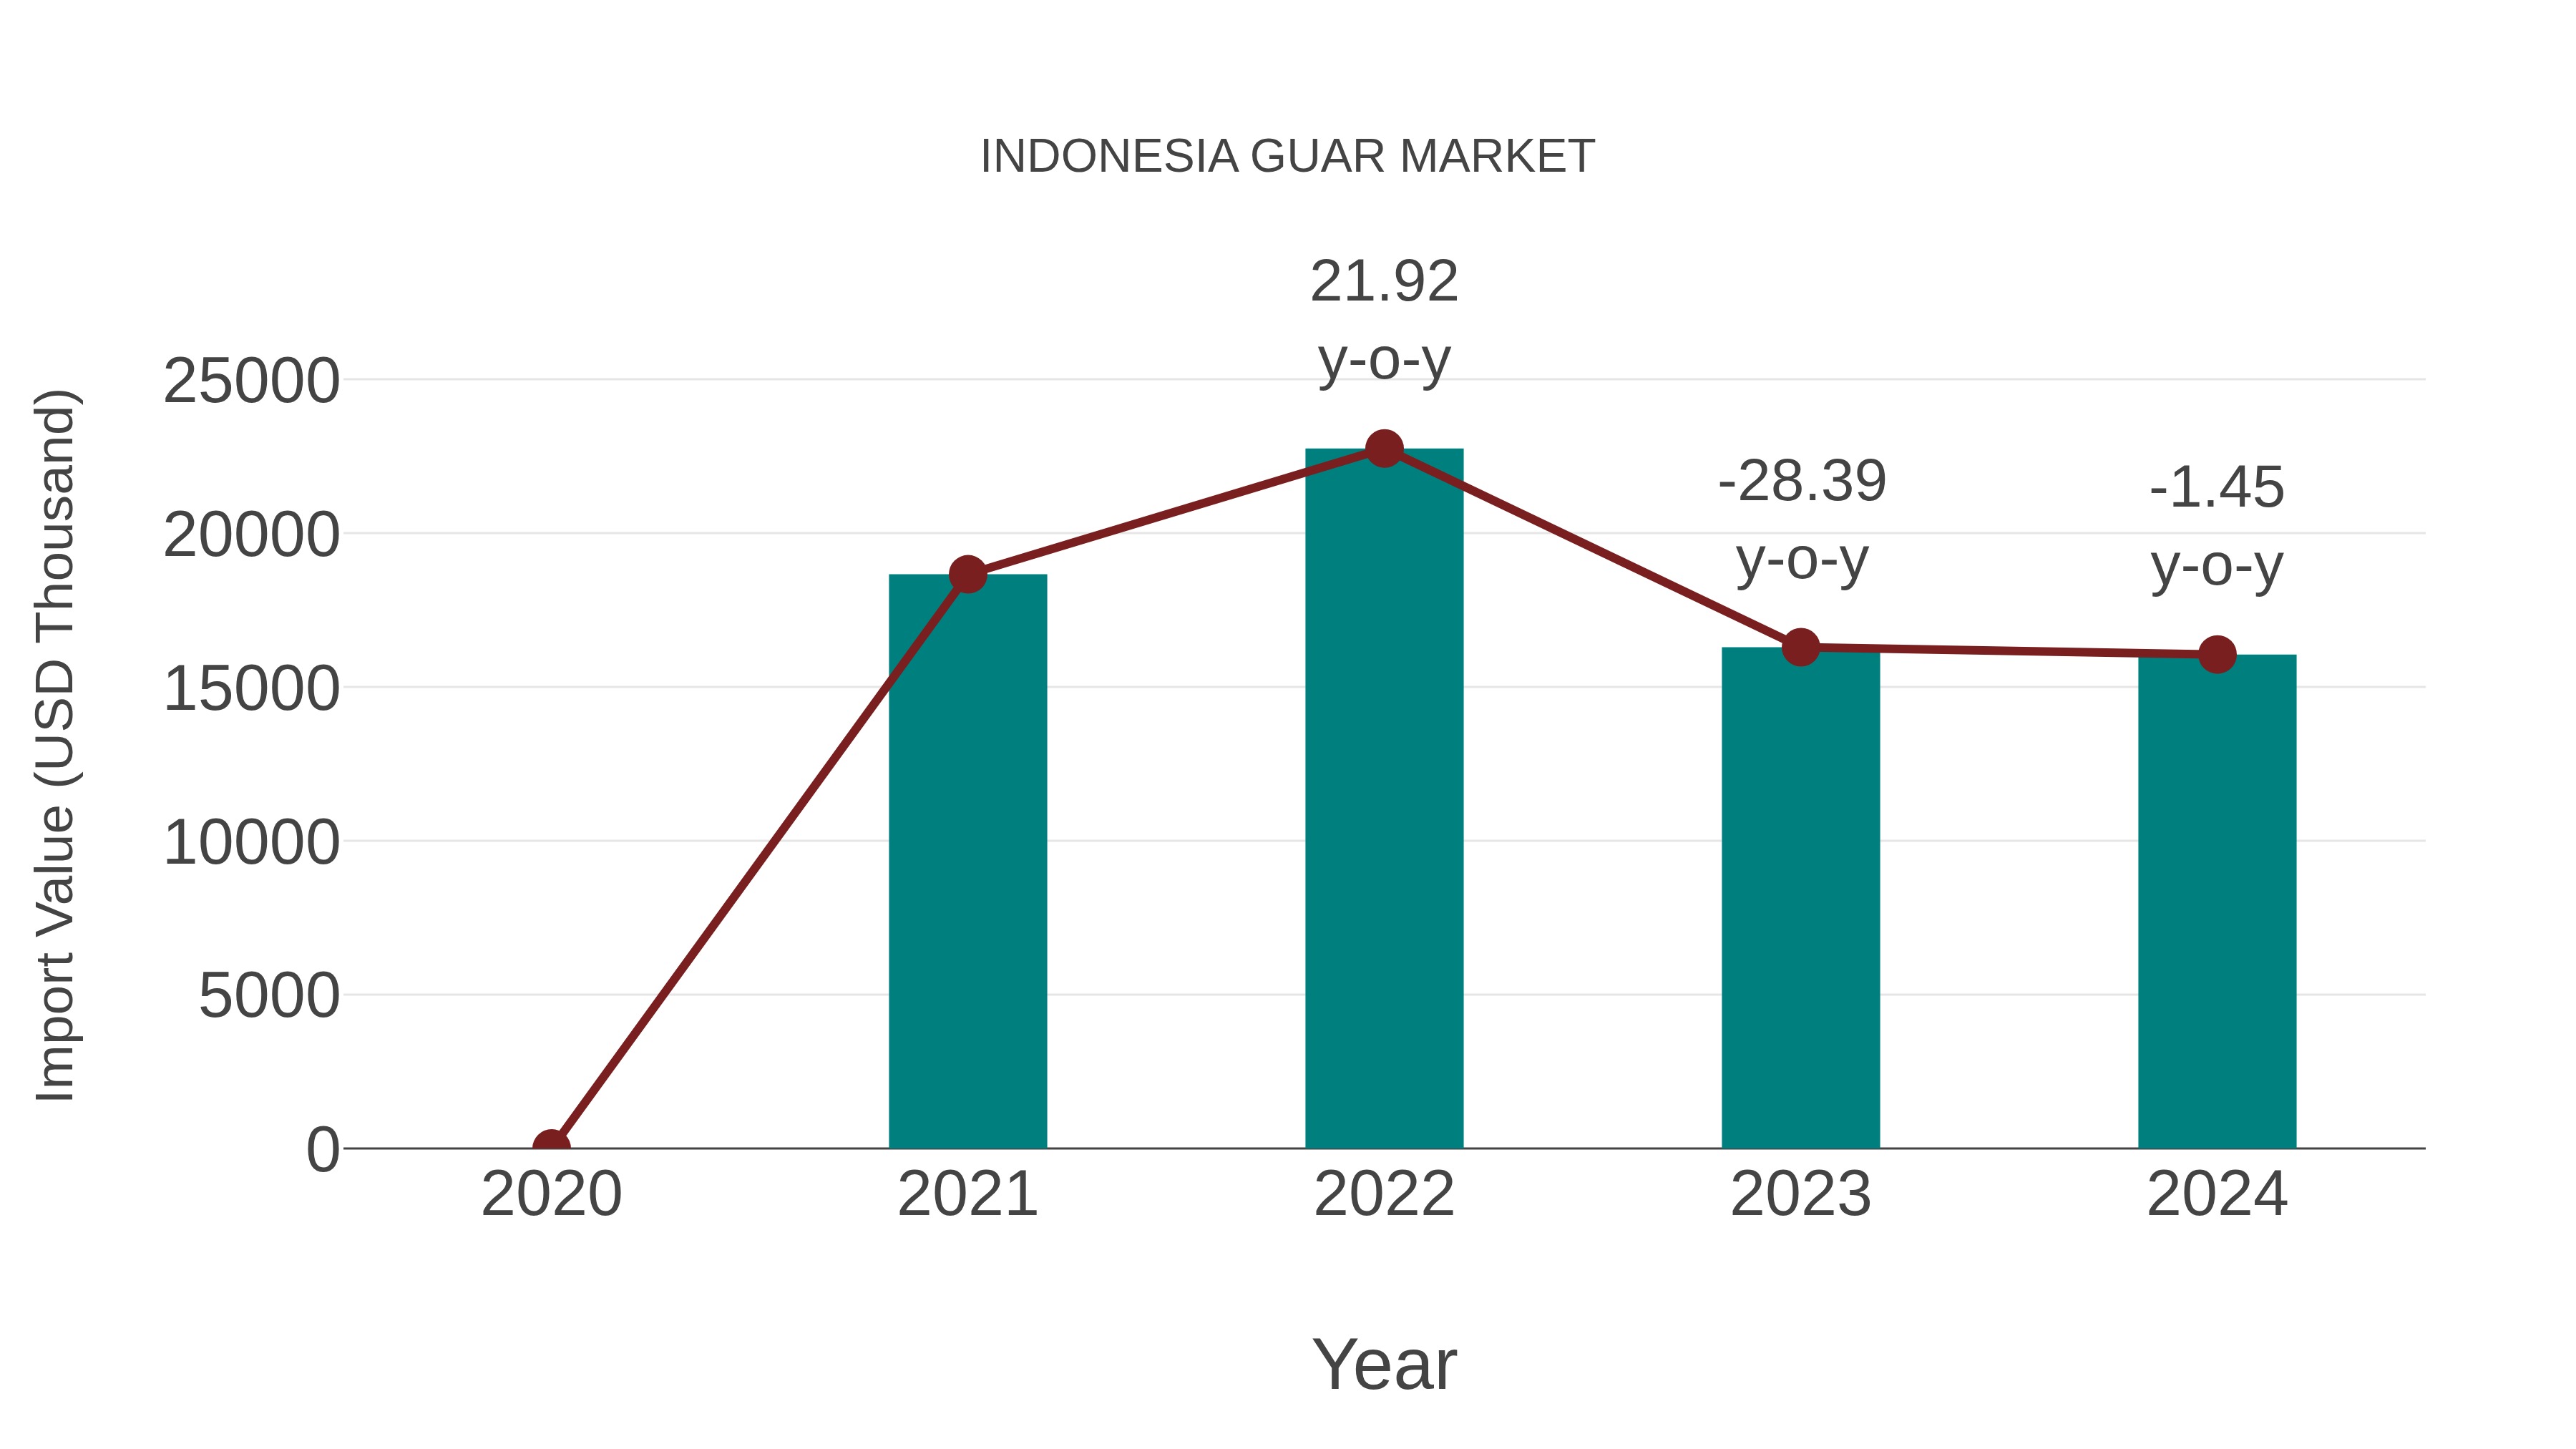
Indonesia Guar Market: Import Trend Analysis
In the Indonesia guar market, the import trend experienced a decline from 2023 to 2024, with a growth rate of -1.45%. The compound annual growth rate (CAGR) for imports between 2020 and 2024 stood at -4.89%. This negative import momentum could be attributed to shifting demand patterns or evolving trade policies impacting market stability.
Indonesia Guar Market Market Overview
The Indonesia guar market is characterized by a growing demand for guar gum, a natural thickening agent derived from guar beans. Guar gum is widely used in various industries such as food, pet food, pharmaceuticals, and cosmetics due to its excellent thickening, stabilizing, and emulsifying properties. Indonesia`s guar market is primarily driven by the increasing adoption of guar gum in food and beverage applications, especially in the processed food industry. The country`s favorable climate for guar cultivation also contributes to the growth of the market. However, challenges such as fluctuating guar prices and competition from other thickening agents may impact the market dynamics. Overall, the Indonesia guar market shows promising growth potential with opportunities for expansion into new application areas and markets.
Indonesia Guar Market Trends
The guar market in Indonesia is currently experiencing steady growth due to the increasing demand for guar gum in various industries such as food, pharmaceuticals, and cosmetics. The rising awareness about the benefits of guar gum as a natural thickening agent, stabilizer, and emulsifier has driven its popularity among manufacturers. Additionally, the expanding food processing sector in Indonesia is boosting the consumption of guar gum in products like dairy, bakery, and confectionery items. Suppliers are focusing on quality control measures and sustainable sourcing practices to meet the growing demand for guar gum in the country. Overall, the Indonesia guar market is poised for further expansion as industries continue to explore the versatile applications of guar gum in their products.
Indonesia Guar Market Challenges
In the Indonesia guar market, some challenges include inconsistent supply due to weather conditions affecting guar crop production, lack of standardized quality control measures leading to variability in product quality, limited knowledge and awareness among farmers about modern cultivation techniques, and competition from other guar-producing countries. Additionally, fluctuating market prices and dependency on imports for processing equipment and technology also pose challenges for the industry. Addressing these issues would require investments in research and development, infrastructure improvements, and capacity building programs to enhance the competitiveness and sustainability of the Indonesia guar market.
Indonesia Guar Market Investment Opportunities
The Indonesia guar market presents promising investment opportunities for those looking to capitalize on the growing demand for guar gum, a natural thickening agent used in various industries such as food, pharmaceuticals, and cosmetics. As one of the largest producers of guar in the world, Indonesia offers a competitive edge in terms of production cost and quality. Investors can consider opportunities in guar cultivation, processing facilities, and export ventures to leverage the increasing global demand for guar gum. Additionally, with the rising consumer preference for natural and plant-based products, the Indonesia guar market is poised for further growth and offers a lucrative investment landscape for those seeking to tap into the thriving market for natural additives and ingredients.
Indonesia Guar Market Government Policy
The Indonesian government has implemented policies to support the guar market, particularly in the form of subsidies and incentives for guar farmers. The government aims to increase guar production to meet domestic demand and reduce the country`s reliance on imported guar products. Additionally, Indonesia has established regulations to ensure the quality and safety of guar products, including standards for cultivation practices and pesticide use. The government also encourages research and development in the guar industry to enhance productivity and promote sustainable farming practices. Overall, these policies reflect Indonesia`s commitment to developing the guar market and making it a significant contributor to the country`s agricultural sector.
Indonesia Guar Market Future Outlook
The future outlook for the Indonesia guar market appears promising as the demand for guar gum continues to rise in various industries such as food, pharmaceuticals, and cosmetics. With its unique properties as a thickening agent and stabilizer, guar gum is gaining popularity as a natural and sustainable alternative to synthetic additives. Indonesia`s favorable climate conditions for guar cultivation also contribute to the growth potential of the market. Additionally, the increasing awareness among consumers regarding the benefits of guar gum in various products is expected to drive further demand. However, challenges such as fluctuating prices and competition from other gum alternatives may impact the market dynamics. Overall, the Indonesia guar market is poised for growth, driven by increasing demand and potential for innovation in product applications.
Key Highlights of the Report:
- Indonesia Guar Market Outlook
- Market Size of Indonesia Guar Market,2025
- Forecast of Indonesia Guar Market, 2032
- Historical Data and Forecast of Indonesia Guar Revenues & Volume for the Period 2022-2032F
- Indonesia Guar Market Trend Evolution
- Indonesia Guar Market Drivers and Challenges
- Indonesia Guar Price Trends
- Indonesia Guar Porter's Five Forces
- Indonesia Guar Industry Life Cycle
- Historical Data and Forecast of Indonesia Guar Market Revenues & Volume By Type for the Period 2022-2032F
- Historical Data and Forecast of Indonesia Guar Market Revenues & Volume By Guar Gum for the Period 2022-2032F
- Historical Data and Forecast of Indonesia Guar Market Revenues & Volume By Guar Split for the Period 2022-2032F
- Historical Data and Forecast of Indonesia Guar Market Revenues & Volume By Guar Meal for the Period 2022-2032F
- Historical Data and Forecast of Indonesia Guar Market Revenues & Volume By Application for the Period 2022-2032F
- Historical Data and Forecast of Indonesia Guar Market Revenues & Volume By Food Thickening for the Period 2022-2032F
- Historical Data and Forecast of Indonesia Guar Market Revenues & Volume By Oil Drilling for the Period 2022-2032F
- Historical Data and Forecast of Indonesia Guar Market Revenues & Volume By Animal Feed for the Period 2022-2032F
- Historical Data and Forecast of Indonesia Guar Market Revenues & Volume By End User for the Period 2022-2032F
- Historical Data and Forecast of Indonesia Guar Market Revenues & Volume By Food Industry for the Period 2022-2032F
- Historical Data and Forecast of Indonesia Guar Market Revenues & Volume By Petroleum Industry for the Period 2022-2032F
- Historical Data and Forecast of Indonesia Guar Market Revenues & Volume By Livestock Farming for the Period 2022-2032F
- Historical Data and Forecast of Indonesia Guar Market Revenues & Volume By Certification for the Period 2022-2032F
- Historical Data and Forecast of Indonesia Guar Market Revenues & Volume By USDA Organic for the Period 2022-2032F
- Historical Data and Forecast of Indonesia Guar Market Revenues & Volume By ISO 22000 for the Period 2022-2032F
- Historical Data and Forecast of Indonesia Guar Market Revenues & Volume By Non-GMO Certified for the Period 2022-2032F
- Historical Data and Forecast of Indonesia Guar Market Revenues & Volume By Category for the Period 2022-2032F
- Historical Data and Forecast of Indonesia Guar Market Revenues & Volume By Premium for the Period 2022-2032F
- Historical Data and Forecast of Indonesia Guar Market Revenues & Volume By Mid-Range for the Period 2022-2032F
- Historical Data and Forecast of Indonesia Guar Market Revenues & Volume By Budget-Friendly for the Period 2022-2032F
- Indonesia Guar Import Export Trade Statistics
- Market Opportunity Assessment By Type
- Market Opportunity Assessment By Application
- Market Opportunity Assessment By End User
- Market Opportunity Assessment By Certification
- Market Opportunity Assessment By Category
- Indonesia Guar Top Companies Market Share
- Indonesia Guar Competitive Benchmarking By Technical and Operational Parameters
- Indonesia Guar Company Profiles
- Indonesia Guar Key Strategic Recommendations
Indonesia Guar Market (2026-2032): FAQs
6Wresearch actively monitors the Indonesia Guar Market and publishes its comprehensive annual report, highlighting emerging trends, growth drivers, revenue analysis, and forecast outlook. Our insights help businesses to make data-backed strategic decisions with ongoing market dynamics. Our analysts track relevent industries related to the Indonesia Guar Market, allowing our clients with actionable intelligence and reliable forecasts tailored to emerging regional needs.
Yes, we provide customisation as per your requirements. To learn more, feel free to contact us on sales@6wresearch.com
1 Executive Summary |
2 Introduction |
2.1 Key Highlights of the Report |
2.2 Report Description |
2.3 Market Scope & Segmentation |
2.4 Research Methodology |
2.5 Assumptions |
3 Indonesia Guar Market Overview |
3.1 Indonesia Country Macro Economic Indicators |
3.2 Indonesia Guar Market Revenues & Volume, 2022 & 2032F |
3.3 Indonesia Guar Market - Industry Life Cycle |
3.4 Indonesia Guar Market - Porter's Five Forces |
3.5 Indonesia Guar Market Revenues & Volume Share, By Type, 2022 & 2032F |
3.6 Indonesia Guar Market Revenues & Volume Share, By Application, 2022 & 2032F |
3.7 Indonesia Guar Market Revenues & Volume Share, By End User, 2022 & 2032F |
3.8 Indonesia Guar Market Revenues & Volume Share, By Certification, 2022 & 2032F |
3.9 Indonesia Guar Market Revenues & Volume Share, By Category, 2022 & 2032F |
4 Indonesia Guar Market Dynamics |
4.1 Impact Analysis |
4.2 Market Drivers |
4.2.1 Increasing demand for natural and organic products in Indonesia |
4.2.2 Growing awareness about the health benefits of guar products |
4.2.3 Expansion of food and beverage industry in the region |
4.3 Market Restraints |
4.3.1 Fluctuations in guar gum prices due to supply chain disruptions |
4.3.2 Limited guar cultivation in Indonesia leading to dependency on imports |
4.3.3 Regulatory challenges in terms of quality control and compliance |
5 Indonesia Guar Market Trends |
6 Indonesia Guar Market, By Types |
6.1 Indonesia Guar Market, By Type |
6.1.1 Overview and Analysis |
6.1.2 Indonesia Guar Market Revenues & Volume, By Type, 2022-2032F |
6.1.3 Indonesia Guar Market Revenues & Volume, By Guar Gum, 2022-2032F |
6.1.4 Indonesia Guar Market Revenues & Volume, By Guar Split, 2022-2032F |
6.1.5 Indonesia Guar Market Revenues & Volume, By Guar Meal, 2022-2032F |
6.2 Indonesia Guar Market, By Application |
6.2.1 Overview and Analysis |
6.2.2 Indonesia Guar Market Revenues & Volume, By Food Thickening, 2022-2032F |
6.2.3 Indonesia Guar Market Revenues & Volume, By Oil Drilling, 2022-2032F |
6.2.4 Indonesia Guar Market Revenues & Volume, By Animal Feed, 2022-2032F |
6.3 Indonesia Guar Market, By End User |
6.3.1 Overview and Analysis |
6.3.2 Indonesia Guar Market Revenues & Volume, By Food Industry, 2022-2032F |
6.3.3 Indonesia Guar Market Revenues & Volume, By Petroleum Industry, 2022-2032F |
6.3.4 Indonesia Guar Market Revenues & Volume, By Livestock Farming, 2022-2032F |
6.4 Indonesia Guar Market, By Certification |
6.4.1 Overview and Analysis |
6.4.2 Indonesia Guar Market Revenues & Volume, By USDA Organic, 2022-2032F |
6.4.3 Indonesia Guar Market Revenues & Volume, By ISO 22000, 2022-2032F |
6.4.4 Indonesia Guar Market Revenues & Volume, By Non-GMO Certified, 2022-2032F |
6.5 Indonesia Guar Market, By Category |
6.5.1 Overview and Analysis |
6.5.2 Indonesia Guar Market Revenues & Volume, By Premium, 2022-2032F |
6.5.3 Indonesia Guar Market Revenues & Volume, By Mid-Range, 2022-2032F |
6.5.4 Indonesia Guar Market Revenues & Volume, By Budget-Friendly, 2022-2032F |
7 Indonesia Guar Market Import-Export Trade Statistics |
7.1 Indonesia Guar Market Export to Major Countries |
7.2 Indonesia Guar Market Imports from Major Countries |
8 Indonesia Guar Market Key Performance Indicators |
8.1 Percentage increase in demand for guar products in Indonesia |
8.2 Adoption rate of guar-based products in the food and beverage industry |
8.3 Number of new guar product launches in the market |
8.4 Percentage of market players investing in RD for guar product innovation |
8.5 Growth in guar gum consumption in various end-use industries in Indonesia |
9 Indonesia Guar Market - Opportunity Assessment |
9.1 Indonesia Guar Market Opportunity Assessment, By Type, 2022 & 2032F |
9.2 Indonesia Guar Market Opportunity Assessment, By Application, 2022 & 2032F |
9.3 Indonesia Guar Market Opportunity Assessment, By End User, 2022 & 2032F |
9.4 Indonesia Guar Market Opportunity Assessment, By Certification, 2022 & 2032F |
9.5 Indonesia Guar Market Opportunity Assessment, By Category, 2022 & 2032F |
10 Indonesia Guar Market - Competitive Landscape |
10.1 Indonesia Guar Market Revenue Share, By Companies, 2025 |
10.2 Indonesia Guar Market Competitive Benchmarking, By Operating and Technical Parameters |
11 Company Profiles |
12 Recommendations |
13 Disclaimer |
Global Go To Market Strategy - 2030
Export potential enables firms to identify high-growth global markets with greater confidence by combining advanced trade intelligence with a structured quantitative methodology. The framework analyzes emerging demand trends and country-level import patterns while integrating macroeconomic and trade datasets such as GDP and population forecasts, bilateral import–export flows, tariff structures, elasticity differentials between developed and developing economies, geographic distance, and import demand projections. Using weighted trade values from 2020–2024 as the base period to project country-to-country export potential for 2030, these inputs are operationalized through calculated drivers such as gravity model parameters, tariff impact factors, and projected GDP per-capita growth. Through an analysis of hidden potentials, demand hotspots, and market conditions that are most favorable to success, this method enables firms to focus on target countries, maximize returns, and global expansion with data, backed by accuracy.
By factoring in the projected importer demand gap that is currently unmet and could be potential opportunity, it identifies the potential for the Exporter (Country) among 190 countries, against the general trade analysis, which identifies the biggest importer or exporter.
To discover high-growth global markets and optimize your business strategy:
Click Here
Pricing
- Single User License$ 1,995
- Department License$ 2,400
- Site License$ 3,120
- Global License$ 3,795

Leadership Perspectives from Industry Events
Search
Thought Leadership and Analyst Meet


Our Clients
6WResearch In News
- Doha a strategic location for EV manufacturing hub: IPA Qatar
- Demand for luxury TVs surging in the GCC, says Samsung
- Empowering Growth: The Thriving Journey of Bangladesh’s Cable Industry
- Demand for luxury TVs surging in the GCC, says Samsung
- Video call with a traditional healer? Once unthinkable, it’s now common in South Africa
- Intelligent Buildings To Smooth GCC’s Path To Net Zero
Latest Reports
- Cape Verde Portable Hand-Thrown Extinguisher Market (2026-2032)
- Canada Portable Hand-Thrown Extinguisher Market (2026-2032)
- Cameroon Portable Hand-Thrown Extinguisher Market (2026-2032)
- Burundi Portable Hand-Thrown Extinguisher Market (2026-2032)
- Burkina Faso Portable Hand-Thrown Extinguisher Market (2026-2032)
- Bulgaria Portable Hand-Thrown Extinguisher Market (2026-2032)
- Brunei Portable Hand-Thrown Extinguisher Market (2026-2032)
- Botswana Portable Hand-Thrown Extinguisher Market (2026-2032)
- Bosnia and Herzegovina Portable Hand-Thrown Extinguisher Market (2026-2032)
- Bolivia Portable Hand-Thrown Extinguisher Market (2026-2032)
Industry Events and Analyst Meet

HIMTEX 2026

India Refining Summit 2026

India EV Show 2026

EV tech India Expo 2026

Auto Tech Asia 2026
Whitepaper
- Middle East & Africa Commercial Security Market Click here to view more.
- Middle East & Africa Fire Safety Systems & Equipment Market Click here to view more.
- GCC Drone Market Click here to view more.
- Middle East Lighting Fixture Market Click here to view more.
- GCC Physical & Perimeter Security Market Click here to view more.