Indonesia Interactive Blackboards Market (2026-2032) Outlook | Trends, Industry, Revenue, Forecast, Share, Growth, Value, Companies, Size & Analysis
Market Forecast By Types (Greater Than 55 Inch, 56-65 Inch, 66-75 Inch, 76-85 Inch, > 85 Inch), By Applications (K-12 Education, Higher Education) And Competitive Landscape
| Product Code: ETC253408 | Publication Date: Aug 2023 | Updated Date: Jul 2026 | Product Type: Market Research Report | |
| Publisher: 6Wresearch | Author: Ravi Bhandari | No. of Pages: 75 | No. of Figures: 35 | No. of Tables: 20 |
Indonesia Interactive Blackboards Market Size, Share & Growth Rate
The Indonesia Interactive Blackboards Market was estimated at USD 238 Million in 2025 and is projected to reach USD 313 Million by 2032, growing at a CAGR of 4.0% from 2026 to 2032. This growth trajectory is fueled by the increasing adoption of interactive technologies in educational settings, where schools and universities are seeking innovative ways to enhance student engagement. Additionally, ongoing government initiatives aimed at modernizing classrooms further catalyze the demand for advanced teaching tools like interactive blackboards.
Indonesia Interactive Blackboards Market Year-wise Growth Rate and Key Drivers
This graph highlights how the Indonesia Interactive Blackboards Market has steadily grown over the years, supported by major growth factors.
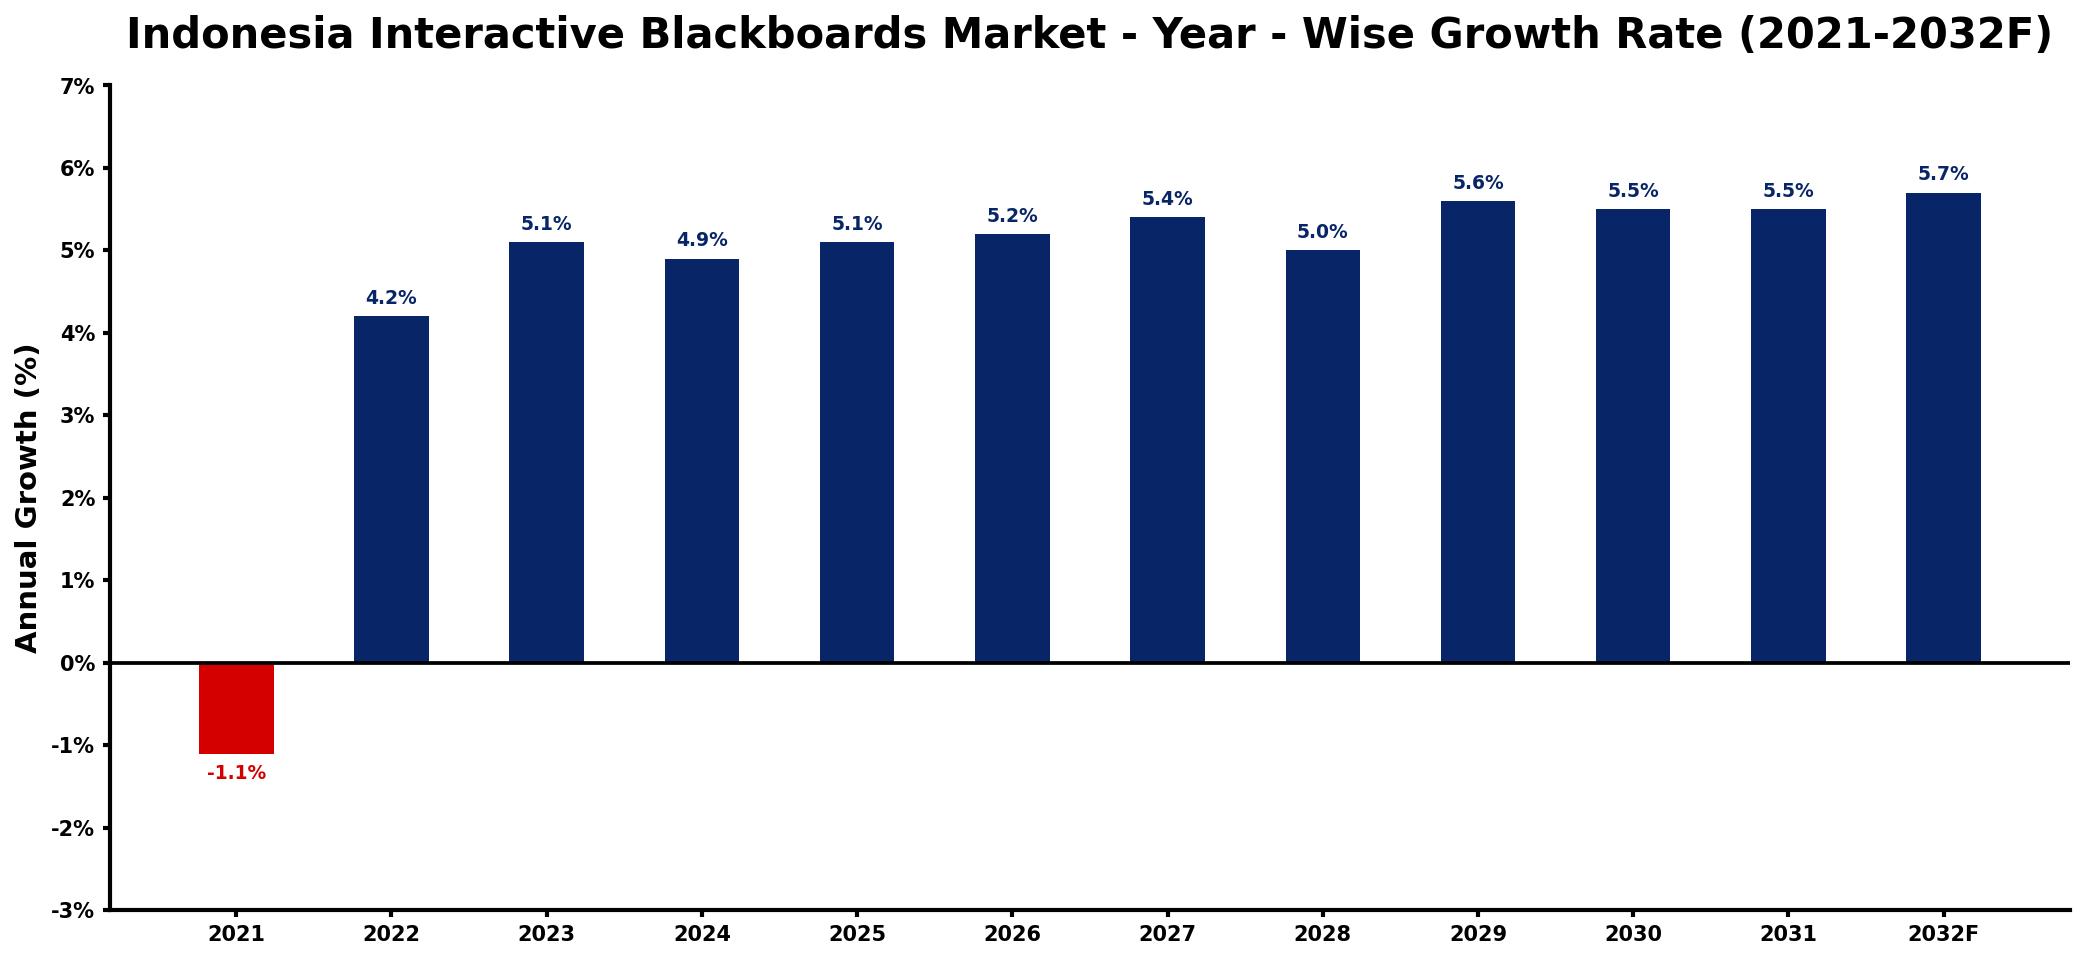
The table below presents the year‑wise growth rates along with the key drivers influencing the market
| Year | Growth Rate | Major Drivers |
| 2021 | -1.1% | Educational funding decreased significantly |
| 2022 | 4.2% | Increase in digital learning adoption |
| 2023 | 5.1% | Growing demand for smart classrooms |
| 2024 | 4.9% | Expansion of e-learning platforms |
| 2025 | 5.1% | Investment in educational technology |
| 2026 | 5.2% | Rise in remote learning initiatives |
| 2027 | 5.4% | Enhanced focus on student engagement |
| 2028 | 5.0% | Government support for digital education |
| 2029 | 5.6% | Emergence of new educational startups |
| 2030 | 5.5% | Integration of AI in education |
| 2031 | 5.5% | Collaborations between schools and tech |
| 2032 | 5.7% | Increased awareness of digital literacy |
Note: Market size estimations and growth projections presented in this report are based on 6Wresearch's proprietary forecasting methodology, utilizing the latest available industry data, government publications, and primary research inputs.
Indonesia Interactive Blackboards Market Synopsis
As Indonesia embarks on a journey of educational transformation, interactive blackboards have emerged as essential tools in this endeavor. Schools, colleges, and universities across the archipelago are integrating these digital boards into their curriculums to foster a more interactive and engaging learning environment.
The potential of interactive blackboards to facilitate collaborative learning and interactive lessons is driving their adoption. In a nation where educational advancement is a government priority, the push for innovative educational tools continues to gain momentum.
Indonesia Interactive Blackboards Market Key Takeaways
- The market is set to experience a robust growth trajectory fueled by educational reforms.
- Increased adoption of digital learning methodologies is driving demand for interactive blackboards.
- Government initiatives are key in promoting technology integration within educational institutions.
- Infrastructure development remains a critical factor influencing market penetration.
- The shift towards personalized learning experiences continues to open new avenues for growth.
Evaluation of Restraints in Indonesia Interactive Blackboards Market
Despite promising growth prospects, the Indonesia Interactive Blackboards Market faces significant challenges that may restrain its expansion. Budget constraints in educational institutions often limit the investment in advanced teaching technologies. Furthermore, the lack of adequate infrastructure in some regions poses a barrier to the effective implementation of interactive blackboards. The disparity between urban and rural schools, in terms of technology access, is also a concern that could hinder market growth and restrict widespread adoption.
Indonesia Interactive Blackboards Market Trends
A notable trend within the Indonesia Interactive Blackboards Market is the increasing emphasis on digital learning methodologies. Educational institutions are adopting blended learning approaches, combining traditional methods with digital tools to enhance student engagement. Moreover, the customization of educational content using interactive technology is becoming increasingly popular, as teachers seek to tailor their lessons to meet diverse learner needs. This trend is further amplified by the rise of remote learning, which has redefined the classroom experience and heightened demand for interactive educational tools.
Indonesia Interactive Blackboards Market Opportunities
The interactive blackboards market presents significant opportunities for growth, particularly through investment in training and support for educators. As schools upgrade their technological capabilities, partnerships between educational institutions and technology providers could enhance the effectiveness of interactive blackboards. Furthermore, with the government's ongoing focus on improving education standards, there is a burgeoning demand for tailored educational solutions that integrate interactive technologies, signaling ripe opportunities for innovative companies in this sector.
Government Initiatives in the Indonesia Interactive Blackboards Market
The Indonesian government has been actively promoting the integration of technology into the education sector. Various initiatives aim to enhance digital literacy and improve access to educational resources. This commitment to educational reform is reflected in policies that encourage schools to adopt modern teaching tools, including interactive blackboards, thereby creating an environment conducive to learning innovation. Public investments aimed at bolstering classroom infrastructure are also being prioritized, which plays a pivotal role in shaping the market landscape.
Future Insights of the Indonesia Interactive Blackboards Market
Looking ahead to the period from 2026 to 2032, the Indonesia Interactive Blackboards Market is poised for significant advancements. With a robust pipeline of technological innovations on the horizon, the capability of interactive blackboards is expected to expand further, integrating advanced features such as real-time feedback and enhanced collaborative tools. Additionally, as the education sector continues to prioritize technology adoption, it will likely catalyze an increase in investment and research aimed at maximizing the potential of interactive learning environments.
Indonesia Interactive Blackboards Market Latest Developments (2025 - 2026)
In recent months, the market has seen a surge in initiatives aimed at expanding the use of interactive blackboards in Indonesias educational institutions. Educational conferences and workshops are increasingly featuring sessions on the best practices for integrating these technologies into the curriculum. Furthermore, several regions have begun pilot programs to evaluate the effectiveness of interactive blackboards in enhancing learning outcomes, paving the way for broader adoption across the nation.
Indonesia Interactive Blackboards Market - Key Attractiveness of the Report
- 10 Years of Market Numbers
- Historical Data Starting from 2022 to 2025
- Base Year: 2025
- Forecast Data until 2032
- Key Performance Indicators Impacting the Market
- Major Upcoming Developments and Projects
Key Highlights of the Report:
- Indonesia Interactive Blackboards Market Outlook
- Market Size of Indonesia Interactive Blackboards Market, 2025
- Forecast of Indonesia Interactive Blackboards Market, 2032
- Historical Data and Forecast of Indonesia Interactive Blackboards Revenues & Volume for the Period 2022-2032F
- Indonesia Interactive Blackboards Market Trend Evolution
- Indonesia Interactive Blackboards Market Drivers and Challenges
- Indonesia Interactive Blackboards Price Trends
- Indonesia Interactive Blackboards Porter's Five Forces
- Indonesia Interactive Blackboards Industry Life Cycle
- Historical Data and Forecast of Indonesia Interactive Blackboards Market Revenues & Volume By Types for the Period 2022-2032F
- Historical Data and Forecast of Indonesia Interactive Blackboards Market Revenues & Volume By Greater Than 55 Inch for the Period 2022-2032F
- Historical Data and Forecast of Indonesia Interactive Blackboards Market Revenues & Volume By 56-65 Inch for the Period 2022-2032F
- Historical Data and Forecast of Indonesia Interactive Blackboards Market Revenues & Volume By 66-75 Inch for the Period 2022-2032F
- Historical Data and Forecast of Indonesia Interactive Blackboards Market Revenues & Volume By 76-85 Inch for the Period 2022-2032F
- Historical Data and Forecast of Indonesia Interactive Blackboards Market Revenues & Volume By > 85 Inch for the Period 2022-2032F
- Historical Data and Forecast of Indonesia Interactive Blackboards Market Revenues & Volume By Applications for the Period 2022-2032F
- Historical Data and Forecast of Indonesia Interactive Blackboards Market Revenues & Volume By K-12 Education for the Period 2022-2032F
- Historical Data and Forecast of Indonesia Interactive Blackboards Market Revenues & Volume By Higher Education for the Period 2022-2032F
- Indonesia Interactive Blackboards Import Export Trade Statistics
- Market Opportunity Assessment By Types
- Market Opportunity Assessment By Applications
- Indonesia Interactive Blackboards Top Companies Market Share
- Indonesia Interactive Blackboards Competitive Benchmarking By Technical and Operational Parameters
- Indonesia Interactive Blackboards Company Profiles
- Indonesia Interactive Blackboards Key Strategic Recommendations
Frequently Asked Questions About the Market Study (FAQs):
The growth is largely driven by the government's focus on modernizing education and integrating technology in classrooms, along with the increasing demand for engaging learning tools among educators.
The pandemic accelerated the adoption of digital learning tools as educational institutions shifted to remote learning. This scenario highlighted the importance of interactive blackboards as effective means for online education.
The market is projected to reach USD 313 Million by 2032, with an estimated value of USD 238 Million in 2025 and a CAGR of 4.0% from 2026 to 2032.
Urban areas with better infrastructure and technology access are typically leading the adoption, while rural areas face challenges in implementation due to limited resources.
Educators are crucial for the successful integration of interactive blackboards, as their training and familiarity with the technology directly influence its effective utilization in classrooms.
6Wresearch actively monitors the Indonesia Interactive Blackboards Market and publishes its comprehensive annual report, highlighting emerging trends, growth drivers, revenue analysis, and forecast outlook. Our insights help businesses to make data-backed strategic decisions with ongoing market dynamics. Our analysts track relevent industries related to the Indonesia Interactive Blackboards Market, allowing our clients with actionable intelligence and reliable forecasts tailored to emerging regional needs.
Yes, we provide customisation as per your requirements. To learn more, feel free to contact us on sales@6wresearch.com
1 Executive Summary |
2 Introduction |
2.1 Key Highlights of the Report |
2.2 Report Description |
2.3 Market Scope & Segmentation |
2.4 Research Methodology |
2.5 Assumptions |
3 Indonesia Interactive Blackboards Market Overview |
3.1 Indonesia Country Macro Economic Indicators |
3.2 Indonesia Interactive Blackboards Market Revenues & Volume, 2022 & 2032F |
3.3 Indonesia Interactive Blackboards Market - Industry Life Cycle |
3.4 Indonesia Interactive Blackboards Market - Porter's Five Forces |
3.5 Indonesia Interactive Blackboards Market Revenues & Volume Share, By Types, 2022 & 2032F |
3.6 Indonesia Interactive Blackboards Market Revenues & Volume Share, By Applications, 2022 & 2032F |
4 Indonesia Interactive Blackboards Market Dynamics |
4.1 Impact Analysis |
4.2 Market Drivers |
4.2.1 Increasing adoption of digital learning solutions in the education sector in Indonesia |
4.2.2 Government initiatives to promote technology integration in schools |
4.2.3 Growing demand for interactive and engaging teaching tools |
4.3 Market Restraints |
4.3.1 High initial investment cost associated with interactive blackboards |
4.3.2 Lack of awareness and training among educators on how to effectively use interactive blackboards |
4.3.3 Limited internet connectivity and infrastructure in some regions of Indonesia |
5 Indonesia Interactive Blackboards Market Trends |
6 Indonesia Interactive Blackboards Market, By Types |
6.1 Indonesia Interactive Blackboards Market, By Types |
6.1.1 Overview and Analysis |
6.1.2 Indonesia Interactive Blackboards Market Revenues & Volume, By Types, 2022-2032F |
6.1.3 Indonesia Interactive Blackboards Market Revenues & Volume, By Greater Than 55 Inch, 2022-2032F |
6.1.4 Indonesia Interactive Blackboards Market Revenues & Volume, By 56-65 Inch, 2022-2032F |
6.1.5 Indonesia Interactive Blackboards Market Revenues & Volume, By 66-75 Inch, 2022-2032F |
6.1.6 Indonesia Interactive Blackboards Market Revenues & Volume, By 76-85 Inch, 2022-2032F |
6.1.7 Indonesia Interactive Blackboards Market Revenues & Volume, By > 85 Inch, 2022-2032F |
6.2 Indonesia Interactive Blackboards Market, By Applications |
6.2.1 Overview and Analysis |
6.2.2 Indonesia Interactive Blackboards Market Revenues & Volume, By K-12 Education, 2022-2032F |
6.2.3 Indonesia Interactive Blackboards Market Revenues & Volume, By Higher Education, 2022-2032F |
7 Indonesia Interactive Blackboards Market Import-Export Trade Statistics |
7.1 Indonesia Interactive Blackboards Market Export to Major Countries |
7.2 Indonesia Interactive Blackboards Market Imports from Major Countries |
8 Indonesia Interactive Blackboards Market Key Performance Indicators |
8.1 Percentage increase in the number of schools adopting interactive blackboards |
8.2 Average time spent by students engaged with interactive blackboards during a class |
8.3 Number of training sessions conducted for educators on interactive blackboard usage |
8.4 Rate of growth in the development of educational content compatible with interactive blackboards |
8.5 Percentage increase in student engagement and participation levels in classrooms where interactive blackboards are used |
9 Indonesia Interactive Blackboards Market - Opportunity Assessment |
9.1 Indonesia Interactive Blackboards Market Opportunity Assessment, By Types, 2022 & 2032F |
9.2 Indonesia Interactive Blackboards Market Opportunity Assessment, By Applications, 2022 & 2032F |
10 Indonesia Interactive Blackboards Market - Competitive Landscape |
10.1 Indonesia Interactive Blackboards Market Revenue Share, By Companies, 2025 |
10.2 Indonesia Interactive Blackboards Market Competitive Benchmarking, By Operating and Technical Parameters |
11 Company Profiles |
12 Recommendations |
13 Disclaimer |
Global Go To Market Strategy - 2030
Export potential enables firms to identify high-growth global markets with greater confidence by combining advanced trade intelligence with a structured quantitative methodology. The framework analyzes emerging demand trends and country-level import patterns while integrating macroeconomic and trade datasets such as GDP and population forecasts, bilateral import–export flows, tariff structures, elasticity differentials between developed and developing economies, geographic distance, and import demand projections. Using weighted trade values from 2020–2024 as the base period to project country-to-country export potential for 2030, these inputs are operationalized through calculated drivers such as gravity model parameters, tariff impact factors, and projected GDP per-capita growth. Through an analysis of hidden potentials, demand hotspots, and market conditions that are most favorable to success, this method enables firms to focus on target countries, maximize returns, and global expansion with data, backed by accuracy.
By factoring in the projected importer demand gap that is currently unmet and could be potential opportunity, it identifies the potential for the Exporter (Country) among 190 countries, against the general trade analysis, which identifies the biggest importer or exporter.
To discover high-growth global markets and optimize your business strategy:
Click Here
Pricing
- Single User License$ 1,995
- Department License$ 2,400
- Site License$ 3,120
- Global License$ 3,795

Leadership Perspectives from Industry Events
Search
Thought Leadership and Analyst Meet


Our Clients
6WResearch In News
- India Air Conditioner Market Set for Strong Rebound in 2026 After Weather-Led Correction and GST-Driven Recovery: 6Wresearch
- ADAS in India: How Automatic Emergency Braking, Blind Spot Detection & Driver Monitoring are Transforming Road Safety
- Doha a strategic location for EV manufacturing hub: IPA Qatar
- Demand for luxury TVs surging in the GCC, says Samsung
- Empowering Growth: The Thriving Journey of Bangladesh’s Cable Industry
- Demand for luxury TVs surging in the GCC, says Samsung
Latest Reports
- Nicaragua RPG Gaming Market (2026-2032)
- New Zealand RPG Gaming Market (2026-2032)
- Netherlands RPG Gaming Market (2026-2032)
- Nauru RPG Gaming Market (2026-2032)
- Namibia RPG Gaming Market (2026-2032)
- Mozambique RPG Gaming Market (2026-2032)
- Montenegro RPG Gaming Market (2026-2032)
- Mongolia RPG Gaming Market (2026-2032)
- Monaco RPG Gaming Market (2026-2032)
- Micronesia RPG Gaming Market (2026-2032)
Industry Events and Analyst Meet

EV India Expo 2026

HIMTEX 2026

India Refining Summit 2026

India EV Show 2026

EV tech India Expo 2026
Whitepaper
- Middle East & Africa Commercial Security Market Click here to view more.
- Middle East & Africa Fire Safety Systems & Equipment Market Click here to view more.
- GCC Drone Market Click here to view more.
- Middle East Lighting Fixture Market Click here to view more.
- GCC Physical & Perimeter Security Market Click here to view more.