Indonesia Low E Glass Market (2026-2032) | Opportunities, Strategic Insights, Demand, Revenue, Drivers, Share, Strategy, Size, Challenges, Investment Trends, Outlook, Restraints, Pricing Analysis, Forecast, Segmentation, Analysis, Competition, Industry, Value, Segments, Consumer Insights, Trends, Supply, Competitive, Growth, Companies
Market Forecast By Glazing (Single Glazing, Double Glazing, Triple Glazing), By Coating Type (Solar control low-E coating, Passive low-E coating, Others), By End use (Building and Construction, Automotive, Others) And Competitive Landscape
| Product Code: ETC12576079 | Publication Date: Apr 2025 | Updated Date: Mar 2026 | Product Type: Market Research Report | |
| Publisher: 6Wresearch | Author: Dhaval Chaurasia | No. of Pages: 65 | No. of Figures: 34 | No. of Tables: 19 |
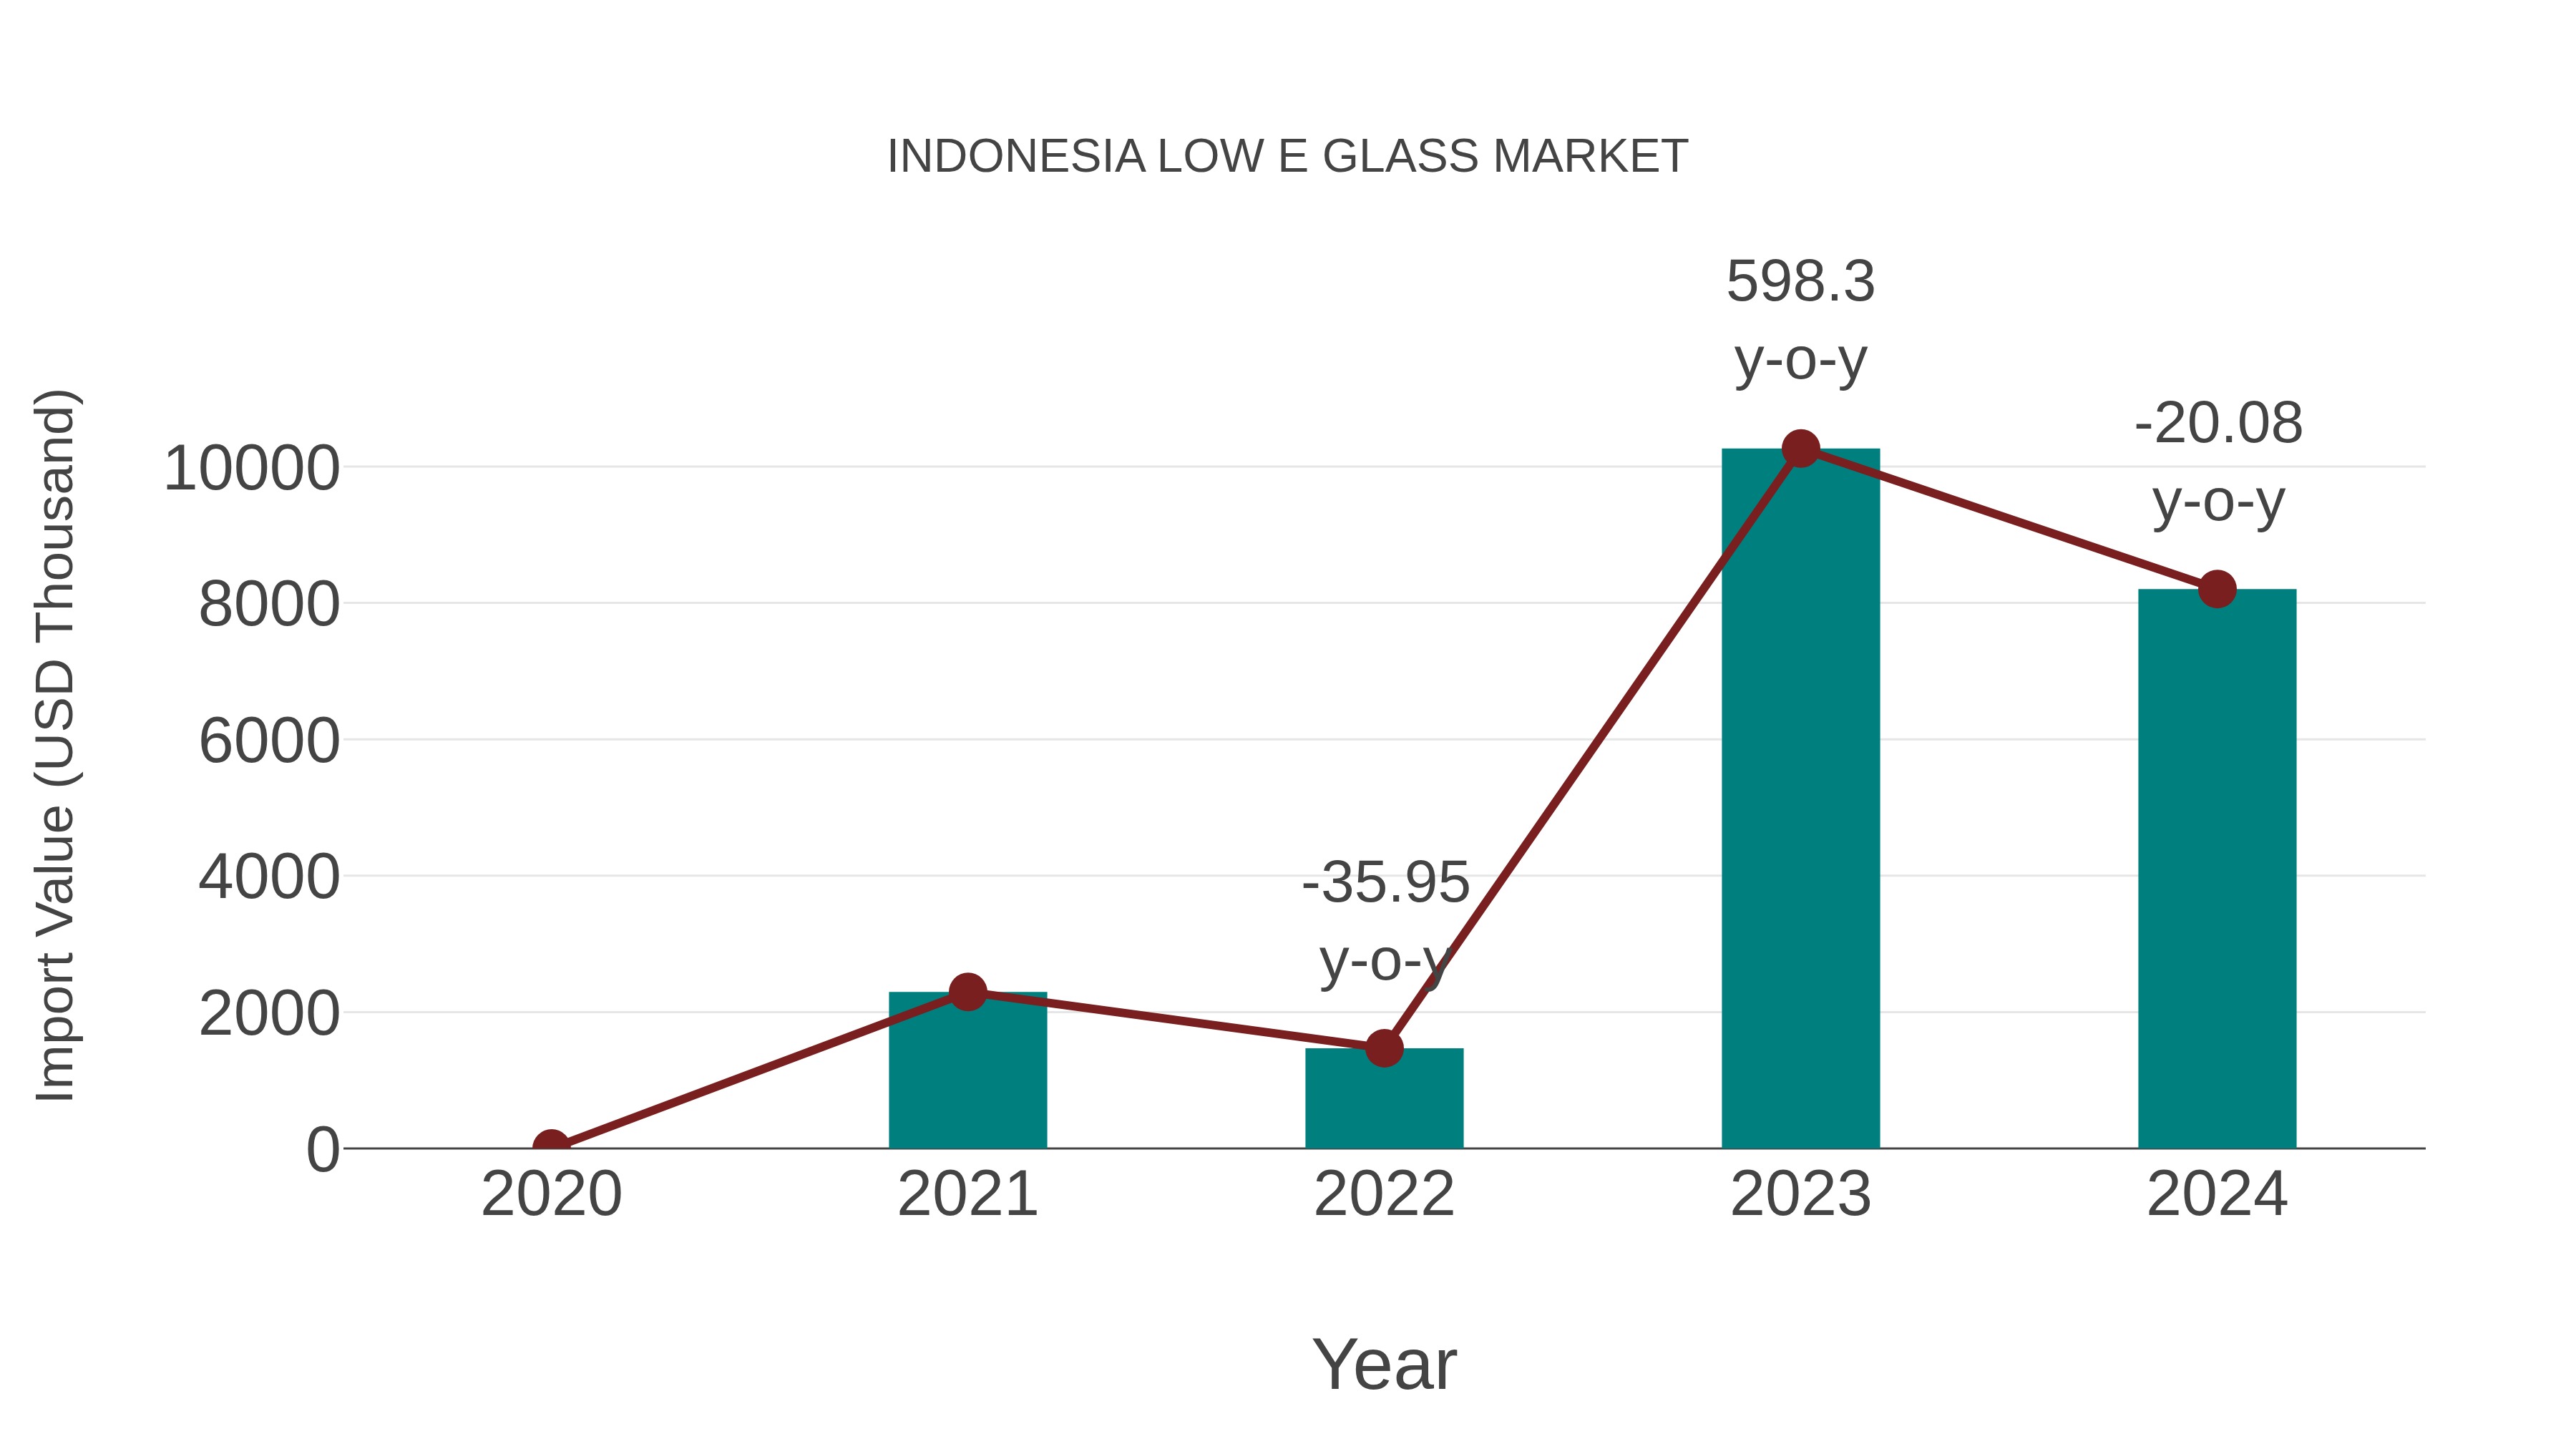
Indonesia Low E Glass Market: Import Trend Analysis
Indonesia`s low e glass market witnessed a notable import trend from 2023 to 2024, with a growth rate of -20.08%. However, the compound annual growth rate (CAGR) for the period 2020-2024 stood at a robust 52.9%. This decline in import momentum in 2024 could be attributed to shifting demand patterns or changes in trade policies affecting the market`s stability.
Indonesia Low E Glass Market Overview
The Indonesia low e glass market is experiencing steady growth due to increasing construction activities and the rising demand for energy-efficient building materials. Low e glass, or low emissivity glass, is designed to minimize heat transfer through windows while allowing light to pass through, making buildings more energy-efficient. The market is driven by government initiatives promoting sustainable construction practices and the need for reducing energy consumption in buildings. Key players in the market are focusing on product innovation and expanding their distribution networks to meet the growing demand. The market is expected to continue growing as awareness of environmental issues and energy efficiency increases among consumers and businesses in Indonesia.
Indonesia Low E Glass Market Trends
The Indonesia low e glass market is experiencing significant growth driven by increasing demand for energy-efficient building materials. Low e glass helps in reducing heat transfer and improving thermal insulation, making it a popular choice for both residential and commercial construction projects. With the government focusing on sustainable development and energy efficiency initiatives, the adoption of low e glass is expected to witness a further uptick in the coming years. Manufacturers are also investing in research and development to enhance the performance characteristics of low e glass and offer innovative solutions to meet the evolving needs of the market. Overall, the Indonesia low e glass market is poised for steady growth as awareness about energy conservation and sustainability continues to rise among consumers and businesses.
Indonesia Low E Glass Market Challenges
In the Indonesia low e glass market, several challenges are faced, including limited awareness and understanding of the benefits of low e glass among consumers and builders, leading to slower adoption rates. Additionally, the high initial cost of low e glass compared to traditional glass options can be a barrier for some buyers, impacting market growth. Supply chain issues, such as limited availability of raw materials and skilled labor for installation, also pose challenges for manufacturers and distributors. Furthermore, the presence of counterfeit or low-quality low e glass products in the market can lead to concerns about product reliability and performance, affecting consumer confidence in the technology. Overall, addressing these challenges through education, cost-effective solutions, and quality control measures will be crucial for the sustainable growth of the low e glass market in Indonesia.
Indonesia Low E Glass Market Investment Opportunities
The low e glass market in Indonesia presents promising investment opportunities due to the country`s growing construction industry and increasing focus on energy efficiency. Low e glass, which helps in reducing heat transfer and improving insulation, is in high demand among commercial and residential builders looking to meet green building standards. Investing in low e glass manufacturing or distribution in Indonesia could be lucrative as the government encourages sustainable building practices. Additionally, the rising awareness among consumers regarding energy efficiency and the benefits of low e glass further enhances the market potential. Partnering with local manufacturers or suppliers, leveraging innovative technologies, and offering competitive pricing can position investors well in this expanding market segment.
Indonesia Low E Glass Market Government Policy
The Indonesian government has introduced several policies aimed at promoting the use of low-emissivity (low-e) glass in the country. One of the key initiatives is the implementation of energy efficiency standards that encourage the adoption of low-e glass in buildings to reduce energy consumption and greenhouse gas emissions. Additionally, the government has provided incentives such as tax breaks and subsidies to manufacturers and developers using low-e glass in their projects. Furthermore, there are regulations in place that require certain buildings to incorporate energy-efficient materials like low-e glass to meet sustainability targets. Overall, these policies reflect the government`s commitment to promoting sustainable construction practices and reducing the environmental impact of buildings in Indonesia.
Indonesia Low E Glass Market Future Outlook
The Indonesia low e glass market is poised for significant growth in the coming years due to increasing demand for energy-efficient solutions in the construction sector. The government`s focus on sustainable development and stringent regulations regarding energy efficiency in buildings are driving the adoption of low e glass products. Additionally, the growing awareness among consumers about the benefits of low e glass in reducing energy consumption and enhancing indoor comfort levels is expected to further boost market growth. Technological advancements in the manufacturing processes of low e glass, along with the expanding construction industry in Indonesia, will also contribute to the market`s positive outlook. Overall, the Indonesia low e glass market is anticipated to experience steady expansion as it becomes an integral part of sustainable building practices in the country.
Key Highlights of the Report:
- Indonesia Low E Glass Market Outlook
- Market Size of Indonesia Low E Glass Market,2025
- Forecast of Indonesia Low E Glass Market, 2032
- Historical Data and Forecast of Indonesia Low E Glass Revenues & Volume for the Period 2022-2032F
- Indonesia Low E Glass Market Trend Evolution
- Indonesia Low E Glass Market Drivers and Challenges
- Indonesia Low E Glass Price Trends
- Indonesia Low E Glass Porter's Five Forces
- Indonesia Low E Glass Industry Life Cycle
- Historical Data and Forecast of Indonesia Low E Glass Market Revenues & Volume By Glazing for the Period 2022-2032F
- Historical Data and Forecast of Indonesia Low E Glass Market Revenues & Volume By Single Glazing for the Period 2022-2032F
- Historical Data and Forecast of Indonesia Low E Glass Market Revenues & Volume By Double Glazing for the Period 2022-2032F
- Historical Data and Forecast of Indonesia Low E Glass Market Revenues & Volume By Triple Glazing for the Period 2022-2032F
- Historical Data and Forecast of Indonesia Low E Glass Market Revenues & Volume By Coating Type for the Period 2022-2032F
- Historical Data and Forecast of Indonesia Low E Glass Market Revenues & Volume By Solar control low-E coating for the Period 2022-2032F
- Historical Data and Forecast of Indonesia Low E Glass Market Revenues & Volume By Passive low-E coating for the Period 2022-2032F
- Historical Data and Forecast of Indonesia Low E Glass Market Revenues & Volume By Others for the Period 2022-2032F
- Historical Data and Forecast of Indonesia Low E Glass Market Revenues & Volume By End use for the Period 2022-2032F
- Historical Data and Forecast of Indonesia Low E Glass Market Revenues & Volume By Building and Construction for the Period 2022-2032F
- Historical Data and Forecast of Indonesia Low E Glass Market Revenues & Volume By Automotive for the Period 2022-2032F
- Historical Data and Forecast of Indonesia Low E Glass Market Revenues & Volume By Others for the Period 2022-2032F
- Indonesia Low E Glass Import Export Trade Statistics
- Market Opportunity Assessment By Glazing
- Market Opportunity Assessment By Coating Type
- Market Opportunity Assessment By End use
- Indonesia Low E Glass Top Companies Market Share
- Indonesia Low E Glass Competitive Benchmarking By Technical and Operational Parameters
- Indonesia Low E Glass Company Profiles
- Indonesia Low E Glass Key Strategic Recommendations
Indonesia Low E Glass Market (2026-2032): FAQs
6Wresearch actively monitors the Indonesia Low E Glass Market and publishes its comprehensive annual report, highlighting emerging trends, growth drivers, revenue analysis, and forecast outlook. Our insights help businesses to make data-backed strategic decisions with ongoing market dynamics. Our analysts track relevent industries related to the Indonesia Low E Glass Market, allowing our clients with actionable intelligence and reliable forecasts tailored to emerging regional needs.
Yes, we provide customisation as per your requirements. To learn more, feel free to contact us on sales@6wresearch.com
1 Executive Summary |
2 Introduction |
2.1 Key Highlights of the Report |
2.2 Report Description |
2.3 Market Scope & Segmentation |
2.4 Research Methodology |
2.5 Assumptions |
3 Indonesia Low E Glass Market Overview |
3.1 Indonesia Country Macro Economic Indicators |
3.2 Indonesia Low E Glass Market Revenues & Volume, 2022 & 2032F |
3.3 Indonesia Low E Glass Market - Industry Life Cycle |
3.4 Indonesia Low E Glass Market - Porter's Five Forces |
3.5 Indonesia Low E Glass Market Revenues & Volume Share, By Glazing, 2022 & 2032F |
3.6 Indonesia Low E Glass Market Revenues & Volume Share, By Coating Type, 2022 & 2032F |
3.7 Indonesia Low E Glass Market Revenues & Volume Share, By End use, 2022 & 2032F |
4 Indonesia Low E Glass Market Dynamics |
4.1 Impact Analysis |
4.2 Market Drivers |
4.2.1 Increasing awareness about energy efficiency and sustainability in building construction |
4.2.2 Government regulations promoting energy-efficient building materials |
4.2.3 Growth in the construction industry in Indonesia |
4.3 Market Restraints |
4.3.1 High initial cost of low e glass compared to traditional glass |
4.3.2 Lack of skilled labor for installation and maintenance of low e glass |
4.3.3 Limited availability of specialized low e glass manufacturing facilities in Indonesia |
5 Indonesia Low E Glass Market Trends |
6 Indonesia Low E Glass Market, By Types |
6.1 Indonesia Low E Glass Market, By Glazing |
6.1.1 Overview and Analysis |
6.1.2 Indonesia Low E Glass Market Revenues & Volume, By Glazing, 2022-2032F |
6.1.3 Indonesia Low E Glass Market Revenues & Volume, By Single Glazing, 2022-2032F |
6.1.4 Indonesia Low E Glass Market Revenues & Volume, By Double Glazing, 2022-2032F |
6.1.5 Indonesia Low E Glass Market Revenues & Volume, By Triple Glazing, 2022-2032F |
6.2 Indonesia Low E Glass Market, By Coating Type |
6.2.1 Overview and Analysis |
6.2.2 Indonesia Low E Glass Market Revenues & Volume, By Solar control low-E coating, 2022-2032F |
6.2.3 Indonesia Low E Glass Market Revenues & Volume, By Passive low-E coating, 2022-2032F |
6.2.4 Indonesia Low E Glass Market Revenues & Volume, By Others, 2022-2032F |
6.3 Indonesia Low E Glass Market, By End use |
6.3.1 Overview and Analysis |
6.3.2 Indonesia Low E Glass Market Revenues & Volume, By Building and Construction, 2022-2032F |
6.3.3 Indonesia Low E Glass Market Revenues & Volume, By Automotive, 2022-2032F |
6.3.4 Indonesia Low E Glass Market Revenues & Volume, By Others, 2022-2032F |
7 Indonesia Low E Glass Market Import-Export Trade Statistics |
7.1 Indonesia Low E Glass Market Export to Major Countries |
7.2 Indonesia Low E Glass Market Imports from Major Countries |
8 Indonesia Low E Glass Market Key Performance Indicators |
8.1 Energy savings achieved through the use of low e glass in buildings |
8.2 Number of new construction projects incorporating low e glass |
8.3 Percentage increase in demand for low e glass compared to traditional glass |
9 Indonesia Low E Glass Market - Opportunity Assessment |
9.1 Indonesia Low E Glass Market Opportunity Assessment, By Glazing, 2022 & 2032F |
9.2 Indonesia Low E Glass Market Opportunity Assessment, By Coating Type, 2022 & 2032F |
9.3 Indonesia Low E Glass Market Opportunity Assessment, By End use, 2022 & 2032F |
10 Indonesia Low E Glass Market - Competitive Landscape |
10.1 Indonesia Low E Glass Market Revenue Share, By Companies, 2025 |
10.2 Indonesia Low E Glass Market Competitive Benchmarking, By Operating and Technical Parameters |
11 Company Profiles |
12 Recommendations |
13 Disclaimer |
Global Go To Market Strategy - 2030
Export potential enables firms to identify high-growth global markets with greater confidence by combining advanced trade intelligence with a structured quantitative methodology. The framework analyzes emerging demand trends and country-level import patterns while integrating macroeconomic and trade datasets such as GDP and population forecasts, bilateral import–export flows, tariff structures, elasticity differentials between developed and developing economies, geographic distance, and import demand projections. Using weighted trade values from 2020–2024 as the base period to project country-to-country export potential for 2030, these inputs are operationalized through calculated drivers such as gravity model parameters, tariff impact factors, and projected GDP per-capita growth. Through an analysis of hidden potentials, demand hotspots, and market conditions that are most favorable to success, this method enables firms to focus on target countries, maximize returns, and global expansion with data, backed by accuracy.
By factoring in the projected importer demand gap that is currently unmet and could be potential opportunity, it identifies the potential for the Exporter (Country) among 190 countries, against the general trade analysis, which identifies the biggest importer or exporter.
To discover high-growth global markets and optimize your business strategy:
Click Here
Pricing
- Single User License$ 1,995
- Department License$ 2,400
- Site License$ 3,120
- Global License$ 3,795

Leadership Perspectives from Industry Events
Search
Thought Leadership and Analyst Meet


Our Clients
6WResearch In News
- ADAS in India: How Automatic Emergency Braking, Blind Spot Detection & Driver Monitoring are Transforming Road Safety
- Doha a strategic location for EV manufacturing hub: IPA Qatar
- Demand for luxury TVs surging in the GCC, says Samsung
- Empowering Growth: The Thriving Journey of Bangladesh’s Cable Industry
- Demand for luxury TVs surging in the GCC, says Samsung
- Video call with a traditional healer? Once unthinkable, it’s now common in South Africa
Latest Reports
- Poland Fire Protection Systems Market (2026-2032)
- Cape Verde Portable Hand-Thrown Extinguisher Market (2026-2032)
- Canada Portable Hand-Thrown Extinguisher Market (2026-2032)
- Cameroon Portable Hand-Thrown Extinguisher Market (2026-2032)
- Burundi Portable Hand-Thrown Extinguisher Market (2026-2032)
- Burkina Faso Portable Hand-Thrown Extinguisher Market (2026-2032)
- Bulgaria Portable Hand-Thrown Extinguisher Market (2026-2032)
- Brunei Portable Hand-Thrown Extinguisher Market (2026-2032)
- Botswana Portable Hand-Thrown Extinguisher Market (2026-2032)
- Bosnia and Herzegovina Portable Hand-Thrown Extinguisher Market (2026-2032)
Industry Events and Analyst Meet

HIMTEX 2026

India Refining Summit 2026

India EV Show 2026

EV tech India Expo 2026

Auto Tech Asia 2026
Whitepaper
- Middle East & Africa Commercial Security Market Click here to view more.
- Middle East & Africa Fire Safety Systems & Equipment Market Click here to view more.
- GCC Drone Market Click here to view more.
- Middle East Lighting Fixture Market Click here to view more.
- GCC Physical & Perimeter Security Market Click here to view more.