Indonesia Odoriferous Substances Market (2026-2032) Outlook | Industry, Analysis, Trends, Growth, Size, Share, Value, Forecast, Companies, Revenue
Market Forecast By End User (Soap and Ointments, Pharmaceuticals, Others) And Competitive Landscape
| Product Code: ETC418164 | Publication Date: Oct 2022 | Updated Date: Mar 2026 | Product Type: Market Research Report | |
| Publisher: 6Wresearch | Author: Ravi Bhandari | No. of Pages: 75 | No. of Figures: 35 | No. of Tables: 20 |
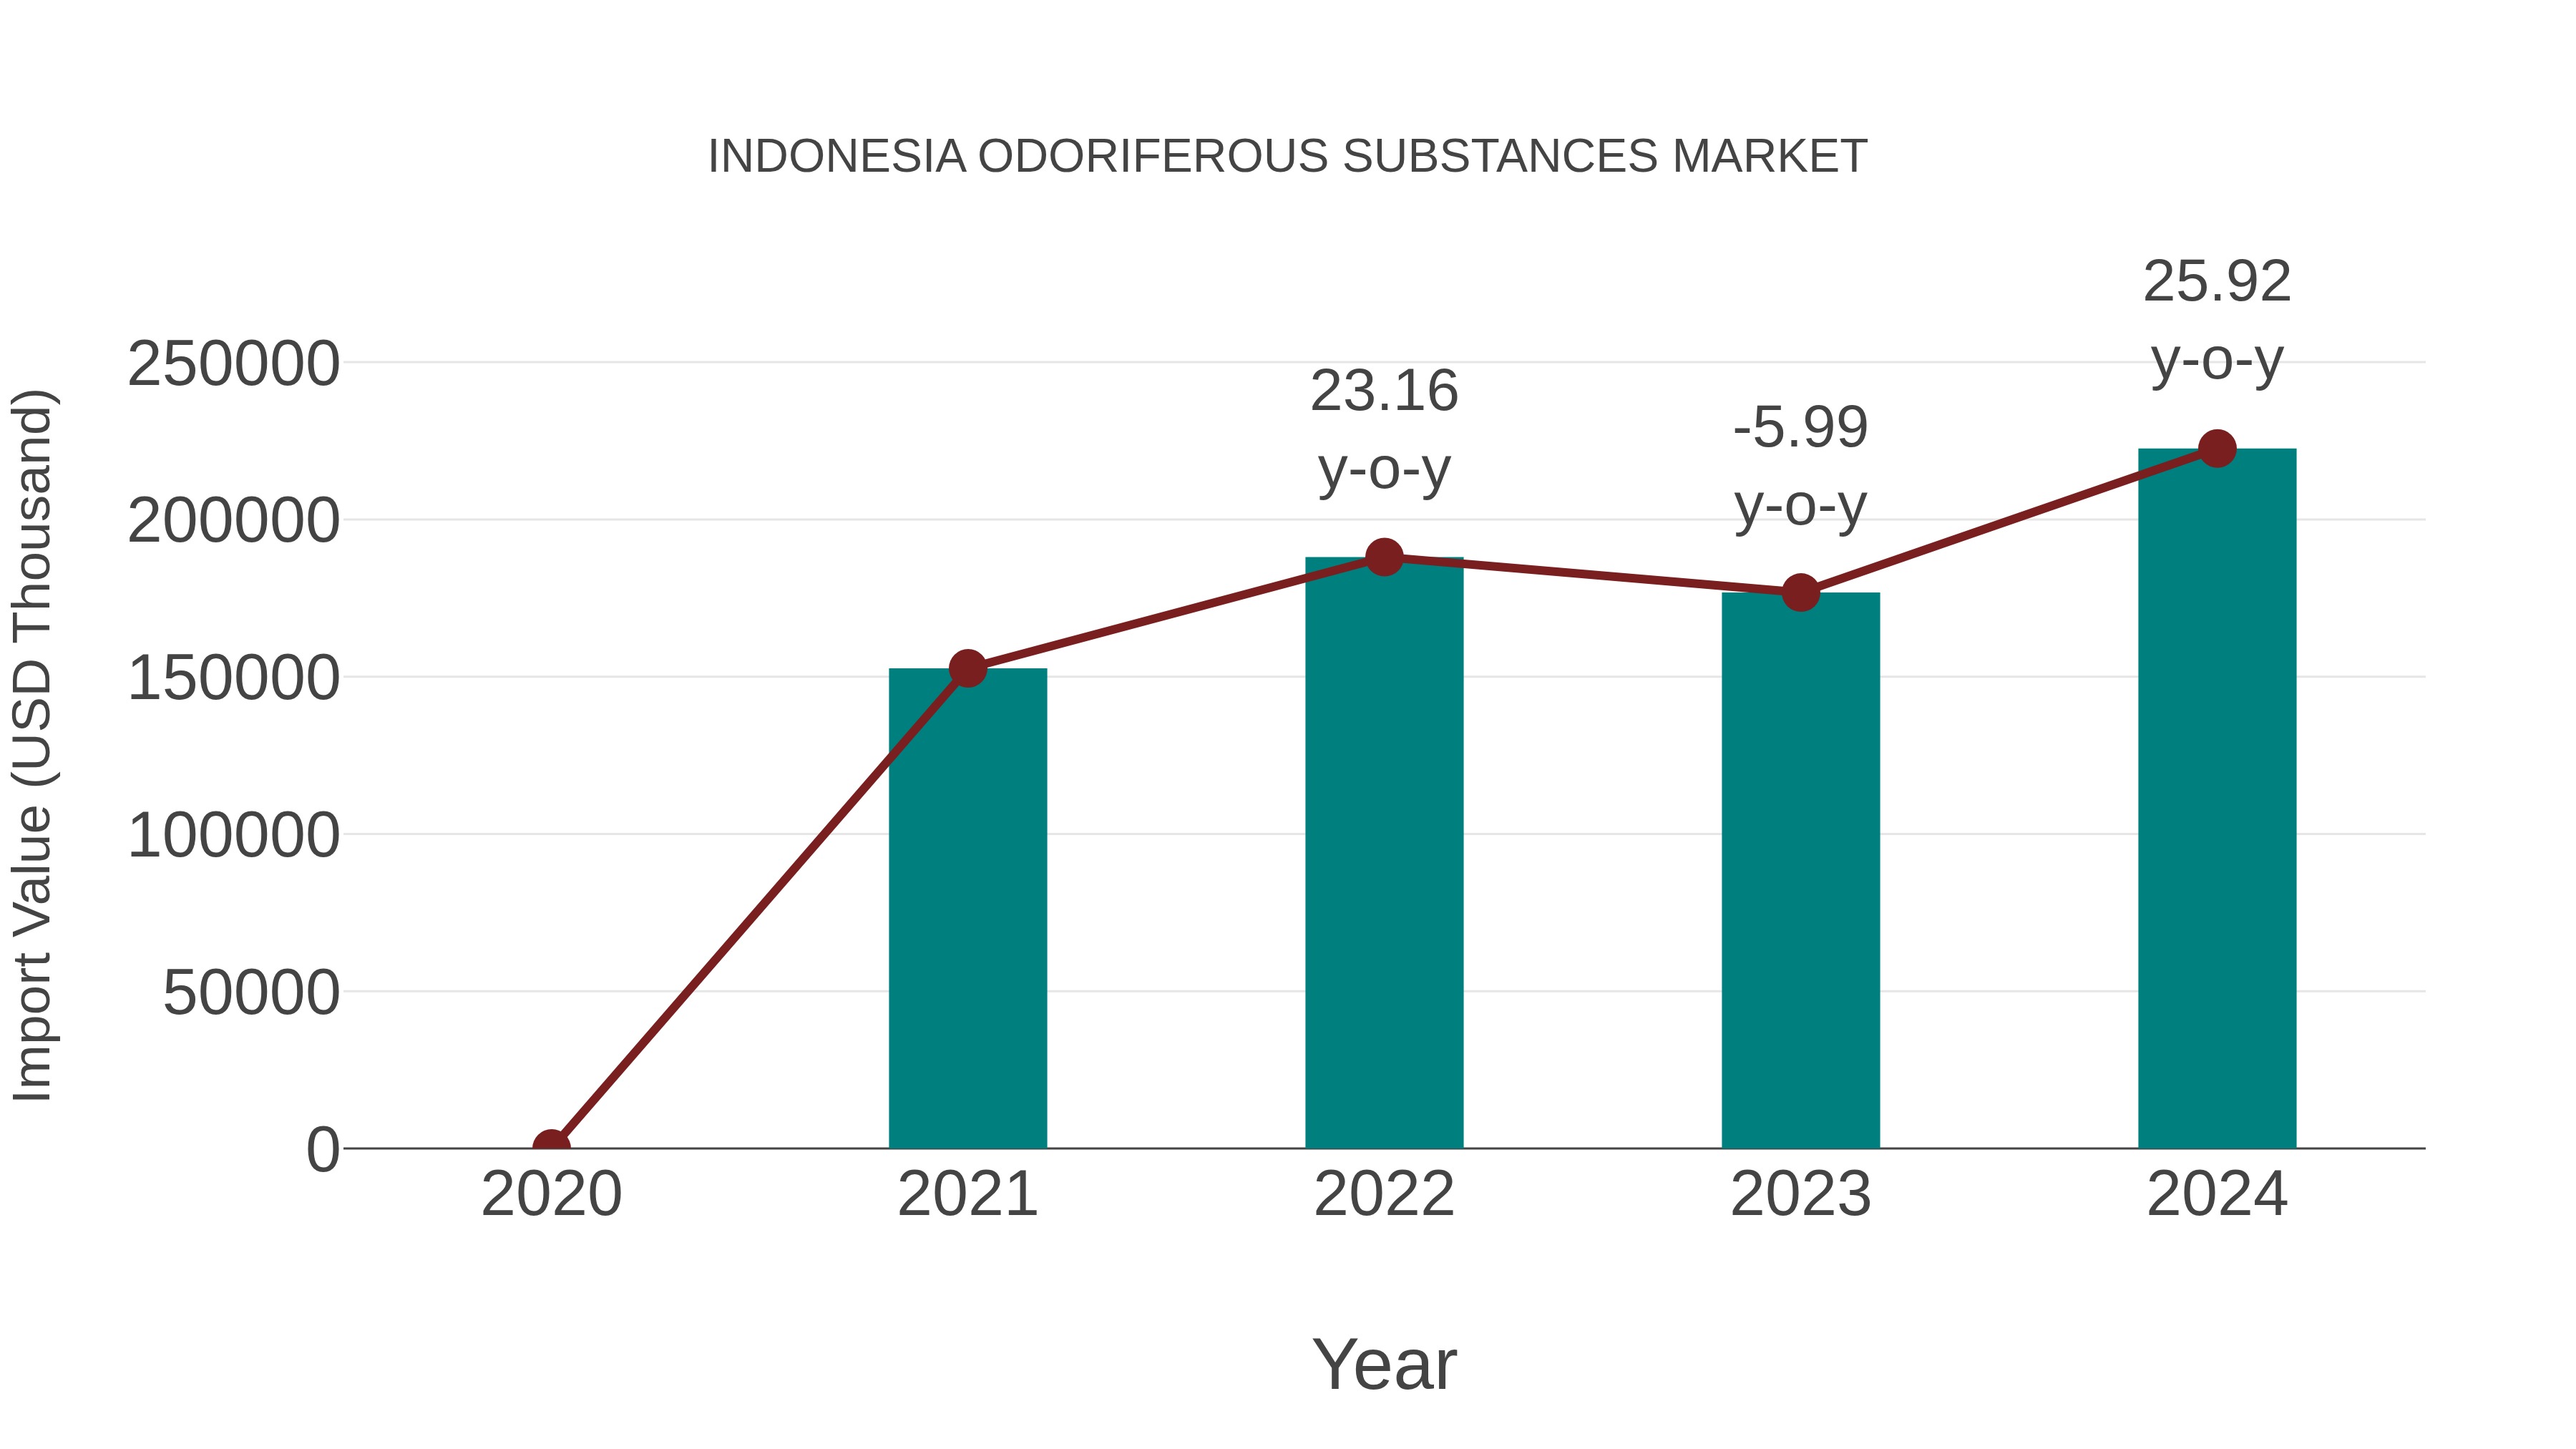
Indonesia Odoriferous Substances Market: Import Trend Analysis
In the Indonesia odoriferous substances market, the import trend showed significant growth from 2023 to 2024, with a growth rate of 25.92%. The compound annual growth rate (CAGR) for the period 2020-2024 stood at 13.39%. This uptrend can be attributed to increasing demand for high-quality fragrances and essential oils, reflecting a shift towards premium products in the market.
Indonesia Odoriferous Substances Market Synopsis
The odoriferous substances market in Indonesia encompasses a wide range of products related to fragrances and scents. This market includes perfumes, colognes, essential oils, and other aromatic products. With a growing population and an increasing interest in personal grooming and hygiene, the odoriferous substances market in Indonesia is experiencing significant growth. Local and international brands are actively participating in this market to cater to the diverse preferences of consumers.
Drivers of the Market
The odoriferous substances market in Indonesia is driven by several factors. Firstly, the growing awareness of personal hygiene and home cleanliness among the population is boosting the demand for air fresheners, perfumes, and scented products. Secondly, the increasing disposable income of the middle class in Indonesia is driving the demand for premium and long-lasting fragrances. Additionally, the tourism industry`s growth is leading to a surge in the demand for odoriferous substances in hotels, resorts, and other hospitality establishments.
Challenges of the Market
The odoriferous substances market in Indonesia faces several challenges. One of the primary concerns is the increasing environmental consciousness and regulations surrounding synthetic fragrances. This has led to a growing demand for natural and sustainable alternatives, which can be expensive to produce and source. Additionally, the market must contend with changing consumer preferences and the need for constant innovation to create unique and appealing scents. Supply chain disruptions and fluctuations in raw material prices can also impact the industry`s profitability and stability.
COVID-19 Impact on the Market
The market for odoriferous substances, including essential oils and fragrances, experienced fluctuations during the pandemic. Consumer preferences shifted towards home fragrances and personal care products, but supply chain disruptions posed challenges to the industry.
Key Players in the Market
In the Indonesia odoriferous substances market, key players are continually innovating to cater to the diverse olfactory preferences of consumers. Established fragrance manufacturers such as PT Sensient Technologies Indonesia and PT Givaudan Indonesia dominate this sector, offering an array of scents for various consumer products, including perfumes, air fresheners, and household cleaning products.
Key Highlights of the Report:
- Indonesia Odoriferous Substances Market Outlook
- Market Size of Indonesia Odoriferous Substances Market, 2025
- Forecast of Indonesia Odoriferous Substances Market, 2032
- Historical Data and Forecast of Indonesia Odoriferous Substances Revenues & Volume for the Period 2022-2032F
- Indonesia Odoriferous Substances Market Trend Evolution
- Indonesia Odoriferous Substances Market Drivers and Challenges
- Indonesia Odoriferous Substances Price Trends
- Indonesia Odoriferous Substances Porter's Five Forces
- Indonesia Odoriferous Substances Industry Life Cycle
- Historical Data and Forecast of Indonesia Odoriferous Substances Market Revenues & Volume By End User for the Period 2022-2032F
- Historical Data and Forecast of Indonesia Odoriferous Substances Market Revenues & Volume By Soap and Ointments for the Period 2022-2032F
- Historical Data and Forecast of Indonesia Odoriferous Substances Market Revenues & Volume By Pharmaceuticals for the Period 2022-2032F
- Historical Data and Forecast of Indonesia Odoriferous Substances Market Revenues & Volume By Others for the Period 2022-2032F
- Indonesia Odoriferous Substances Import Export Trade Statistics
- Market Opportunity Assessment By End User
- Indonesia Odoriferous Substances Top Companies Market Share
- Indonesia Odoriferous Substances Competitive Benchmarking By Technical and Operational Parameters
- Indonesia Odoriferous Substances Company Profiles
- Indonesia Odoriferous Substances Key Strategic Recommendations
Indonesia Odoriferous Substances Market (2026-2032): FAQs
6Wresearch actively monitors the Indonesia Odoriferous Substances Market and publishes its comprehensive annual report, highlighting emerging trends, growth drivers, revenue analysis, and forecast outlook. Our insights help businesses to make data-backed strategic decisions with ongoing market dynamics. Our analysts track relevent industries related to the Indonesia Odoriferous Substances Market, allowing our clients with actionable intelligence and reliable forecasts tailored to emerging regional needs.
Yes, we provide customisation as per your requirements. To learn more, feel free to contact us on sales@6wresearch.com
1 Executive Summary |
2 Introduction |
2.1 Key Highlights of the Report |
2.2 Report Description |
2.3 Market Scope & Segmentation |
2.4 Research Methodology |
2.5 Assumptions |
3 Indonesia Odoriferous Substances Market Overview |
3.1 Indonesia Country Macro Economic Indicators |
3.2 Indonesia Odoriferous Substances Market Revenues & Volume, 2022 & 2032F |
3.3 Indonesia Odoriferous Substances Market - Industry Life Cycle |
3.4 Indonesia Odoriferous Substances Market - Porter's Five Forces |
3.5 Indonesia Odoriferous Substances Market Revenues & Volume Share, By End User, 2022 & 2032F |
4 Indonesia Odoriferous Substances Market Dynamics |
4.1 Impact Analysis |
4.2 Market Drivers |
4.2.1 Increasing disposable income of consumers in Indonesia leading to higher spending on odoriferous substances. |
4.2.2 Growing awareness about personal grooming and hygiene among Indonesian consumers. |
4.2.3 Rising demand for natural and organic odoriferous substances due to health and environmental concerns. |
4.3 Market Restraints |
4.3.1 High import taxes and duties on odoriferous substances affecting their affordability in the Indonesian market. |
4.3.2 Presence of counterfeit and low-quality odoriferous substances impacting consumer trust and market growth. |
4.3.3 Regulations and restrictions on certain ingredients used in odoriferous substances affecting product availability and innovation. |
5 Indonesia Odoriferous Substances Market Trends |
6 Indonesia Odoriferous Substances Market, By Types |
6.1 Indonesia Odoriferous Substances Market, By End User |
6.1.1 Overview and Analysis |
6.1.2 Indonesia Odoriferous Substances Market Revenues & Volume, By End User, 2022-2032F |
6.1.3 Indonesia Odoriferous Substances Market Revenues & Volume, By Soap and Ointments, 2022-2032F |
6.1.4 Indonesia Odoriferous Substances Market Revenues & Volume, By Pharmaceuticals, 2022-2032F |
6.1.5 Indonesia Odoriferous Substances Market Revenues & Volume, By Others, 2022-2032F |
7 Indonesia Odoriferous Substances Market Import-Export Trade Statistics |
7.1 Indonesia Odoriferous Substances Market Export to Major Countries |
7.2 Indonesia Odoriferous Substances Market Imports from Major Countries |
8 Indonesia Odoriferous Substances Market Key Performance Indicators |
8.1 Consumer engagement with online marketing campaigns for odoriferous substances. |
8.2 Number of new product launches in the odoriferous substances market. |
8.3 Growth in the number of specialty stores or boutiques exclusively selling odoriferous substances. |
9 Indonesia Odoriferous Substances Market - Opportunity Assessment |
9.1 Indonesia Odoriferous Substances Market Opportunity Assessment, By End User, 2022 & 2032F |
10 Indonesia Odoriferous Substances Market - Competitive Landscape |
10.1 Indonesia Odoriferous Substances Market Revenue Share, By Companies, 2025 |
10.2 Indonesia Odoriferous Substances Market Competitive Benchmarking, By Operating and Technical Parameters |
11 Company Profiles |
12 Recommendations |
13 Disclaimer |
Export potential assessment - trade Analytics for 2030
Export potential enables firms to identify high-growth global markets with greater confidence by combining advanced trade intelligence with a structured quantitative methodology. The framework analyzes emerging demand trends and country-level import patterns while integrating macroeconomic and trade datasets such as GDP and population forecasts, bilateral import–export flows, tariff structures, elasticity differentials between developed and developing economies, geographic distance, and import demand projections. Using weighted trade values from 2020–2024 as the base period to project country-to-country export potential for 2030, these inputs are operationalized through calculated drivers such as gravity model parameters, tariff impact factors, and projected GDP per-capita growth. Through an analysis of hidden potentials, demand hotspots, and market conditions that are most favorable to success, this method enables firms to focus on target countries, maximize returns, and global expansion with data, backed by accuracy.
By factoring in the projected importer demand gap that is currently unmet and could be potential opportunity, it identifies the potential for the Exporter (Country) among 190 countries, against the general trade analysis, which identifies the biggest importer or exporter.
To discover high-growth global markets and optimize your business strategy:
Click Here
Pricing
- Single User License$ 1,995
- Department License$ 2,400
- Site License$ 3,120
- Global License$ 3,795

Search
Thought Leadership and Analyst Meet


Our Clients
Latest Reports
- China Electric Appliance Rental Market (2026-2032) | Trends, Revenue, Growth, Challenges, Size, Value, Outlook, Pricing, Strategy, Insights, Restraints, segmentation, Companies, Investment Opportunities, Analysis, Demand, Drivers, Competition, Forecast, Share
- Chile Electric Appliance Rental Market (2026-2032) | Outlook, Competition, Drivers, Strategy, Revenue, Analysis, Value, Pricing, Restraints, Size, Demand, Share, Growth, Forecast, Challenges, Insights, Investment Opportunities, Companies, Trends, segmentation
- Cambodia Electric Appliance Rental Market (2026-2032) | Companies, Analysis, Restraints, Pricing, Insights, Challenges, Outlook, Strategy, Forecast, Trends, Competition, Value, Revenue, Investment Opportunities, segmentation, Drivers, Size, Demand, Growth, Share
- Brazil Electric Appliance Rental Market (2026-2032) | Revenue, Strategy, Forecast, Companies, segmentation, Competition, Size, Investment Opportunities, Pricing, Restraints, Outlook, Challenges, Analysis, Drivers, Value, Demand, Insights, Trends, Growth, Share
- Bangladesh Electric Appliance Rental Market (2026-2032) | Drivers, Forecast, Investment Opportunities, Strategy, Insights, Demand, Challenges, Outlook, Trends, Competition, Value, Revenue, Size, Pricing, Analysis, Companies, Restraints, segmentation, Share, Growth
- Bahrain Electric Appliance Rental Market (2026-2032) | Outlook, Size, Competition, Restraints, Drivers, Value, Trends, Investment Opportunities, Insights, Forecast, Revenue, Strategy, Growth, Share, Demand, Analysis, Challenges, Companies, segmentation, Pricing
- Azerbaijan Electric Appliance Rental Market (2026-2032) | Trends, Investment Opportunities, Restraints, Insights, Strategy, Competition, Value, Growth, Demand, Drivers, Analysis, Forecast, Size, Share, Outlook, segmentation, Pricing, Challenges, Revenue, Companies
- Australia Electric Appliance Rental Market (2026-2032) | Challenges, Restraints, Forecast, Demand, Size, Competition, Pricing, Investment Opportunities, Revenue, Trends, Drivers, Growth, Outlook, Analysis, Strategy, Value, segmentation, Insights, Companies, Share
- Argentina Electric Appliance Rental Market (2026-2032) | Growth, Trends, Insights, Outlook, Forecast, Size, Drivers, Analysis, Restraints, Challenges, Share, Revenue, Investment Opportunities, Strategy, Demand, Value, Companies, segmentation, Competition, Pricing
- Algeria Electric Appliance Rental Market (2026-2032) | Share, Size, Value, Strategy, Competition, Outlook, Challenges, Companies, Trends, Pricing, Insights, Forecast, Investment Opportunities, Revenue, Growth, Restraints, segmentation, Analysis, Demand, Drivers
Industry Events and Analyst Meet

HIMTEX 2026

India Refining Summit 2026

India EV Show 2026

EV tech India Expo 2026

Auto Tech Asia 2026
Whitepaper
- Middle East & Africa Commercial Security Market Click here to view more.
- Middle East & Africa Fire Safety Systems & Equipment Market Click here to view more.
- GCC Drone Market Click here to view more.
- Middle East Lighting Fixture Market Click here to view more.
- GCC Physical & Perimeter Security Market Click here to view more.
6WResearch In News
- Doha a strategic location for EV manufacturing hub: IPA Qatar
- Demand for luxury TVs surging in the GCC, says Samsung
- Empowering Growth: The Thriving Journey of Bangladesh’s Cable Industry
- Demand for luxury TVs surging in the GCC, says Samsung
- Video call with a traditional healer? Once unthinkable, it’s now common in South Africa
- Intelligent Buildings To Smooth GCC’s Path To Net Zero