Indonesia Passive Optical Components Market (2026-2032) | Outlook, Forecast, Analysis, Trends, Drivers, Growth, Companies, Share, Size, Revenue, Demand, Strategy, Industry, Consumer Insights, Competitive, Strategic Insights, Competition, Segmentation, Pricing Analysis, Segments, Opportunities, Challenges, Value, Supply, Restraints, Investment Trends
Market Forecast By Component Type (Optical Filters, Splitters, Couplers, Wavelength Selective Switches, Optical Isolators), By Material (Glass, Silicon, Plastic, Quartz, Polymer), By Application (Data Centers, Fiber Optic Communications, Industrial Networks, Medical Imaging, Military & Defense), By End User (IT & Telecom, Aerospace, Healthcare, Manufacturing, Consumer Electronics), By Network Type (FTTx, Passive Optical LAN, Enterprise Networks, Metro Networks, Long-Haul Networks) And Competitive Landscape
| Product Code: ETC10740943 | Publication Date: Apr 2025 | Updated Date: Mar 2026 | Product Type: Market Research Report | |
| Publisher: 6Wresearch | Author: Sumit Sagar | No. of Pages: 65 | No. of Figures: 34 | No. of Tables: 19 |
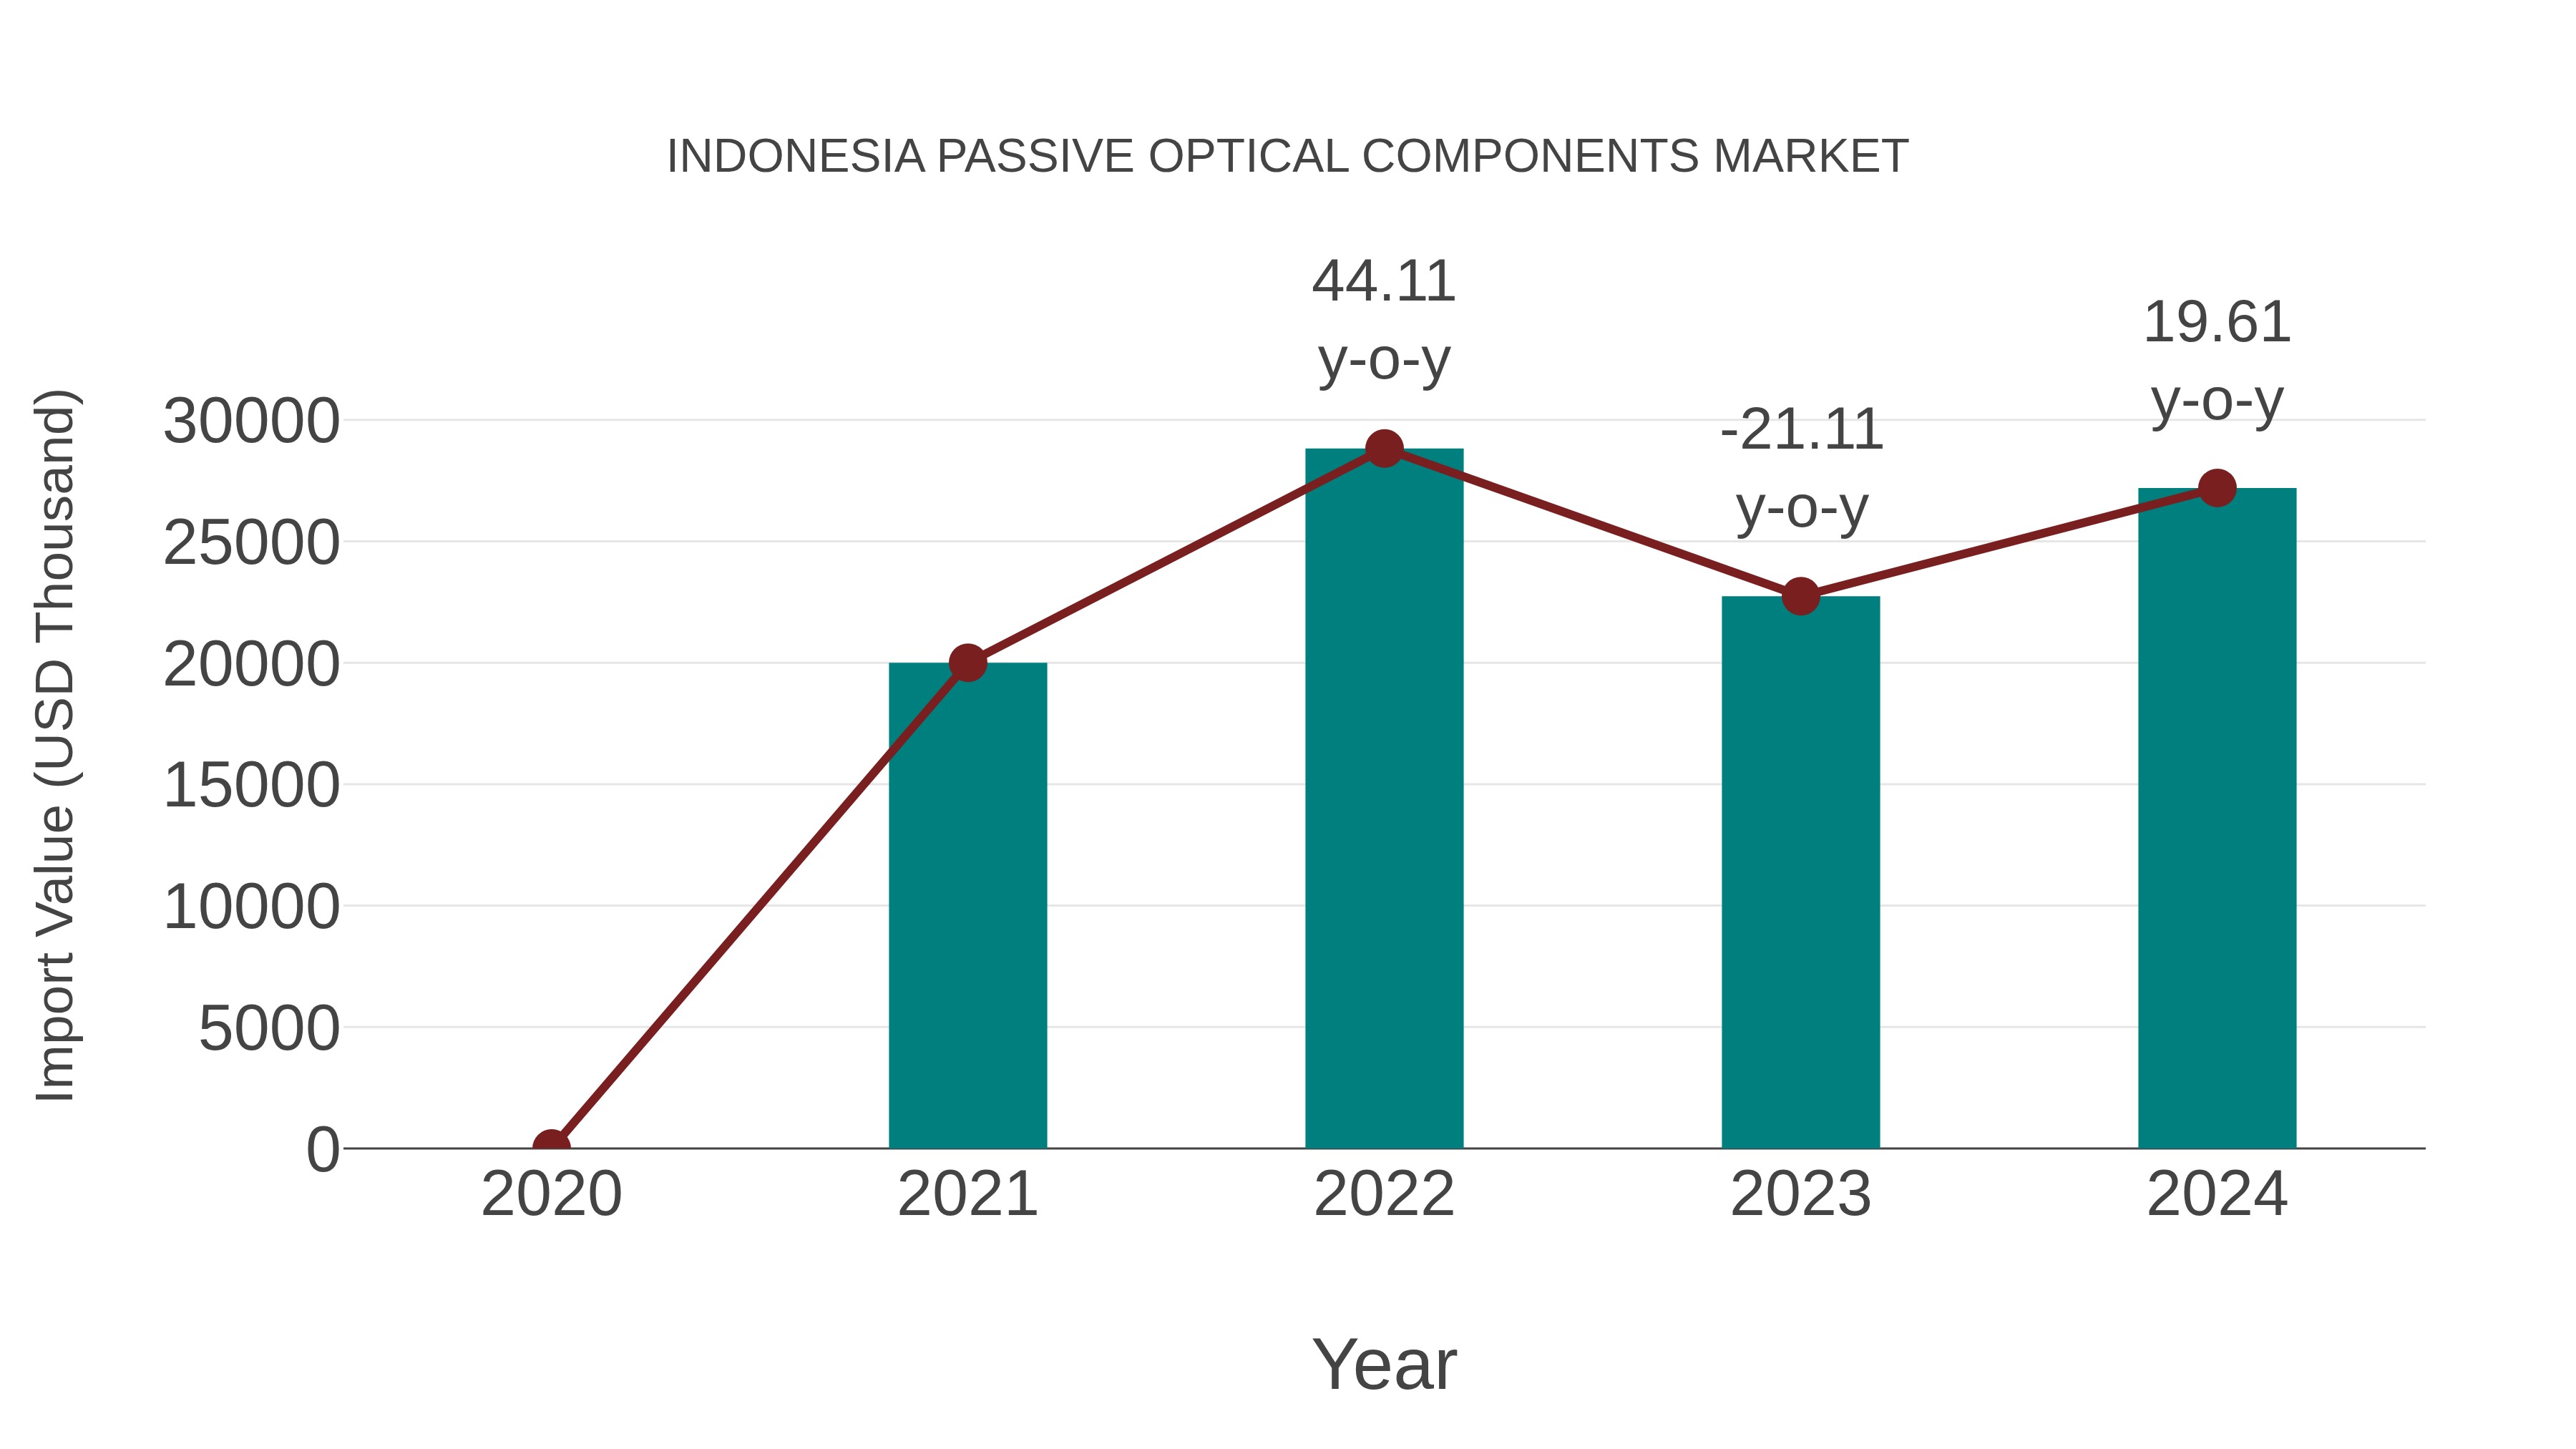
Indonesia Passive Optical Components Market: Import Trend Analysis
Indonesia`s import trend for passive optical components in the Indonesia market showed significant growth from 2023 to 2024, with a growth rate of 19.61%. The compound annual growth rate (CAGR) for the period of 2020 to 2024 stood at 10.79%. This substantial increase in imports can be attributed to a surge in demand for advanced optical technologies and a favorable trade environment that supported market stability during this period.
Indonesia Passive Optical Components Market Market Overview
The Indonesia passive optical components market is experiencing growth driven by the increasing demand for high-speed internet services, expanding telecommunications infrastructure, and the adoption of fiber optic technology in various industries. The market is characterized by a wide range of components such as optical fibers, connectors, splitters, couplers, and filters, among others. Key factors contributing to market growth include the government`s initiatives to improve broadband infrastructure, the rise in data traffic due to the growing digital economy, and the need for efficient network solutions. Major players operating in the market are focusing on product innovation, strategic partnerships, and mergers to gain a competitive edge. With the continuous expansion of telecommunication networks and the increasing penetration of fiber optics, the Indonesia passive optical components market is expected to witness steady growth in the coming years.
Indonesia Passive Optical Components Market Trends
The passive optical components market in Indonesia is experiencing growth due to the increasing demand for high-speed internet and the expansion of telecommunication networks. Key trends include the adoption of fiber-to-the-home (FTTH) technology to support high-bandwidth applications, such as video streaming and online gaming. The market is also seeing a rise in the deployment of passive optical splitters and couplers for efficient network connectivity. Additionally, there is a growing focus on improving the quality and reliability of passive optical components to meet the evolving needs of the telecommunications sector. Overall, the Indonesia passive optical components market is poised for continued expansion driven by the country`s digital transformation initiatives and the rising consumer demand for faster and more reliable connectivity solutions.
Indonesia Passive Optical Components Market Challenges
In the Indonesia passive optical components market, challenges revolve around the rapid technological advancements and the need for infrastructure development to support high-speed data transmission. The market faces constraints related to the deployment of fiber optics networks in remote and rural areas, where connectivity infrastructure is limited. Additionally, the cost of implementing fiber optic networks, training skilled personnel, and ensuring regulatory compliance pose challenges for market players. Moreover, competition from alternative technologies like wireless communication and the need for continuous innovation to meet evolving consumer demands further add complexity to the market landscape. Overall, navigating these challenges requires a strategic approach to address the unique market dynamics and capitalize on growth opportunities in the Indonesia passive optical components market.
Indonesia Passive Optical Components Market Investment Opportunities
The Indonesia passive optical components market presents promising investment opportunities due to the increasing demand for high-speed internet services, driven by the growing digitalization trends in the country. With the government`s initiatives to expand broadband infrastructure and improve connectivity, there is a rising need for advanced passive optical components such as splitters, couplers, and connectors. Investing in companies that manufacture or distribute these components can be lucrative in the Indonesian market. Additionally, the shift towards 5G technology and the deployment of fiber-to-the-home (FTTH) networks further boost the demand for passive optical components, making it a strategically sound investment choice for those looking to capitalize on the country`s evolving telecommunications landscape.
Indonesia Passive Optical Components Market Government Policy
In Indonesia, the government has implemented various policies to support the passive optical components market, which includes components like fiber optic cables, connectors, splitters, and couplers. One of the key policies is the Masterplan for the Acceleration and Expansion of Indonesia`s Economic Development (MP3EI), which aims to develop the country`s telecommunications infrastructure, including the expansion of broadband networks. Additionally, the government has introduced initiatives to promote the adoption of fiber optics in both urban and rural areas to improve internet connectivity and support digital transformation efforts. These policies are aligned with Indonesia`s broader goals of advancing its digital economy and enhancing its competitiveness in the global market, creating opportunities for growth in the passive optical components sector.
Indonesia Passive Optical Components Market Future Outlook
The Indonesia passive optical components market is expected to witness significant growth in the coming years due to the increasing demand for high-speed internet connectivity, rise in adoption of data centers, and growing investments in telecommunications infrastructure. The market is projected to be driven by factors such as the expansion of fiber optic networks, advancements in technology, and the push towards digital transformation. Additionally, the government`s initiatives to improve broadband infrastructure and the increasing use of fiber optics in various industries are anticipated to further fuel market growth. With the rise in demand for higher bandwidth and faster data transmission, the Indonesia passive optical components market is likely to experience steady growth and present lucrative opportunities for market players in the foreseeable future.
Key Highlights of the Report:
- Indonesia Passive Optical Components Market Outlook
- Market Size of Indonesia Passive Optical Components Market,2025
- Forecast of Indonesia Passive Optical Components Market, 2032
- Historical Data and Forecast of Indonesia Passive Optical Components Revenues & Volume for the Period 2022-2032F
- Indonesia Passive Optical Components Market Trend Evolution
- Indonesia Passive Optical Components Market Drivers and Challenges
- Indonesia Passive Optical Components Price Trends
- Indonesia Passive Optical Components Porter's Five Forces
- Indonesia Passive Optical Components Industry Life Cycle
- Historical Data and Forecast of Indonesia Passive Optical Components Market Revenues & Volume By Component Type for the Period 2022-2032F
- Historical Data and Forecast of Indonesia Passive Optical Components Market Revenues & Volume By Optical Filters for the Period 2022-2032F
- Historical Data and Forecast of Indonesia Passive Optical Components Market Revenues & Volume By Splitters for the Period 2022-2032F
- Historical Data and Forecast of Indonesia Passive Optical Components Market Revenues & Volume By Couplers for the Period 2022-2032F
- Historical Data and Forecast of Indonesia Passive Optical Components Market Revenues & Volume By Wavelength Selective Switches for the Period 2022-2032F
- Historical Data and Forecast of Indonesia Passive Optical Components Market Revenues & Volume By Optical Isolators for the Period 2022-2032F
- Historical Data and Forecast of Indonesia Passive Optical Components Market Revenues & Volume By Material for the Period 2022-2032F
- Historical Data and Forecast of Indonesia Passive Optical Components Market Revenues & Volume By Glass for the Period 2022-2032F
- Historical Data and Forecast of Indonesia Passive Optical Components Market Revenues & Volume By Silicon for the Period 2022-2032F
- Historical Data and Forecast of Indonesia Passive Optical Components Market Revenues & Volume By Plastic for the Period 2022-2032F
- Historical Data and Forecast of Indonesia Passive Optical Components Market Revenues & Volume By Quartz for the Period 2022-2032F
- Historical Data and Forecast of Indonesia Passive Optical Components Market Revenues & Volume By Polymer for the Period 2022-2032F
- Historical Data and Forecast of Indonesia Passive Optical Components Market Revenues & Volume By Application for the Period 2022-2032F
- Historical Data and Forecast of Indonesia Passive Optical Components Market Revenues & Volume By Data Centers for the Period 2022-2032F
- Historical Data and Forecast of Indonesia Passive Optical Components Market Revenues & Volume By Fiber Optic Communications for the Period 2022-2032F
- Historical Data and Forecast of Indonesia Passive Optical Components Market Revenues & Volume By Industrial Networks for the Period 2022-2032F
- Historical Data and Forecast of Indonesia Passive Optical Components Market Revenues & Volume By Medical Imaging for the Period 2022-2032F
- Historical Data and Forecast of Indonesia Passive Optical Components Market Revenues & Volume By Military & Defense for the Period 2022-2032F
- Historical Data and Forecast of Indonesia Passive Optical Components Market Revenues & Volume By End User for the Period 2022-2032F
- Historical Data and Forecast of Indonesia Passive Optical Components Market Revenues & Volume By IT & Telecom for the Period 2022-2032F
- Historical Data and Forecast of Indonesia Passive Optical Components Market Revenues & Volume By Aerospace for the Period 2022-2032F
- Historical Data and Forecast of Indonesia Passive Optical Components Market Revenues & Volume By Healthcare for the Period 2022-2032F
- Historical Data and Forecast of Indonesia Passive Optical Components Market Revenues & Volume By Manufacturing for the Period 2022-2032F
- Historical Data and Forecast of Indonesia Passive Optical Components Market Revenues & Volume By Consumer Electronics for the Period 2022-2032F
- Historical Data and Forecast of Indonesia Passive Optical Components Market Revenues & Volume By Network Type for the Period 2022-2032F
- Historical Data and Forecast of Indonesia Passive Optical Components Market Revenues & Volume By FTTx for the Period 2022-2032F
- Historical Data and Forecast of Indonesia Passive Optical Components Market Revenues & Volume By Passive Optical LAN for the Period 2022-2032F
- Historical Data and Forecast of Indonesia Passive Optical Components Market Revenues & Volume By Enterprise Networks for the Period 2022-2032F
- Historical Data and Forecast of Indonesia Passive Optical Components Market Revenues & Volume By Metro Networks for the Period 2022-2032F
- Historical Data and Forecast of Indonesia Passive Optical Components Market Revenues & Volume By Long-Haul Networks for the Period 2022-2032F
- Indonesia Passive Optical Components Import Export Trade Statistics
- Market Opportunity Assessment By Component Type
- Market Opportunity Assessment By Material
- Market Opportunity Assessment By Application
- Market Opportunity Assessment By End User
- Market Opportunity Assessment By Network Type
- Indonesia Passive Optical Components Top Companies Market Share
- Indonesia Passive Optical Components Competitive Benchmarking By Technical and Operational Parameters
- Indonesia Passive Optical Components Company Profiles
- Indonesia Passive Optical Components Key Strategic Recommendations
Indonesia Passive Optical Components Market (2026-2032): FAQs
6Wresearch actively monitors the Indonesia Passive Optical Components Market and publishes its comprehensive annual report, highlighting emerging trends, growth drivers, revenue analysis, and forecast outlook. Our insights help businesses to make data-backed strategic decisions with ongoing market dynamics. Our analysts track relevent industries related to the Indonesia Passive Optical Components Market, allowing our clients with actionable intelligence and reliable forecasts tailored to emerging regional needs.
Yes, we provide customisation as per your requirements. To learn more, feel free to contact us on sales@6wresearch.com
1 Executive Summary |
2 Introduction |
2.1 Key Highlights of the Report |
2.2 Report Description |
2.3 Market Scope & Segmentation |
2.4 Research Methodology |
2.5 Assumptions |
3 Indonesia Passive Optical Components Market Overview |
3.1 Indonesia Country Macro Economic Indicators |
3.2 Indonesia Passive Optical Components Market Revenues & Volume, 2022 & 2032F |
3.3 Indonesia Passive Optical Components Market - Industry Life Cycle |
3.4 Indonesia Passive Optical Components Market - Porter's Five Forces |
3.5 Indonesia Passive Optical Components Market Revenues & Volume Share, By Component Type, 2022 & 2032F |
3.6 Indonesia Passive Optical Components Market Revenues & Volume Share, By Material, 2022 & 2032F |
3.7 Indonesia Passive Optical Components Market Revenues & Volume Share, By Application, 2022 & 2032F |
3.8 Indonesia Passive Optical Components Market Revenues & Volume Share, By End User, 2022 & 2032F |
3.9 Indonesia Passive Optical Components Market Revenues & Volume Share, By Network Type, 2022 & 2032F |
4 Indonesia Passive Optical Components Market Dynamics |
4.1 Impact Analysis |
4.2 Market Drivers |
4.2.1 Increasing demand for high-speed internet services in Indonesia |
4.2.2 Government initiatives to improve broadband infrastructure |
4.2.3 Growing adoption of cloud services and data centers in the region |
4.3 Market Restraints |
4.3.1 High initial investment costs associated with passive optical components |
4.3.2 Limited awareness and technical expertise among end-users |
4.3.3 Challenges related to the deployment and maintenance of passive optical networks |
5 Indonesia Passive Optical Components Market Trends |
6 Indonesia Passive Optical Components Market, By Types |
6.1 Indonesia Passive Optical Components Market, By Component Type |
6.1.1 Overview and Analysis |
6.1.2 Indonesia Passive Optical Components Market Revenues & Volume, By Component Type, 2022-2032F |
6.1.3 Indonesia Passive Optical Components Market Revenues & Volume, By Optical Filters, 2022-2032F |
6.1.4 Indonesia Passive Optical Components Market Revenues & Volume, By Splitters, 2022-2032F |
6.1.5 Indonesia Passive Optical Components Market Revenues & Volume, By Couplers, 2022-2032F |
6.1.6 Indonesia Passive Optical Components Market Revenues & Volume, By Wavelength Selective Switches, 2022-2032F |
6.1.7 Indonesia Passive Optical Components Market Revenues & Volume, By Optical Isolators, 2022-2032F |
6.2 Indonesia Passive Optical Components Market, By Material |
6.2.1 Overview and Analysis |
6.2.2 Indonesia Passive Optical Components Market Revenues & Volume, By Glass, 2022-2032F |
6.2.3 Indonesia Passive Optical Components Market Revenues & Volume, By Silicon, 2022-2032F |
6.2.4 Indonesia Passive Optical Components Market Revenues & Volume, By Plastic, 2022-2032F |
6.2.5 Indonesia Passive Optical Components Market Revenues & Volume, By Quartz, 2022-2032F |
6.2.6 Indonesia Passive Optical Components Market Revenues & Volume, By Polymer, 2022-2032F |
6.3 Indonesia Passive Optical Components Market, By Application |
6.3.1 Overview and Analysis |
6.3.2 Indonesia Passive Optical Components Market Revenues & Volume, By Data Centers, 2022-2032F |
6.3.3 Indonesia Passive Optical Components Market Revenues & Volume, By Fiber Optic Communications, 2022-2032F |
6.3.4 Indonesia Passive Optical Components Market Revenues & Volume, By Industrial Networks, 2022-2032F |
6.3.5 Indonesia Passive Optical Components Market Revenues & Volume, By Medical Imaging, 2022-2032F |
6.3.6 Indonesia Passive Optical Components Market Revenues & Volume, By Military & Defense, 2022-2032F |
6.4 Indonesia Passive Optical Components Market, By End User |
6.4.1 Overview and Analysis |
6.4.2 Indonesia Passive Optical Components Market Revenues & Volume, By IT & Telecom, 2022-2032F |
6.4.3 Indonesia Passive Optical Components Market Revenues & Volume, By Aerospace, 2022-2032F |
6.4.4 Indonesia Passive Optical Components Market Revenues & Volume, By Healthcare, 2022-2032F |
6.4.5 Indonesia Passive Optical Components Market Revenues & Volume, By Manufacturing, 2022-2032F |
6.4.6 Indonesia Passive Optical Components Market Revenues & Volume, By Consumer Electronics, 2022-2032F |
6.5 Indonesia Passive Optical Components Market, By Network Type |
6.5.1 Overview and Analysis |
6.5.2 Indonesia Passive Optical Components Market Revenues & Volume, By FTTx, 2022-2032F |
6.5.3 Indonesia Passive Optical Components Market Revenues & Volume, By Passive Optical LAN, 2022-2032F |
6.5.4 Indonesia Passive Optical Components Market Revenues & Volume, By Enterprise Networks, 2022-2032F |
6.5.5 Indonesia Passive Optical Components Market Revenues & Volume, By Metro Networks, 2022-2032F |
6.5.6 Indonesia Passive Optical Components Market Revenues & Volume, By Long-Haul Networks, 2022-2032F |
7 Indonesia Passive Optical Components Market Import-Export Trade Statistics |
7.1 Indonesia Passive Optical Components Market Export to Major Countries |
7.2 Indonesia Passive Optical Components Market Imports from Major Countries |
8 Indonesia Passive Optical Components Market Key Performance Indicators |
8.1 Average revenue per user (ARPU) for broadband services |
8.2 Number of households/businesses with access to high-speed internet |
8.3 Percentage of IT budgets allocated to cloud services and data centers |
8.4 Adoption rate of fiber-to-the-home (FTTH) technology |
8.5 Average network uptime and reliability levels |
9 Indonesia Passive Optical Components Market - Opportunity Assessment |
9.1 Indonesia Passive Optical Components Market Opportunity Assessment, By Component Type, 2022 & 2032F |
9.2 Indonesia Passive Optical Components Market Opportunity Assessment, By Material, 2022 & 2032F |
9.3 Indonesia Passive Optical Components Market Opportunity Assessment, By Application, 2022 & 2032F |
9.4 Indonesia Passive Optical Components Market Opportunity Assessment, By End User, 2022 & 2032F |
9.5 Indonesia Passive Optical Components Market Opportunity Assessment, By Network Type, 2022 & 2032F |
10 Indonesia Passive Optical Components Market - Competitive Landscape |
10.1 Indonesia Passive Optical Components Market Revenue Share, By Companies, 2025 |
10.2 Indonesia Passive Optical Components Market Competitive Benchmarking, By Operating and Technical Parameters |
11 Company Profiles |
12 Recommendations |
13 Disclaimer |
Global Go To Market Strategy - 2030
Export potential enables firms to identify high-growth global markets with greater confidence by combining advanced trade intelligence with a structured quantitative methodology. The framework analyzes emerging demand trends and country-level import patterns while integrating macroeconomic and trade datasets such as GDP and population forecasts, bilateral import–export flows, tariff structures, elasticity differentials between developed and developing economies, geographic distance, and import demand projections. Using weighted trade values from 2020–2024 as the base period to project country-to-country export potential for 2030, these inputs are operationalized through calculated drivers such as gravity model parameters, tariff impact factors, and projected GDP per-capita growth. Through an analysis of hidden potentials, demand hotspots, and market conditions that are most favorable to success, this method enables firms to focus on target countries, maximize returns, and global expansion with data, backed by accuracy.
By factoring in the projected importer demand gap that is currently unmet and could be potential opportunity, it identifies the potential for the Exporter (Country) among 190 countries, against the general trade analysis, which identifies the biggest importer or exporter.
To discover high-growth global markets and optimize your business strategy:
Click Here
Pricing
- Single User License$ 1,995
- Department License$ 2,400
- Site License$ 3,120
- Global License$ 3,795

Leadership Perspectives from Industry Events
Search
Thought Leadership and Analyst Meet


Our Clients
6WResearch In News
- Doha a strategic location for EV manufacturing hub: IPA Qatar
- Demand for luxury TVs surging in the GCC, says Samsung
- Empowering Growth: The Thriving Journey of Bangladesh’s Cable Industry
- Demand for luxury TVs surging in the GCC, says Samsung
- Video call with a traditional healer? Once unthinkable, it’s now common in South Africa
- Intelligent Buildings To Smooth GCC’s Path To Net Zero
Latest Reports
- Cape Verde Portable Hand-Thrown Extinguisher Market (2026-2032)
- Canada Portable Hand-Thrown Extinguisher Market (2026-2032)
- Cameroon Portable Hand-Thrown Extinguisher Market (2026-2032)
- Burundi Portable Hand-Thrown Extinguisher Market (2026-2032)
- Burkina Faso Portable Hand-Thrown Extinguisher Market (2026-2032)
- Bulgaria Portable Hand-Thrown Extinguisher Market (2026-2032)
- Brunei Portable Hand-Thrown Extinguisher Market (2026-2032)
- Botswana Portable Hand-Thrown Extinguisher Market (2026-2032)
- Bosnia and Herzegovina Portable Hand-Thrown Extinguisher Market (2026-2032)
- Bolivia Portable Hand-Thrown Extinguisher Market (2026-2032)
Industry Events and Analyst Meet

HIMTEX 2026

India Refining Summit 2026

India EV Show 2026

EV tech India Expo 2026

Auto Tech Asia 2026
Whitepaper
- Middle East & Africa Commercial Security Market Click here to view more.
- Middle East & Africa Fire Safety Systems & Equipment Market Click here to view more.
- GCC Drone Market Click here to view more.
- Middle East Lighting Fixture Market Click here to view more.
- GCC Physical & Perimeter Security Market Click here to view more.