Indonesia Polymides Market (2026-2032) Outlook | Companies, Value, Revenue, Analysis, Growth, Industry, Trends, Size, Share & Forecast
Market Forecast By Types (PA 6, PA 66, Bio Polyamides & Specialty Polyamides), By Class (Aliphatic Polyamides, Semi-Aromatic & Aromatic Polyamides), By Application (Fibers, Wire & Cables, 3D Printing, Sports Equipment, Engine Components, Brakes & Transmission Parts, Household Goods & Appliances), By End-use (Automotive, Electrical & Electronics, Textile, Aerospace & Defense, Packaging, Consumer Goods) And Competitive Landscape
| Product Code: ETC107207 | Publication Date: Jul 2023 | Updated Date: Mar 2026 | Product Type: Report | |
| Publisher: 6Wresearch | Author: Ravi Bhandari | No. of Pages: 70 | No. of Figures: 35 | No. of Tables: 5 |
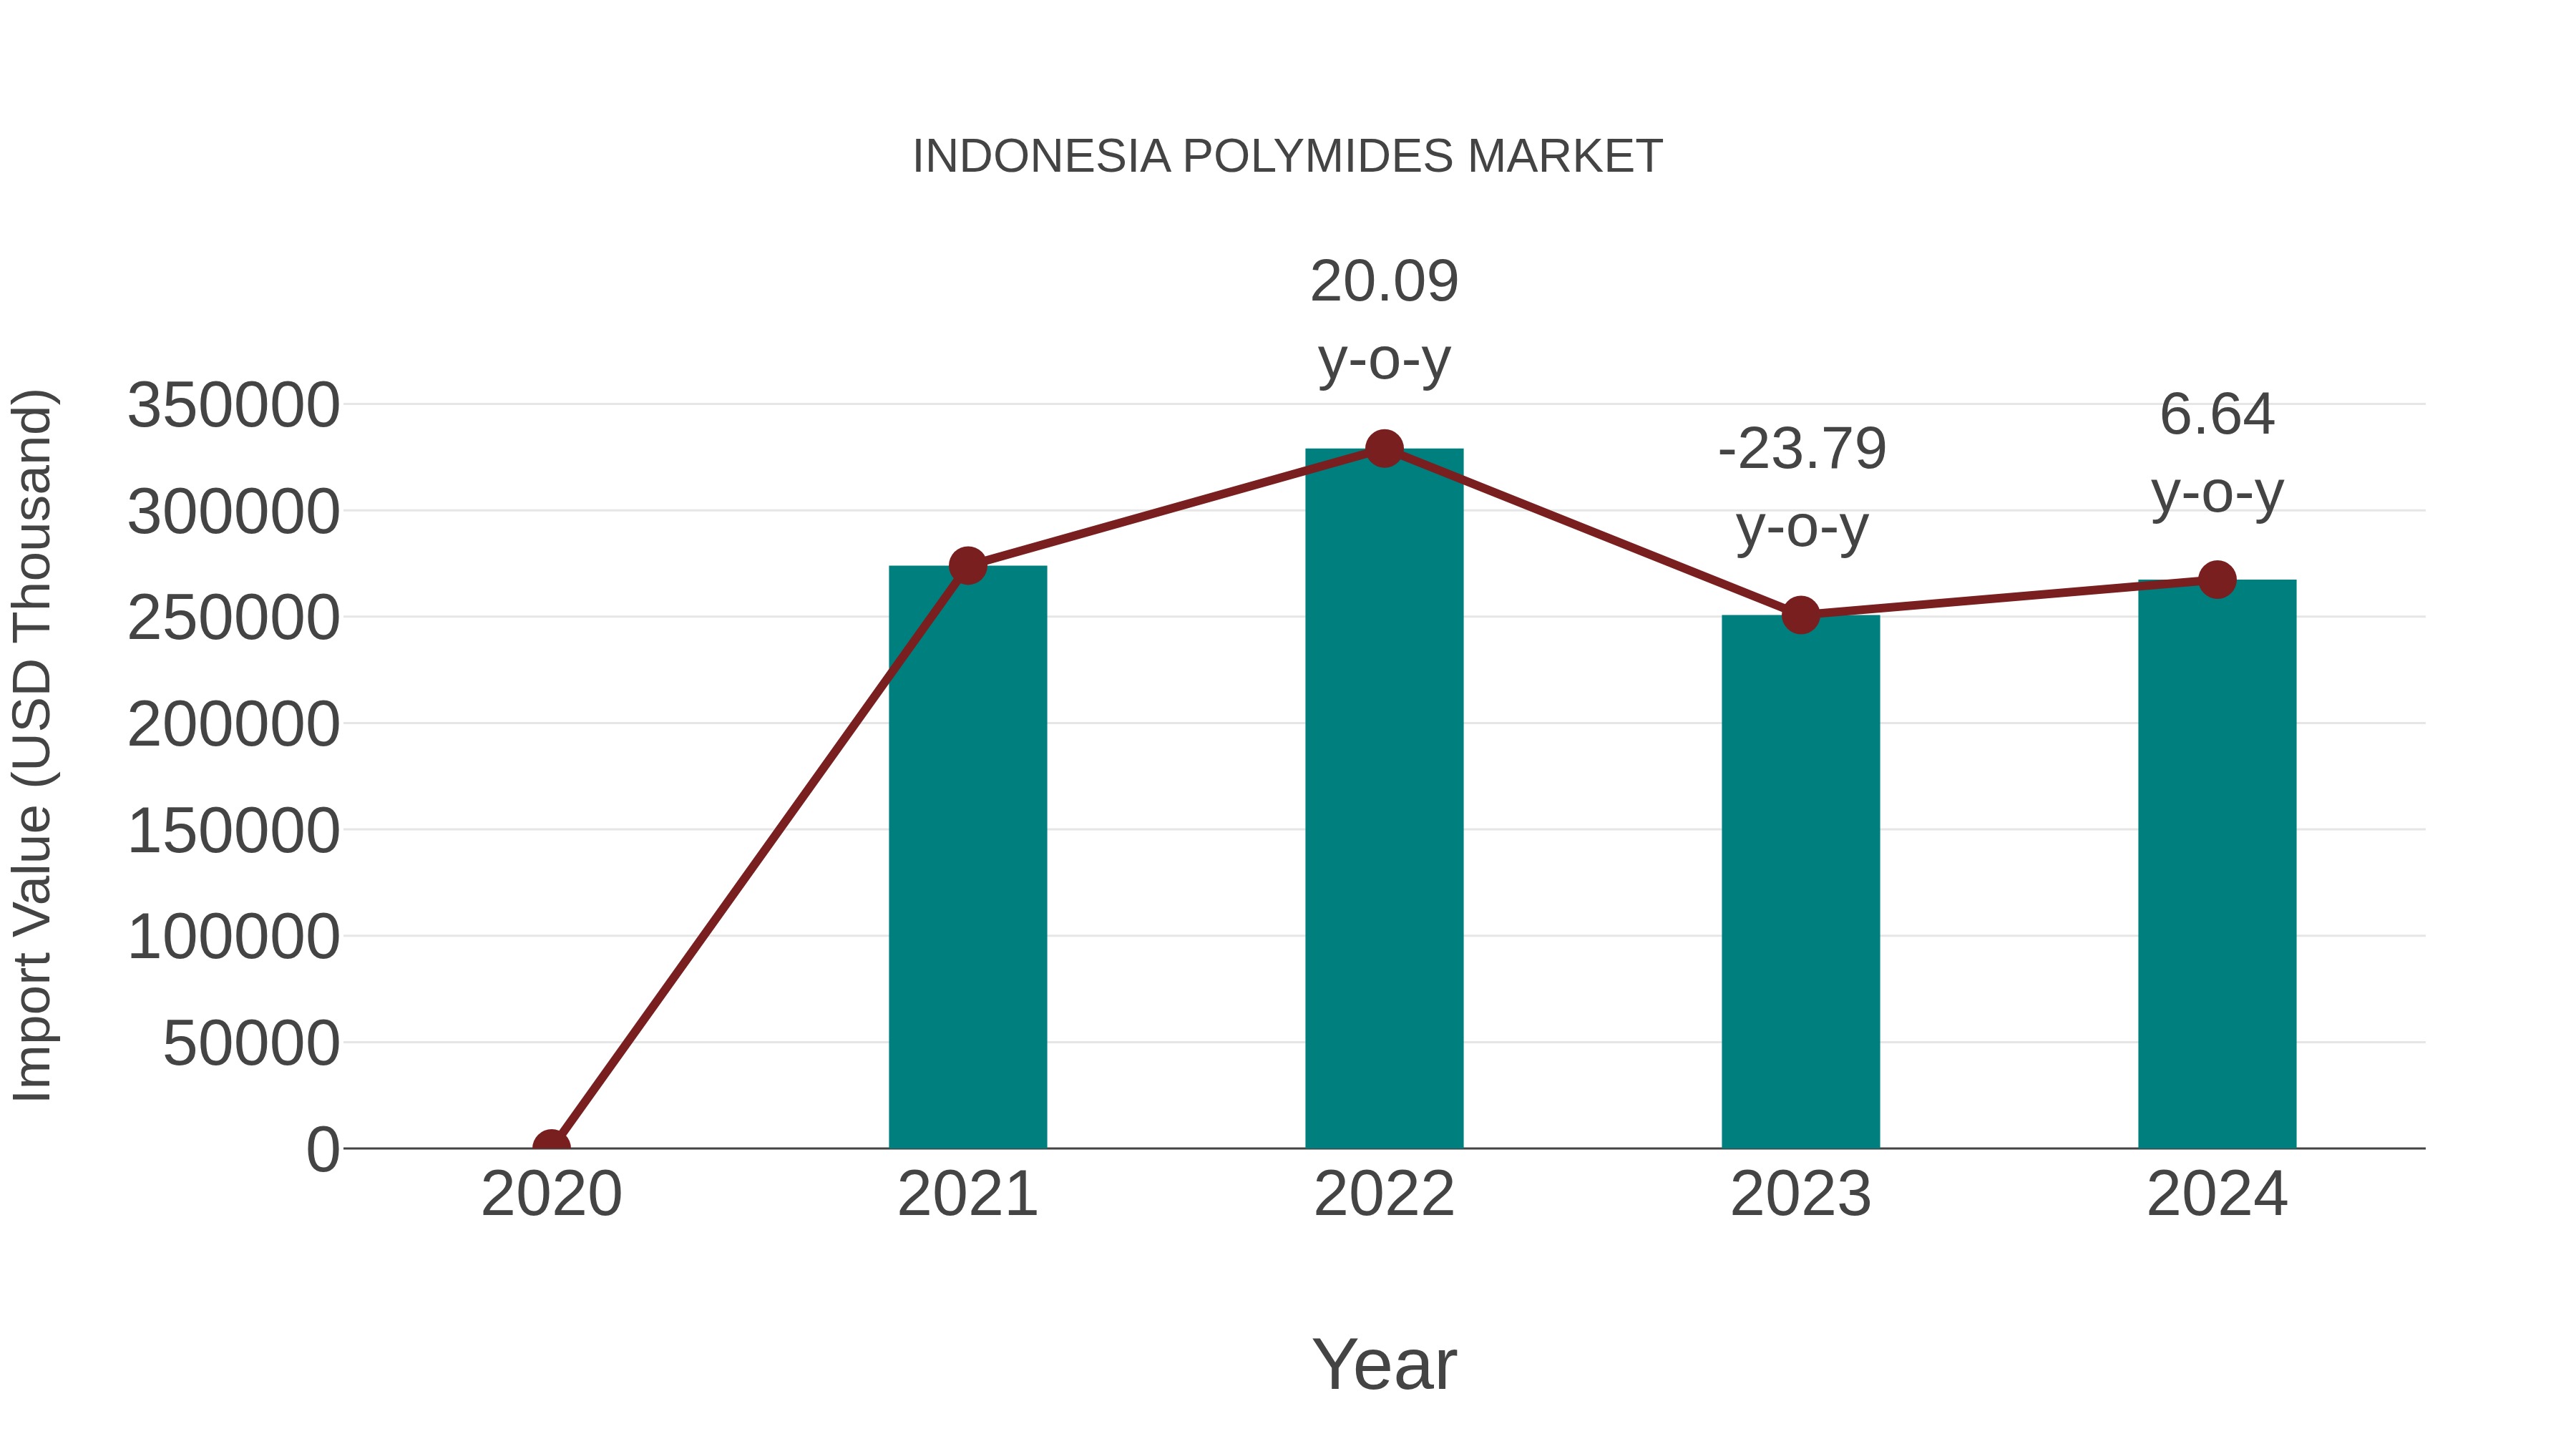
Indonesia Polymides Market: Import Trend Analysis
In the Indonesia polyamides market, import trends showed a growth rate of 6.64% from 2023 to 2024, with a compound annual growth rate (CAGR) of -0.81% from 2020 to 2024. The negative CAGR suggests market instability, potentially influenced by fluctuating demand or trade policies during the period.
Indonesia Polymides MarketSynopsis
Indonesia polymides market is expected to witness a positive growth during the forecast period of 2025-2031. The increasing demand for lightweight and high performance materials in automotive, electronics, aerospace and consumer goods industries are likely to drive the growth of this market. The rising focus on sustainable manufacturing processes due to stringent regulations imposed by governments across the world has increased interest in using polymides such as nylon 6/6 or PA66 and nylon 6/10, which offer excellent mechanical properties, recyclability and cost efficiency.
Market Trends
The major trends observed in Indonesia polymides market include technological advancements leading to better product quality; increased utilization of bio-based raw material; growing use of nanomaterials; shift towards sustainability initiatives such as reusing and recycling plastics; emergence of 3D printing technology for production purpose; development of multi functional products with improved features.
Market Drivers
Some key drivers contributing to the growth of Indonesia Polymides market include rapid industrialization & urbanization which leads to an increasing demand for construction activities resulting into higher consumption rate from building & construction industry; rising awareness regarding energy conservation coupled with governmental support through various policies like tax credits etc., increasing penetration rate among end user industries like electrical appliance manufacturers, automobile manufacturers etc.; favorable economic conditions that fuels investments in research & developments thus innovating new products.
COVID-19 Impact on the Market
The COVID-19 pandemic has had a significant impact on Indonesia polymides market, as demand for the material has decreased due to reduced production activities and supply chain disruptions. The slowdown in economic activity across the country is also likely to have an adverse effect on sales of polymides in the near future, with some manufacturers predicting that demand may fall by up to 20%, depending on how long restrictions remain in place.
Challenges of the Market
The main challenge facing producers of polymides in Indonesia is ensuring their materials are price competitive, while still meeting high quality standards. As international trade continues to be highly volatile at present, sourcing inputs from abroad can be difficult and costly for Indonesia businesses. Additionally, there is increased competition from low cost imports flooding into the domestic market, which could lead to further pricing pressure for local suppliers of these materials.
Industry Key Players
Some of the key players operating within Indonesia polymides market include PT Surya Duta Polychemindo Tbk., PT Andhika Prima Plastikahana Industries Tbk., PT Polyplast Asia Indah Chemicals Industry Group and PT Marunda Centre Point Alloys Co.
Key Highlights of the Report:
- Indonesia Polymides Market Outlook
- Market Size of Indonesia Polymides Market, 2025
- Forecast of Indonesia Polymides Market, 2032
- Historical Data and Forecast of Indonesia Polymides Revenues & Volume for the Period 2022-2032F
- Indonesia Polymides Market Trend Evolution
- Indonesia Polymides Market Drivers and Challenges
- Indonesia Polymides Price Trends
- Indonesia Polymides Porter's Five Forces
- Indonesia Polymides Industry Life Cycle
- Historical Data and Forecast of Indonesia Polymides Market Revenues & Volume By Types for the Period 2022-2032F
- Historical Data and Forecast of Indonesia Polymides Market Revenues & Volume By PA 6 for the Period 2022-2032F
- Historical Data and Forecast of Indonesia Polymides Market Revenues & Volume By PA 66 for the Period 2022-2032F
- Historical Data and Forecast of Indonesia Polymides Market Revenues & Volume By Bio Polyamides & Specialty Polyamides for the Period 2022-2032F
- Historical Data and Forecast of Indonesia Polymides Market Revenues & Volume By Class for the Period 2022-2032F
- Historical Data and Forecast of Indonesia Polymides Market Revenues & Volume By Aliphatic Polyamides for the Period 2022-2032F
- Historical Data and Forecast of Indonesia Polymides Market Revenues & Volume By Semi-Aromatic & Aromatic Polyamides for the Period 2022-2032F
- Historical Data and Forecast of Indonesia Polymides Market Revenues & Volume By Application for the Period 2022-2032F
- Historical Data and Forecast of Indonesia Polymides Market Revenues & Volume By Fibers for the Period 2022-2032F
- Historical Data and Forecast of Indonesia Polymides Market Revenues & Volume By Wire & Cables for the Period 2022-2032F
- Historical Data and Forecast of Indonesia Polymides Market Revenues & Volume By 3D Printing for the Period 2022-2032F
- Historical Data and Forecast of Indonesia Polymides Market Revenues & Volume By Sports Equipment for the Period 2022-2032F
- Historical Data and Forecast of Indonesia Polymides Market Revenues & Volume By Engine Components for the Period 2022-2032F
- Historical Data and Forecast of Indonesia Polymides Market Revenues & Volume By Brakes & Transmission Parts for the Period 2022-2032F
- Historical Data and Forecast of Indonesia Polymides Market Revenues & Volume By Household Goods & Appliances for the Period 2022-2032F
- Historical Data and Forecast of Indonesia Polymides Market Revenues & Volume By End-use for the Period 2022-2032F
- Historical Data and Forecast of Indonesia Polymides Market Revenues & Volume By Automotive for the Period 2022-2032F
- Historical Data and Forecast of Indonesia Polymides Market Revenues & Volume By Electrical & Electronics for the Period 2022-2032F
- Historical Data and Forecast of Indonesia Polymides Market Revenues & Volume By Textile for the Period 2022-2032F
- Historical Data and Forecast of Indonesia Polymides Market Revenues & Volume By Aerospace & Defense for the Period 2022-2032F
- Historical Data and Forecast of Indonesia Polymides Market Revenues & Volume By Packaging for the Period 2022-2032F
- Historical Data and Forecast of Indonesia Polymides Market Revenues & Volume By Consumer Goods for the Period 2022-2032F
- Indonesia Polymides Import Export Trade Statistics
- Market Opportunity Assessment By Types
- Market Opportunity Assessment By Class
- Market Opportunity Assessment By Application
- Market Opportunity Assessment By End-use
- Indonesia Polymides Top Companies Market Share
- Indonesia Polymides Competitive Benchmarking By Technical and Operational Parameters
- Indonesia Polymides Company Profiles
- Indonesia Polymides Key Strategic Recommendations
Indonesia Polymides Market (2026-2032): FAQs
6Wresearch actively monitors the Indonesia Polymides Market and publishes its comprehensive annual report, highlighting emerging trends, growth drivers, revenue analysis, and forecast outlook. Our insights help businesses to make data-backed strategic decisions with ongoing market dynamics. Our analysts track relevent industries related to the Indonesia Polymides Market, allowing our clients with actionable intelligence and reliable forecasts tailored to emerging regional needs.
Yes, we provide customisation as per your requirements. To learn more, feel free to contact us on sales@6wresearch.com
1 Executive Summary |
2 Introduction |
2.1 Key Highlights of the Report |
2.2 Report Description |
2.3 Market Scope & Segmentation |
2.4 Research Methodology |
2.5 Assumptions |
3 Indonesia Polymides Market Overview |
3.1 Indonesia Country Macro Economic Indicators |
3.2 Indonesia Polymides Market Revenues & Volume, 2022 & 2032F |
3.3 Indonesia Polymides Market - Industry Life Cycle |
3.4 Indonesia Polymides Market - Porter's Five Forces |
3.5 Indonesia Polymides Market Revenues & Volume Share, By Types, 2022 & 2032F |
3.6 Indonesia Polymides Market Revenues & Volume Share, By Class, 2022 & 2032F |
3.7 Indonesia Polymides Market Revenues & Volume Share, By Application, 2022 & 2032F |
3.8 Indonesia Polymides Market Revenues & Volume Share, By End-use, 2022 & 2032F |
4 Indonesia Polymides Market Dynamics |
4.1 Impact Analysis |
4.2 Market Drivers |
4.2.1 Increasing demand for lightweight materials in automotive and aerospace industries |
4.2.2 Growing adoption of polyamides in electrical and electronics applications |
4.2.3 Rising focus on sustainable and eco-friendly materials in various end-use industries |
4.3 Market Restraints |
4.3.1 Fluctuating raw material prices impacting production costs |
4.3.2 Intense competition from alternative materials like polyesters and polypropylene |
4.3.3 Regulatory challenges related to environmental concerns and recycling of polyamides |
5 Indonesia Polymides Market Trends |
6 Indonesia Polymides Market, By Types |
6.1 Indonesia Polymides Market, By Types |
6.1.1 Overview and Analysis |
6.1.2 Indonesia Polymides Market Revenues & Volume, By Types, 2022-2032F |
6.1.3 Indonesia Polymides Market Revenues & Volume, By PA 6, 2022-2032F |
6.1.4 Indonesia Polymides Market Revenues & Volume, By PA 66, 2022-2032F |
6.1.5 Indonesia Polymides Market Revenues & Volume, By Bio Polyamides & Specialty Polyamides, 2022-2032F |
6.2 Indonesia Polymides Market, By Class |
6.2.1 Overview and Analysis |
6.2.2 Indonesia Polymides Market Revenues & Volume, By Aliphatic Polyamides, 2022-2032F |
6.2.3 Indonesia Polymides Market Revenues & Volume, By Semi-Aromatic & Aromatic Polyamides, 2022-2032F |
6.3 Indonesia Polymides Market, By Application |
6.3.1 Overview and Analysis |
6.3.2 Indonesia Polymides Market Revenues & Volume, By Fibers, 2022-2032F |
6.3.3 Indonesia Polymides Market Revenues & Volume, By Wire & Cables, 2022-2032F |
6.3.4 Indonesia Polymides Market Revenues & Volume, By 3D Printing, 2022-2032F |
6.3.5 Indonesia Polymides Market Revenues & Volume, By Sports Equipment, 2022-2032F |
6.3.6 Indonesia Polymides Market Revenues & Volume, By Engine Components, 2022-2032F |
6.3.7 Indonesia Polymides Market Revenues & Volume, By Brakes & Transmission Parts, 2022-2032F |
6.4 Indonesia Polymides Market, By End-use |
6.4.1 Overview and Analysis |
6.4.2 Indonesia Polymides Market Revenues & Volume, By Automotive, 2022-2032F |
6.4.3 Indonesia Polymides Market Revenues & Volume, By Electrical & Electronics, 2022-2032F |
6.4.4 Indonesia Polymides Market Revenues & Volume, By Textile, 2022-2032F |
6.4.5 Indonesia Polymides Market Revenues & Volume, By Aerospace & Defense, 2022-2032F |
6.4.6 Indonesia Polymides Market Revenues & Volume, By Packaging, 2022-2032F |
6.4.7 Indonesia Polymides Market Revenues & Volume, By Consumer Goods, 2022-2032F |
7 Indonesia Polymides Market Import-Export Trade Statistics |
7.1 Indonesia Polymides Market Export to Major Countries |
7.2 Indonesia Polymides Market Imports from Major Countries |
8 Indonesia Polymides Market Key Performance Indicators |
8.1 Research and development investment in new polyamide formulations |
8.2 Adoption rate of polyamides in emerging applications such as 3D printing |
8.3 Percentage of recycled polyamides used in manufacturing processes |
9 Indonesia Polymides Market - Opportunity Assessment |
9.1 Indonesia Polymides Market Opportunity Assessment, By Types, 2022 & 2032F |
9.2 Indonesia Polymides Market Opportunity Assessment, By Class, 2022 & 2032F |
9.3 Indonesia Polymides Market Opportunity Assessment, By Application, 2022 & 2032F |
9.4 Indonesia Polymides Market Opportunity Assessment, By End-use, 2022 & 2032F |
10 Indonesia Polymides Market - Competitive Landscape |
10.1 Indonesia Polymides Market Revenue Share, By Companies, 2025 |
10.2 Indonesia Polymides Market Competitive Benchmarking, By Operating and Technical Parameters |
11 Company Profiles |
12 Recommendations |
13 Disclaimer |
Global Go To Market Strategy - 2030
Export potential enables firms to identify high-growth global markets with greater confidence by combining advanced trade intelligence with a structured quantitative methodology. The framework analyzes emerging demand trends and country-level import patterns while integrating macroeconomic and trade datasets such as GDP and population forecasts, bilateral import–export flows, tariff structures, elasticity differentials between developed and developing economies, geographic distance, and import demand projections. Using weighted trade values from 2020–2024 as the base period to project country-to-country export potential for 2030, these inputs are operationalized through calculated drivers such as gravity model parameters, tariff impact factors, and projected GDP per-capita growth. Through an analysis of hidden potentials, demand hotspots, and market conditions that are most favorable to success, this method enables firms to focus on target countries, maximize returns, and global expansion with data, backed by accuracy.
By factoring in the projected importer demand gap that is currently unmet and could be potential opportunity, it identifies the potential for the Exporter (Country) among 190 countries, against the general trade analysis, which identifies the biggest importer or exporter.
To discover high-growth global markets and optimize your business strategy:
Click Here
Pricing
- Single User License$ 1,995
- Department License$ 2,400
- Site License$ 3,120
- Global License$ 3,795

Leadership Perspectives from Industry Events
Search
Thought Leadership and Analyst Meet


Our Clients
6WResearch In News
- India Air Conditioner Market Set for Strong Rebound in 2026 After Weather-Led Correction and GST-Driven Recovery: 6Wresearch
- ADAS in India: How Automatic Emergency Braking, Blind Spot Detection & Driver Monitoring are Transforming Road Safety
- Doha a strategic location for EV manufacturing hub: IPA Qatar
- Demand for luxury TVs surging in the GCC, says Samsung
- Empowering Growth: The Thriving Journey of Bangladesh’s Cable Industry
- Demand for luxury TVs surging in the GCC, says Samsung
Latest Reports
- Poland Fire Protection Systems Market (2026-2032)
- Cape Verde Portable Hand-Thrown Extinguisher Market (2026-2032)
- Canada Portable Hand-Thrown Extinguisher Market (2026-2032)
- Cameroon Portable Hand-Thrown Extinguisher Market (2026-2032)
- Burundi Portable Hand-Thrown Extinguisher Market (2026-2032)
- Burkina Faso Portable Hand-Thrown Extinguisher Market (2026-2032)
- Bulgaria Portable Hand-Thrown Extinguisher Market (2026-2032)
- Brunei Portable Hand-Thrown Extinguisher Market (2026-2032)
- Botswana Portable Hand-Thrown Extinguisher Market (2026-2032)
- Bosnia and Herzegovina Portable Hand-Thrown Extinguisher Market (2026-2032)
Industry Events and Analyst Meet

HIMTEX 2026

India Refining Summit 2026

India EV Show 2026

EV tech India Expo 2026

Auto Tech Asia 2026
Whitepaper
- Middle East & Africa Commercial Security Market Click here to view more.
- Middle East & Africa Fire Safety Systems & Equipment Market Click here to view more.
- GCC Drone Market Click here to view more.
- Middle East Lighting Fixture Market Click here to view more.
- GCC Physical & Perimeter Security Market Click here to view more.