Indonesia Puncheon Barrel Market (2026-2032) | Share, Industry, Analysis, Competitive Landscape, Value, Growth, Trends, Segmentation, Forecast, Outlook, Companies, Size & Revenue
Market Forecast By Material Type (French Oak, American Oak), By Capacity (Less than 200 Liters, 201 to 300 Liters, 301 to 400 Liters, More than 400 Liters), By Toast Level (Light, Medium, Medium Plus, Heavy, Hoops, Brass Hoops, Copper Hoops, Metal Hoops), By End Use (Industrial, Residential, Commercial) And Competitive Landscape
| Product Code: ETC7573844 | Publication Date: Sep 2024 | Updated Date: Feb 2026 | Product Type: Market Research Report | |
| Publisher: 6Wresearch | Author: Dhaval Chaurasia | No. of Pages: 75 | No. of Figures: 35 | No. of Tables: 20 |
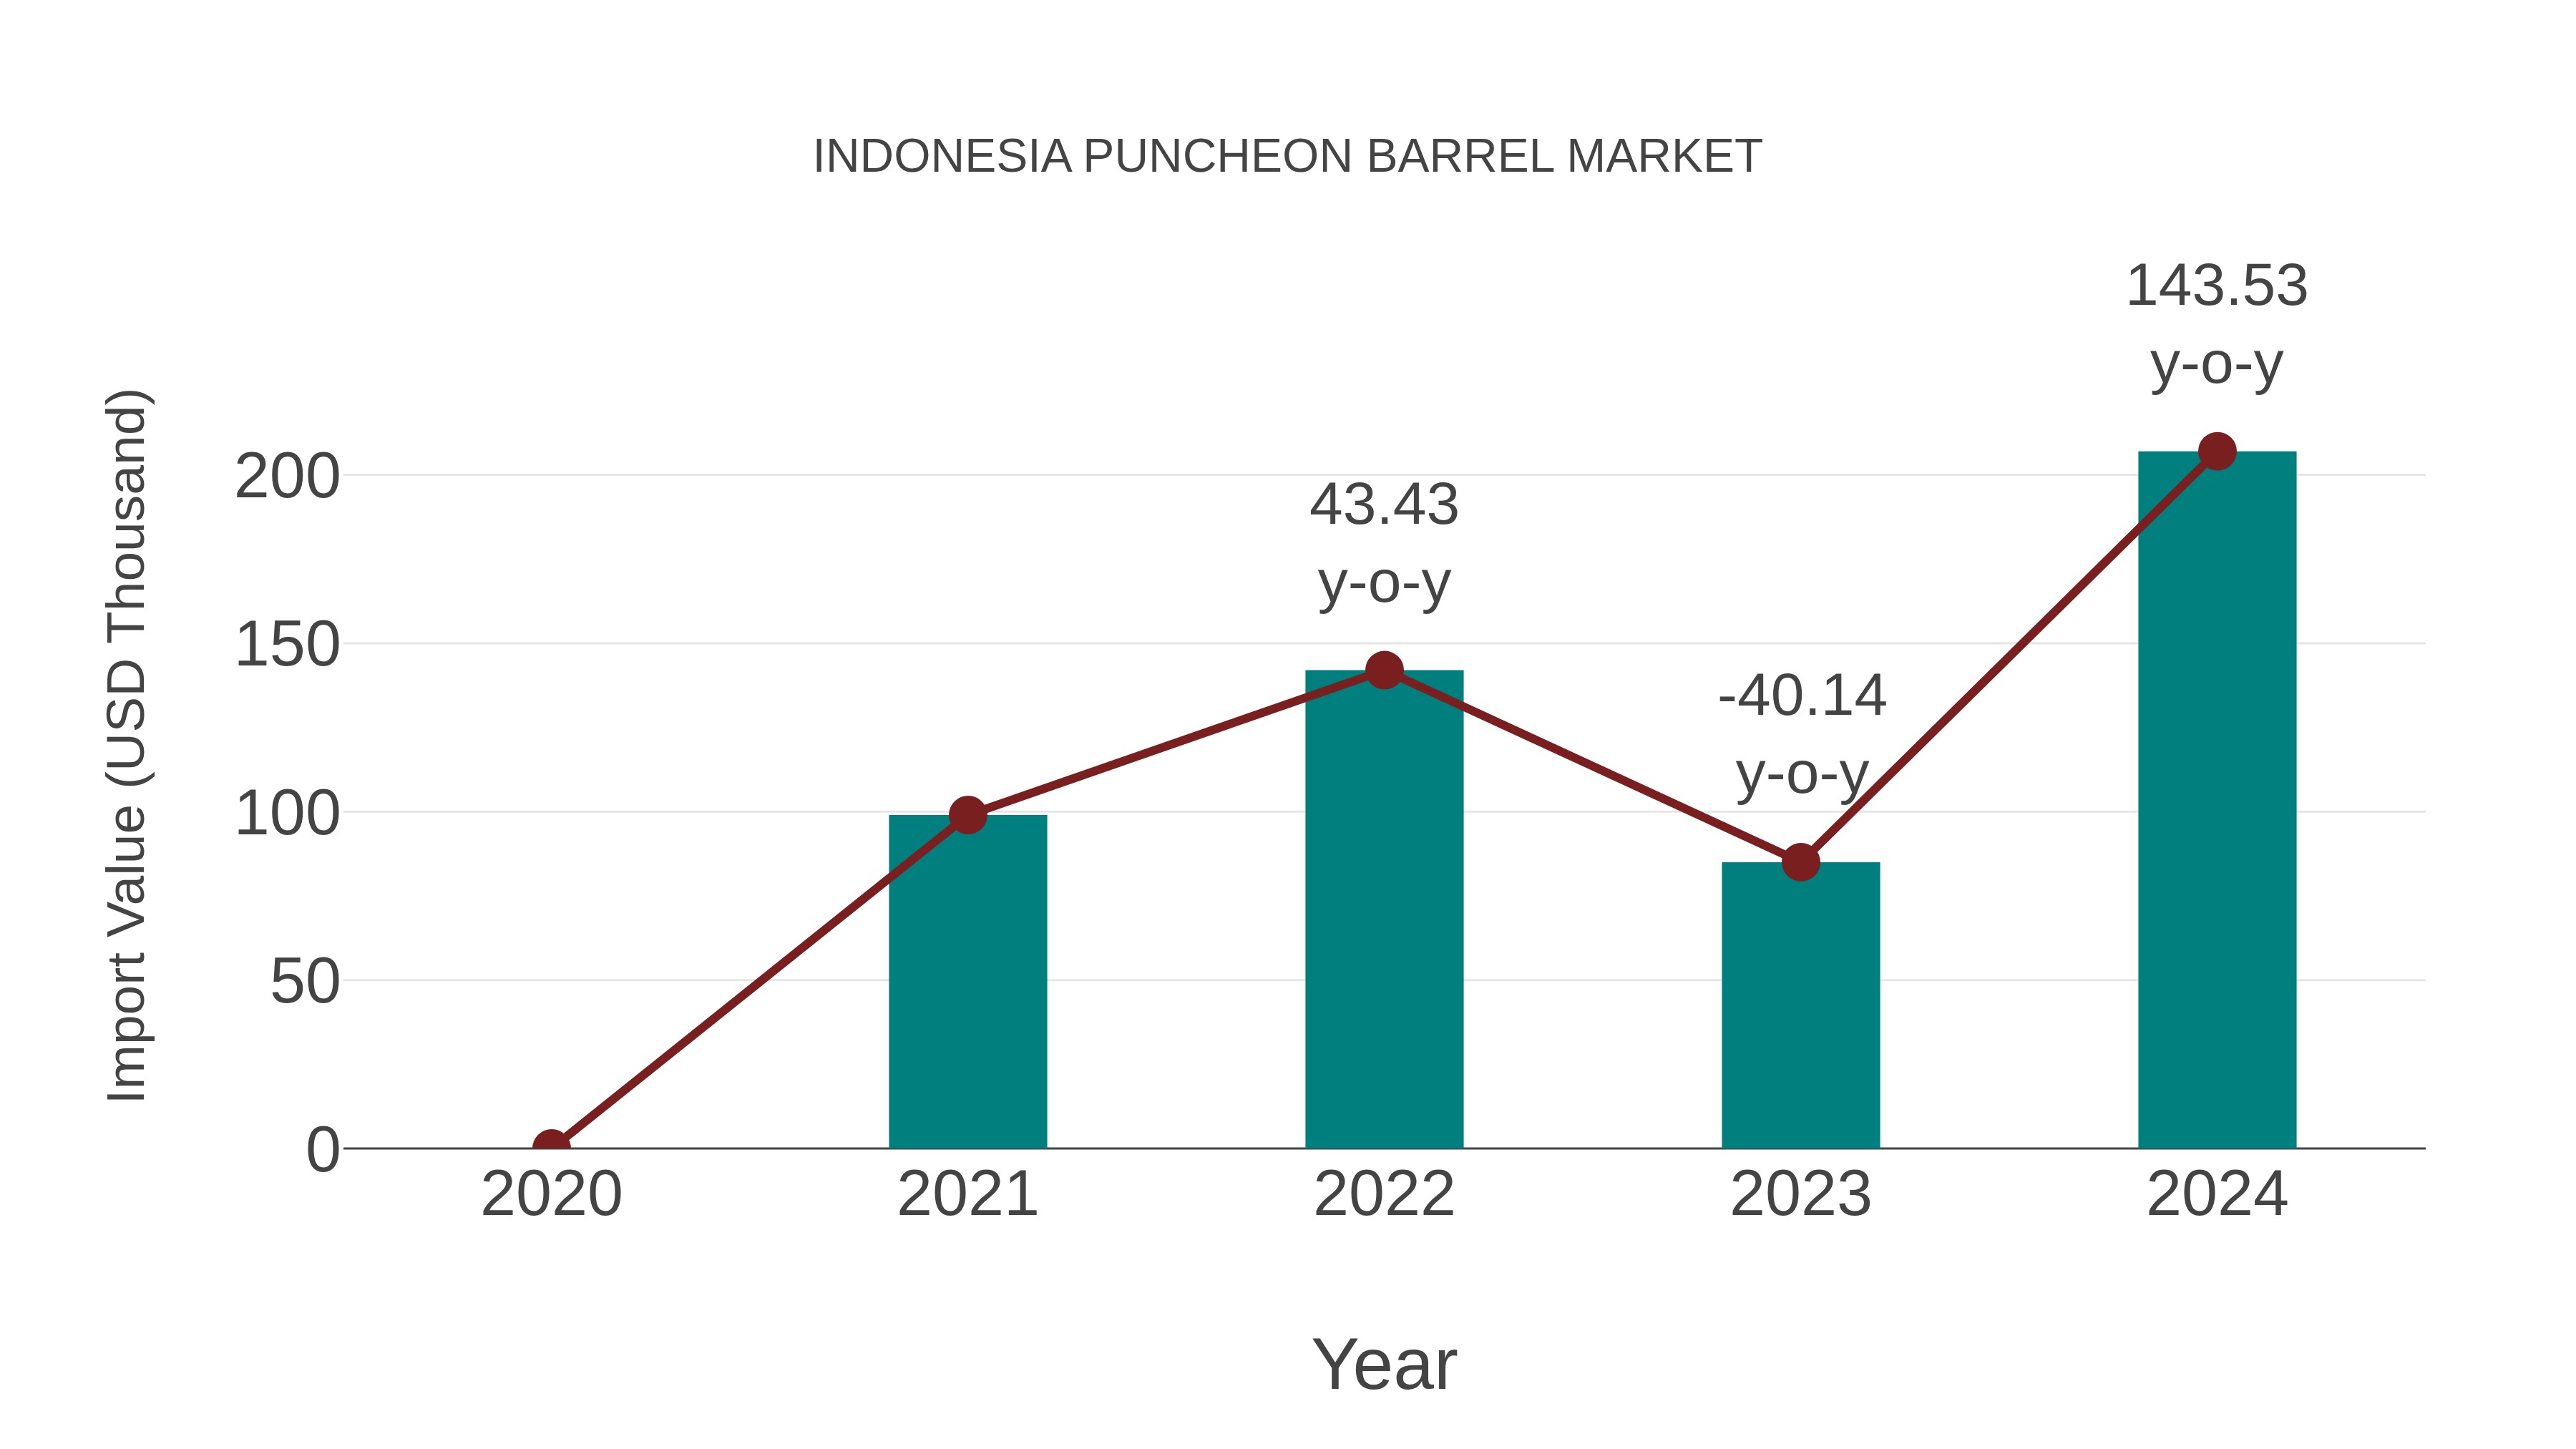
Indonesia Puncheon Barrel Market: Import Trend Analysis
Indonesia`s import trend for puncheon barrels in 2023-2024 surged by 143.53%, with a compound annual growth rate (CAGR) of 27.87% from 2020-2024. This remarkable growth can be attributed to a significant demand shift towards quality storage solutions in the beverage and food industries, driving import momentum and indicating a stable market for puncheon barrels during this period.
Key Highlights of the Report:
- Indonesia Puncheon Barrel Market Outlook
- Market Size of Indonesia Puncheon Barrel Market, 2025
- Forecast of Indonesia Puncheon Barrel Market, 2032
- Historical Data and Forecast of Indonesia Puncheon Barrel Revenues & Volume for the Period 2022-2032F
- Indonesia Puncheon Barrel Market Trend Evolution
- Indonesia Puncheon Barrel Market Drivers and Challenges
- Indonesia Puncheon Barrel Price Trends
- Indonesia Puncheon Barrel Porter's Five Forces
- Indonesia Puncheon Barrel Industry Life Cycle
- Historical Data and Forecast of Indonesia Puncheon Barrel Market Revenues & Volume By Material Type for the Period 2022-2032F
- Historical Data and Forecast of Indonesia Puncheon Barrel Market Revenues & Volume By French Oak for the Period 2022-2032F
- Historical Data and Forecast of Indonesia Puncheon Barrel Market Revenues & Volume By American Oak for the Period 2022-2032F
- Historical Data and Forecast of Indonesia Puncheon Barrel Market Revenues & Volume By Capacity for the Period 2022-2032F
- Historical Data and Forecast of Indonesia Puncheon Barrel Market Revenues & Volume By Less than 200 Liters for the Period 2022-2032F
- Historical Data and Forecast of Indonesia Puncheon Barrel Market Revenues & Volume By 201 to 300 Liters for the Period 2022-2032F
- Historical Data and Forecast of Indonesia Puncheon Barrel Market Revenues & Volume By 301 to 400 Liters for the Period 2022-2032F
- Historical Data and Forecast of Indonesia Puncheon Barrel Market Revenues & Volume By More than 400 Liters for the Period 2022-2032F
- Historical Data and Forecast of Indonesia Puncheon Barrel Market Revenues & Volume By Toast Level for the Period 2022-2032F
- Historical Data and Forecast of Indonesia Puncheon Barrel Market Revenues & Volume By Light for the Period 2022-2032F
- Historical Data and Forecast of Indonesia Puncheon Barrel Market Revenues & Volume By Medium for the Period 2022-2032F
- Historical Data and Forecast of Indonesia Puncheon Barrel Market Revenues & Volume By Medium Plus for the Period 2022-2032F
- Historical Data and Forecast of Indonesia Puncheon Barrel Market Revenues & Volume By Heavy for the Period 2022-2032F
- Historical Data and Forecast of Indonesia Puncheon Barrel Market Revenues & Volume By Hoops for the Period 2022-2032F
- Historical Data and Forecast of Indonesia Puncheon Barrel Market Revenues & Volume By Brass Hoops for the Period 2022-2032F
- Historical Data and Forecast of Indonesia Puncheon Barrel Market Revenues & Volume By Copper Hoops for the Period 2022-2032F
- Historical Data and Forecast of Indonesia Puncheon Barrel Market Revenues & Volume By Metal Hoops for the Period 2022-2032F
- Historical Data and Forecast of Indonesia Puncheon Barrel Market Revenues & Volume By End Use for the Period 2022-2032F
- Historical Data and Forecast of Indonesia Puncheon Barrel Market Revenues & Volume By Industrial for the Period 2022-2032F
- Historical Data and Forecast of Indonesia Puncheon Barrel Market Revenues & Volume By Residential for the Period 2022-2032F
- Historical Data and Forecast of Indonesia Puncheon Barrel Market Revenues & Volume By Commercial for the Period 2022-2032F
- Indonesia Puncheon Barrel Import Export Trade Statistics
- Market Opportunity Assessment By Material Type
- Market Opportunity Assessment By Capacity
- Market Opportunity Assessment By Toast Level
- Market Opportunity Assessment By End Use
- Indonesia Puncheon Barrel Top Companies Market Share
- Indonesia Puncheon Barrel Competitive Benchmarking By Technical and Operational Parameters
- Indonesia Puncheon Barrel Company Profiles
- Indonesia Puncheon Barrel Key Strategic Recommendations
Frequently Asked Questions About the Market Study (FAQs):
6Wresearch actively monitors the Indonesia Puncheon Barrel Market and publishes its comprehensive annual report, highlighting emerging trends, growth drivers, revenue analysis, and forecast outlook. Our insights help businesses to make data-backed strategic decisions with ongoing market dynamics. Our analysts track relevent industries related to the Indonesia Puncheon Barrel Market, allowing our clients with actionable intelligence and reliable forecasts tailored to emerging regional needs.
Yes, we provide customisation as per your requirements. To learn more, feel free to contact us on sales@6wresearch.com
1 Executive Summary |
2 Introduction |
2.1 Key Highlights of the Report |
2.2 Report Description |
2.3 Market Scope & Segmentation |
2.4 Research Methodology |
2.5 Assumptions |
3 Indonesia Puncheon Barrel Market Overview |
3.1 Indonesia Country Macro Economic Indicators |
3.2 Indonesia Puncheon Barrel Market Revenues & Volume, 2022 & 2032F |
3.3 Indonesia Puncheon Barrel Market - Industry Life Cycle |
3.4 Indonesia Puncheon Barrel Market - Porter's Five Forces |
3.5 Indonesia Puncheon Barrel Market Revenues & Volume Share, By Material Type, 2022 & 2032F |
3.6 Indonesia Puncheon Barrel Market Revenues & Volume Share, By Capacity, 2022 & 2032F |
3.7 Indonesia Puncheon Barrel Market Revenues & Volume Share, By Toast Level, 2022 & 2032F |
3.8 Indonesia Puncheon Barrel Market Revenues & Volume Share, By End Use, 2022 & 2032F |
4 Indonesia Puncheon Barrel Market Dynamics |
4.1 Impact Analysis |
4.2 Market Drivers |
4.2.1 Growth in the food and beverage industry requiring puncheon barrels for storage and aging purposes. |
4.2.2 Increase in the demand for traditional craftsmanship and artisanal products, driving the production and sales of puncheon barrels. |
4.2.3 Rising popularity of craft breweries and distilleries utilizing puncheon barrels for unique flavor profiles. |
4.2.4 Government initiatives promoting the use of sustainable materials like wood, encouraging the adoption of puncheon barrels in various industries. |
4.3 Market Restraints |
4.3.1 Fluctuating prices of raw materials such as wood impacting the production cost of puncheon barrels. |
4.3.2 Competition from alternative storage solutions like stainless steel tanks affecting the market for puncheon barrels. |
4.3.3 Challenges in maintaining consistent quality and preventing leakage in puncheon barrels, leading to potential product wastage. |
4.3.4 Environmental regulations restricting the use of certain types of wood for puncheon barrel production. |
5 Indonesia Puncheon Barrel Market Trends |
6 Indonesia Puncheon Barrel Market, By Types |
6.1 Indonesia Puncheon Barrel Market, By Material Type |
6.1.1 Overview and Analysis |
6.1.2 Indonesia Puncheon Barrel Market Revenues & Volume, By Material Type, 2022-2032F |
6.1.3 Indonesia Puncheon Barrel Market Revenues & Volume, By French Oak, 2022-2032F |
6.1.4 Indonesia Puncheon Barrel Market Revenues & Volume, By American Oak, 2022-2032F |
6.2 Indonesia Puncheon Barrel Market, By Capacity |
6.2.1 Overview and Analysis |
6.2.2 Indonesia Puncheon Barrel Market Revenues & Volume, By Less than 200 Liters, 2022-2032F |
6.2.3 Indonesia Puncheon Barrel Market Revenues & Volume, By 201 to 300 Liters, 2022-2032F |
6.2.4 Indonesia Puncheon Barrel Market Revenues & Volume, By 301 to 400 Liters, 2022-2032F |
6.2.5 Indonesia Puncheon Barrel Market Revenues & Volume, By More than 400 Liters, 2022-2032F |
6.3 Indonesia Puncheon Barrel Market, By Toast Level |
6.3.1 Overview and Analysis |
6.3.2 Indonesia Puncheon Barrel Market Revenues & Volume, By Light, 2022-2032F |
6.3.3 Indonesia Puncheon Barrel Market Revenues & Volume, By Medium, 2022-2032F |
6.3.4 Indonesia Puncheon Barrel Market Revenues & Volume, By Medium Plus, 2022-2032F |
6.3.5 Indonesia Puncheon Barrel Market Revenues & Volume, By Heavy, 2022-2032F |
6.3.6 Indonesia Puncheon Barrel Market Revenues & Volume, By Hoops, 2022-2032F |
6.3.7 Indonesia Puncheon Barrel Market Revenues & Volume, By Brass Hoops, 2022-2032F |
6.3.8 Indonesia Puncheon Barrel Market Revenues & Volume, By Metal Hoops, 2022-2032F |
6.3.9 Indonesia Puncheon Barrel Market Revenues & Volume, By Metal Hoops, 2022-2032F |
6.4 Indonesia Puncheon Barrel Market, By End Use |
6.4.1 Overview and Analysis |
6.4.2 Indonesia Puncheon Barrel Market Revenues & Volume, By Industrial, 2022-2032F |
6.4.3 Indonesia Puncheon Barrel Market Revenues & Volume, By Residential, 2022-2032F |
6.4.4 Indonesia Puncheon Barrel Market Revenues & Volume, By Commercial, 2022-2032F |
7 Indonesia Puncheon Barrel Market Import-Export Trade Statistics |
7.1 Indonesia Puncheon Barrel Market Export to Major Countries |
7.2 Indonesia Puncheon Barrel Market Imports from Major Countries |
8 Indonesia Puncheon Barrel Market Key Performance Indicators |
8.1 Average turnaround time for puncheon barrel production from raw material acquisition to finished product. |
8.2 Percentage of puncheon barrels meeting quality standards to ensure customer satisfaction and reduce returns. |
8.3 Number of new product development projects focusing on enhancing the durability and efficiency of puncheon barrels. |
9 Indonesia Puncheon Barrel Market - Opportunity Assessment |
9.1 Indonesia Puncheon Barrel Market Opportunity Assessment, By Material Type, 2022 & 2032F |
9.2 Indonesia Puncheon Barrel Market Opportunity Assessment, By Capacity, 2022 & 2032F |
9.3 Indonesia Puncheon Barrel Market Opportunity Assessment, By Toast Level, 2022 & 2032F |
9.4 Indonesia Puncheon Barrel Market Opportunity Assessment, By End Use, 2022 & 2032F |
10 Indonesia Puncheon Barrel Market - Competitive Landscape |
10.1 Indonesia Puncheon Barrel Market Revenue Share, By Companies, 2025 |
10.2 Indonesia Puncheon Barrel Market Competitive Benchmarking, By Operating and Technical Parameters |
11 Company Profiles |
12 Recommendations |
13 Disclaimer |
Export potential assessment - trade Analytics for 2030
Export potential enables firms to identify high-growth global markets with greater confidence by combining advanced trade intelligence with a structured quantitative methodology. The framework analyzes emerging demand trends and country-level import patterns while integrating macroeconomic and trade datasets such as GDP and population forecasts, bilateral import–export flows, tariff structures, elasticity differentials between developed and developing economies, geographic distance, and import demand projections. Using weighted trade values from 2020–2024 as the base period to project country-to-country export potential for 2030, these inputs are operationalized through calculated drivers such as gravity model parameters, tariff impact factors, and projected GDP per-capita growth. Through an analysis of hidden potentials, demand hotspots, and market conditions that are most favorable to success, this method enables firms to focus on target countries, maximize returns, and global expansion with data, backed by accuracy.
By factoring in the projected importer demand gap that is currently unmet and could be potential opportunity, it identifies the potential for the Exporter (Country) among 190 countries, against the general trade analysis, which identifies the biggest importer or exporter.
To discover high-growth global markets and optimize your business strategy:
Click Here
Pricing
- Single User License$ 1,995
- Department License$ 2,400
- Site License$ 3,120
- Global License$ 3,795

Search
Thought Leadership and Analyst Meet


Our Clients
Latest Reports
- China Electric Appliance Rental Market (2026-2032) | Trends, Revenue, Growth, Challenges, Size, Value, Outlook, Pricing, Strategy, Insights, Restraints, segmentation, Companies, Investment Opportunities, Analysis, Demand, Drivers, Competition, Forecast, Share
- Chile Electric Appliance Rental Market (2026-2032) | Outlook, Competition, Drivers, Strategy, Revenue, Analysis, Value, Pricing, Restraints, Size, Demand, Share, Growth, Forecast, Challenges, Insights, Investment Opportunities, Companies, Trends, segmentation
- Cambodia Electric Appliance Rental Market (2026-2032) | Companies, Analysis, Restraints, Pricing, Insights, Challenges, Outlook, Strategy, Forecast, Trends, Competition, Value, Revenue, Investment Opportunities, segmentation, Drivers, Size, Demand, Growth, Share
- Brazil Electric Appliance Rental Market (2026-2032) | Revenue, Strategy, Forecast, Companies, segmentation, Competition, Size, Investment Opportunities, Pricing, Restraints, Outlook, Challenges, Analysis, Drivers, Value, Demand, Insights, Trends, Growth, Share
- Bangladesh Electric Appliance Rental Market (2026-2032) | Drivers, Forecast, Investment Opportunities, Strategy, Insights, Demand, Challenges, Outlook, Trends, Competition, Value, Revenue, Size, Pricing, Analysis, Companies, Restraints, segmentation, Share, Growth
- Bahrain Electric Appliance Rental Market (2026-2032) | Outlook, Size, Competition, Restraints, Drivers, Value, Trends, Investment Opportunities, Insights, Forecast, Revenue, Strategy, Growth, Share, Demand, Analysis, Challenges, Companies, segmentation, Pricing
- Azerbaijan Electric Appliance Rental Market (2026-2032) | Trends, Investment Opportunities, Restraints, Insights, Strategy, Competition, Value, Growth, Demand, Drivers, Analysis, Forecast, Size, Share, Outlook, segmentation, Pricing, Challenges, Revenue, Companies
- Australia Electric Appliance Rental Market (2026-2032) | Challenges, Restraints, Forecast, Demand, Size, Competition, Pricing, Investment Opportunities, Revenue, Trends, Drivers, Growth, Outlook, Analysis, Strategy, Value, segmentation, Insights, Companies, Share
- Argentina Electric Appliance Rental Market (2026-2032) | Growth, Trends, Insights, Outlook, Forecast, Size, Drivers, Analysis, Restraints, Challenges, Share, Revenue, Investment Opportunities, Strategy, Demand, Value, Companies, segmentation, Competition, Pricing
- Algeria Electric Appliance Rental Market (2026-2032) | Share, Size, Value, Strategy, Competition, Outlook, Challenges, Companies, Trends, Pricing, Insights, Forecast, Investment Opportunities, Revenue, Growth, Restraints, segmentation, Analysis, Demand, Drivers
Industry Events and Analyst Meet

HIMTEX 2026

India Refining Summit 2026

India EV Show 2026

EV tech India Expo 2026

Auto Tech Asia 2026
Whitepaper
- Middle East & Africa Commercial Security Market Click here to view more.
- Middle East & Africa Fire Safety Systems & Equipment Market Click here to view more.
- GCC Drone Market Click here to view more.
- Middle East Lighting Fixture Market Click here to view more.
- GCC Physical & Perimeter Security Market Click here to view more.
6WResearch In News
- Doha a strategic location for EV manufacturing hub: IPA Qatar
- Demand for luxury TVs surging in the GCC, says Samsung
- Empowering Growth: The Thriving Journey of Bangladesh’s Cable Industry
- Demand for luxury TVs surging in the GCC, says Samsung
- Video call with a traditional healer? Once unthinkable, it’s now common in South Africa
- Intelligent Buildings To Smooth GCC’s Path To Net Zero