Indonesia Quantum Dot Market (2026-2032) Outlook | Share, Companies, Revenue, Analysis, Industry, Value, Trends, Forecast, Growth & Size
Market Forecast By Material (Cadmium-based, Cadmium-free), By Product (Displays, Other Products), By Vertical (Consumer, Commercial, Healthcare, Defense, Telecommunications, Others) And Competitive Landscape
| Product Code: ETC4445369 | Publication Date: Jul 2023 | Updated Date: Mar 2026 | Product Type: Report | |
| Publisher: 6Wresearch | Author: Ravi Bhandari | No. of Pages: 85 | No. of Figures: 45 | No. of Tables: 25 |
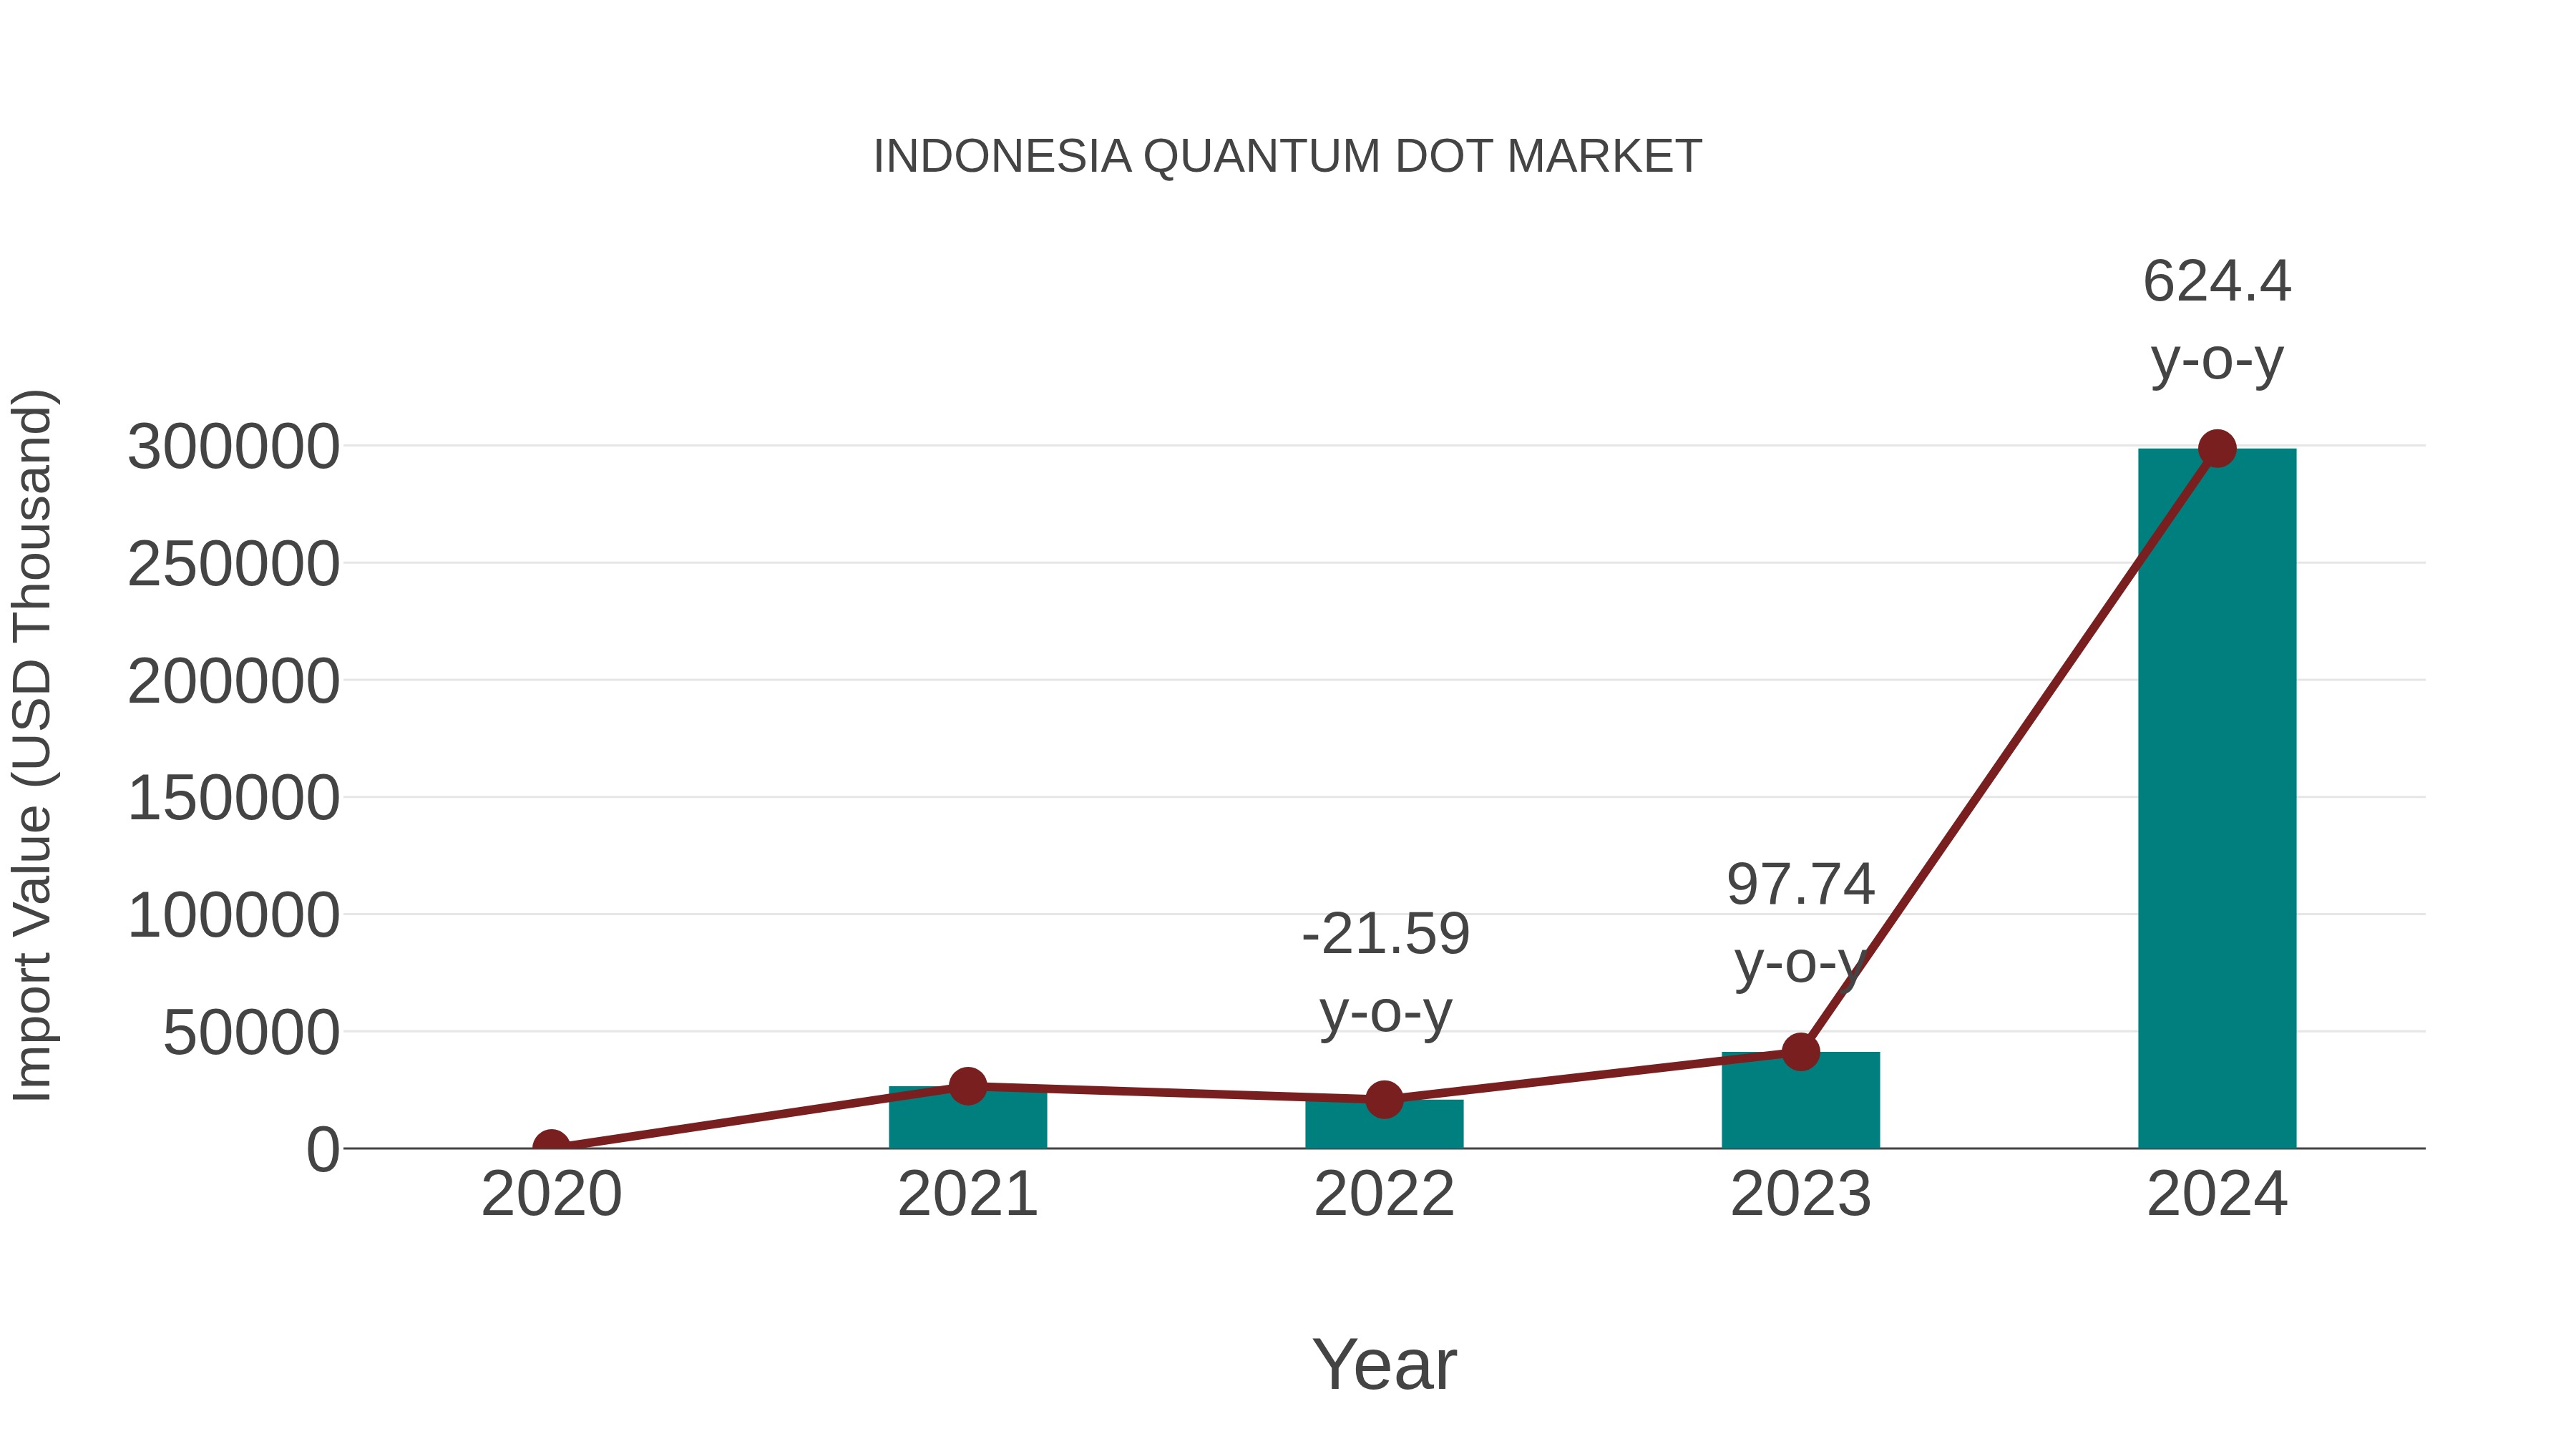
Indonesia Quantum Dot Market: Import Trend Analysis
Indonesia`s import trend for quantum dots in 2024 exhibited a significant growth rate of 624.4%, with a compound annual growth rate (CAGR) of 123.94% from 2020 to 2024. This surge in imports can be attributed to a notable demand shift towards advanced display technologies in the Indonesian market, indicating a strong import momentum driven by increasing consumer preferences for high-quality visual products.
Indonesia Quantum Dot Market Overview
Quantum dots are revolutionizing the display and lighting industries in Indonesia. These nanocrystals enhance color accuracy and brightness in electronic displays while reducing energy consumption, making them a key player in the tech market.
Drivers of the Market
The Indonesia quantum dot market is growing as quantum dots find applications in display technology, particularly in high-quality displays and televisions. Their ability to enhance color accuracy and energy efficiency is a key driver of their adoption.
Challenges of the Market
Challenges in the quantum dot market involve the need for research and development to advance quantum dot technology, addressing environmental concerns regarding material disposal, and competition from alternative display technologies.
COVID-19 Impacts on the Market
The Indonesia Quantum Dot market, a niche segment of the technology industry, experienced fluctuations during the COVID-19 pandemic. Quantum dots are used in displays and lighting, among other applications. As people spent more time indoors, there was a rise in demand for quantum dot displays for televisions and monitors. However, supply chain disruptions affected the availability of materials and components, causing delays in manufacturing. As the pandemic unfolded, the quantum dot market adapted to new challenges and opportunities, focusing on technological advancements and potential applications in healthcare and diagnostics.
Key Players of the Makret
Major contributors in the Indonesia Quantum Dot market comprise PT. Quantum Dots Indonesia, PT. Advanced Nano Products, and PT. Kianusa Prima Sejahtera.
Key Highlights of the Report:
- Indonesia Quantum Dot Market Outlook
- Market Size of Indonesia Quantum Dot Market, 2025
- Forecast of Indonesia Quantum Dot Market, 2032
- Historical Data and Forecast of Indonesia Quantum Dot Revenues & Volume for the Period 2022-2032F
- Indonesia Quantum Dot Market Trend Evolution
- Indonesia Quantum Dot Market Drivers and Challenges
- Indonesia Quantum Dot Price Trends
- Indonesia Quantum Dot Porter's Five Forces
- Indonesia Quantum Dot Industry Life Cycle
- Historical Data and Forecast of Indonesia Quantum Dot Market Revenues & Volume By Material for the Period 2022-2032F
- Historical Data and Forecast of Indonesia Quantum Dot Market Revenues & Volume By Cadmium-based for the Period 2022-2032F
- Historical Data and Forecast of Indonesia Quantum Dot Market Revenues & Volume By Cadmium-free for the Period 2022-2032F
- Historical Data and Forecast of Indonesia Quantum Dot Market Revenues & Volume By Product for the Period 2022-2032F
- Historical Data and Forecast of Indonesia Quantum Dot Market Revenues & Volume By Displays for the Period 2022-2032F
- Historical Data and Forecast of Indonesia Quantum Dot Market Revenues & Volume By Other Products for the Period 2022-2032F
- Historical Data and Forecast of Indonesia Quantum Dot Market Revenues & Volume By Vertical for the Period 2022-2032F
- Historical Data and Forecast of Indonesia Quantum Dot Market Revenues & Volume By Consumer for the Period 2022-2032F
- Historical Data and Forecast of Indonesia Quantum Dot Market Revenues & Volume By Commercial for the Period 2022-2032F
- Historical Data and Forecast of Indonesia Quantum Dot Market Revenues & Volume By Healthcare for the Period 2022-2032F
- Historical Data and Forecast of Indonesia Quantum Dot Market Revenues & Volume By Defense for the Period 2022-2032F
- Historical Data and Forecast of Indonesia Quantum Dot Market Revenues & Volume By Telecommunications for the Period 2022-2032F
- Historical Data and Forecast of Indonesia Quantum Dot Market Revenues & Volume By Others for the Period 2022-2032F
- Indonesia Quantum Dot Import Export Trade Statistics
- Market Opportunity Assessment By Material
- Market Opportunity Assessment By Product
- Market Opportunity Assessment By Vertical
- Indonesia Quantum Dot Top Companies Market Share
- Indonesia Quantum Dot Competitive Benchmarking By Technical and Operational Parameters
- Indonesia Quantum Dot Company Profiles
- Indonesia Quantum Dot Key Strategic Recommendations
Indonesia Quantum Dot Market (2026-2032): FAQs
6Wresearch actively monitors the Indonesia Quantum Dot Market and publishes its comprehensive annual report, highlighting emerging trends, growth drivers, revenue analysis, and forecast outlook. Our insights help businesses to make data-backed strategic decisions with ongoing market dynamics. Our analysts track relevent industries related to the Indonesia Quantum Dot Market, allowing our clients with actionable intelligence and reliable forecasts tailored to emerging regional needs.
Yes, we provide customisation as per your requirements. To learn more, feel free to contact us on sales@6wresearch.com
1 Executive Summary |
2 Introduction |
2.1 Key Highlights of the Report |
2.2 Report Description |
2.3 Market Scope & Segmentation |
2.4 Research Methodology |
2.5 Assumptions |
3 Indonesia Quantum Dot Market Overview |
3.1 Indonesia Country Macro Economic Indicators |
3.2 Indonesia Quantum Dot Market Revenues & Volume, 2022 & 2032F |
3.3 Indonesia Quantum Dot Market - Industry Life Cycle |
3.4 Indonesia Quantum Dot Market - Porter's Five Forces |
3.5 Indonesia Quantum Dot Market Revenues & Volume Share, By Material , 2022 & 2032F |
3.6 Indonesia Quantum Dot Market Revenues & Volume Share, By Product , 2022 & 2032F |
3.7 Indonesia Quantum Dot Market Revenues & Volume Share, By Vertical , 2022 & 2032F |
4 Indonesia Quantum Dot Market Dynamics |
4.1 Impact Analysis |
4.2 Market Drivers |
4.2.1 Increasing demand for high-quality displays and screens in the consumer electronics industry. |
4.2.2 Growing adoption of quantum dots in medical imaging and healthcare applications. |
4.2.3 Rising investments in research and development activities related to quantum dot technology in Indonesia. |
4.3 Market Restraints |
4.3.1 High manufacturing costs associated with quantum dot production. |
4.3.2 Lack of awareness and understanding about quantum dot technology among end-users. |
4.3.3 Environmental concerns related to the cadmium-based quantum dots. |
5 Indonesia Quantum Dot Market Trends |
6 Indonesia Quantum Dot Market, By Types |
6.1 Indonesia Quantum Dot Market, By Material |
6.1.1 Overview and Analysis |
6.1.2 Indonesia Quantum Dot Market Revenues & Volume, By Material , 2022-2032F |
6.1.3 Indonesia Quantum Dot Market Revenues & Volume, By Cadmium-based, 2022-2032F |
6.1.4 Indonesia Quantum Dot Market Revenues & Volume, By Cadmium-free, 2022-2032F |
6.2 Indonesia Quantum Dot Market, By Product |
6.2.1 Overview and Analysis |
6.2.2 Indonesia Quantum Dot Market Revenues & Volume, By Displays, 2022-2032F |
6.2.3 Indonesia Quantum Dot Market Revenues & Volume, By Other Products, 2022-2032F |
6.3 Indonesia Quantum Dot Market, By Vertical |
6.3.1 Overview and Analysis |
6.3.2 Indonesia Quantum Dot Market Revenues & Volume, By Consumer, 2022-2032F |
6.3.3 Indonesia Quantum Dot Market Revenues & Volume, By Commercial, 2022-2032F |
6.3.4 Indonesia Quantum Dot Market Revenues & Volume, By Healthcare, 2022-2032F |
6.3.5 Indonesia Quantum Dot Market Revenues & Volume, By Defense, 2022-2032F |
6.3.6 Indonesia Quantum Dot Market Revenues & Volume, By Telecommunications, 2022-2032F |
6.3.7 Indonesia Quantum Dot Market Revenues & Volume, By Others, 2022-2032F |
7 Indonesia Quantum Dot Market Import-Export Trade Statistics |
7.1 Indonesia Quantum Dot Market Export to Major Countries |
7.2 Indonesia Quantum Dot Market Imports from Major Countries |
8 Indonesia Quantum Dot Market Key Performance Indicators |
8.1 Number of new partnerships or collaborations with key players in the quantum dot industry. |
8.2 Percentage increase in research and development expenditure by quantum dot manufacturers. |
8.3 Number of patents filed for quantum dot technology innovations in Indonesia. |
8.4 Adoption rate of quantum dots in different industries within Indonesia. |
8.5 Percentage growth in the number of quantum dot-related research publications from Indonesian institutions. |
9 Indonesia Quantum Dot Market - Opportunity Assessment |
9.1 Indonesia Quantum Dot Market Opportunity Assessment, By Material , 2022 & 2032F |
9.2 Indonesia Quantum Dot Market Opportunity Assessment, By Product , 2022 & 2032F |
9.3 Indonesia Quantum Dot Market Opportunity Assessment, By Vertical , 2022 & 2032F |
10 Indonesia Quantum Dot Market - Competitive Landscape |
10.1 Indonesia Quantum Dot Market Revenue Share, By Companies, 2025 |
10.2 Indonesia Quantum Dot Market Competitive Benchmarking, By Operating and Technical Parameters |
11 Company Profiles |
12 Recommendations |
13 Disclaimer |
Export potential assessment - trade Analytics for 2030
Export potential enables firms to identify high-growth global markets with greater confidence by combining advanced trade intelligence with a structured quantitative methodology. The framework analyzes emerging demand trends and country-level import patterns while integrating macroeconomic and trade datasets such as GDP and population forecasts, bilateral import–export flows, tariff structures, elasticity differentials between developed and developing economies, geographic distance, and import demand projections. Using weighted trade values from 2020–2024 as the base period to project country-to-country export potential for 2030, these inputs are operationalized through calculated drivers such as gravity model parameters, tariff impact factors, and projected GDP per-capita growth. Through an analysis of hidden potentials, demand hotspots, and market conditions that are most favorable to success, this method enables firms to focus on target countries, maximize returns, and global expansion with data, backed by accuracy.
By factoring in the projected importer demand gap that is currently unmet and could be potential opportunity, it identifies the potential for the Exporter (Country) among 190 countries, against the general trade analysis, which identifies the biggest importer or exporter.
To discover high-growth global markets and optimize your business strategy:
Click Here
Pricing
- Single User License$ 1,995
- Department License$ 2,400
- Site License$ 3,120
- Global License$ 3,795

Search
Thought Leadership and Analyst Meet


Our Clients
Latest Reports
- Canada Cloud CFD Market (2026-2032) | Size & Revenue, Industry, Growth, Competitive Landscape, Forecast, Segmentation, Value, Outlook, Trends, Share, Analysis, Companies
- Taiwan Food Delivery Platform Market (2026-2032) | Companies, Outlook, Analysis, Trends, Value, Revenue, Segmentation, Share, Forecast, Competitive Landscape, Growth, Size & Forecast
- United Kingdom (UK) Long-term Care Insurance Market (2026-2032) | Growth, Share, Consumer Insights, Drivers, Opportunities, Competition, Pricing Analysis, Segments, Restraints, Companies, Competitive, Value, Outlook, Size, Demand, Analysis, Challenges, Strategic Insights, Investment Trends, Revenue, Trends, Supply, Forecast
- United Kingdom (UK) Long Term Care Market (2026-2032) | Companies, Outlook, Analysis, Trends, Value, Revenue, Segmentation, Share, Forecast, Competitive Landscape, Growth, Size & Forecast
- Iraq Insulation and Waterproofing Market (2026-2032) | Outlook, Drivers, Growth, Size, Share, Industry, Revenue, Trends, Demand, Competitive, Strategic Insights, Opportunities, Segments, Companies, Challenges, Strategy, Consumer Insights, Analysis, Investment Trends, Value, Segmentation, Forecast, Restraints
- India Switchgear Market Outlook (2026-2032) | Size, Share, Trends, Growth, Revenue, Forecast, Analysis, Value, Outlook
- Pakistan Contraceptive Implants Market (2025-2031) | Demand, Growth, Size, Share, Industry, Pricing Analysis, Competitive, Strategic Insights, Strategy, Consumer Insights, Analysis, Investment Trends, Opportunities, Revenue, Segments, Value, Segmentation, Supply, Forecast, Restraints, Outlook, Competition, Drivers, Trends, Companies, Challenges
- Sri Lanka Packaging Market (2026-2032) | Outlook, Competition, Drivers, Trends, Demand, Pricing Analysis, Competitive, Strategic Insights, Companies, Challenges, Strategy, Consumer Insights, Analysis, Investment Trends, Opportunities, Growth, Size, Share, Industry, Revenue, Segments, Value, Segmentation, Supply, Forecast, Restraints
- India Kids Watches Market (2026-2032) | Strategy, Consumer Insights, Analysis, Investment Trends, Opportunities, Growth, Size, Share, Industry, Revenue, Segments, Value, Segmentation, Supply, Forecast, Restraints, Outlook, Competition, Drivers, Trends, Demand, Pricing Analysis, Competitive, Strategic Insights, Companies, Challenges
- Saudi Arabia Core Assurance Service Market (2025-2031) | Strategy, Consumer Insights, Analysis, Investment Trends, Opportunities, Growth, Size, Share, Industry, Revenue, Segments, Value, Segmentation, Supply, Forecast, Restraints, Outlook, Competition, Drivers, Trends, Demand, Pricing Analysis, Competitive, Strategic Insights, Companies, Challenges
Industry Events and Analyst Meet

India EV Show 2026

EV tech India Expo 2026

Auto Tech Asia 2026

Battery Tech India 2026

Smart Production Solutions Guangzhou 2026
Whitepaper
- Middle East & Africa Commercial Security Market Click here to view more.
- Middle East & Africa Fire Safety Systems & Equipment Market Click here to view more.
- GCC Drone Market Click here to view more.
- Middle East Lighting Fixture Market Click here to view more.
- GCC Physical & Perimeter Security Market Click here to view more.
6WResearch In News
- Doha a strategic location for EV manufacturing hub: IPA Qatar
- Demand for luxury TVs surging in the GCC, says Samsung
- Empowering Growth: The Thriving Journey of Bangladesh’s Cable Industry
- Demand for luxury TVs surging in the GCC, says Samsung
- Video call with a traditional healer? Once unthinkable, it’s now common in South Africa
- Intelligent Buildings To Smooth GCC’s Path To Net Zero