Indonesia Rennet Market (2026-2032) Outlook | Analysis, Companies, Industry, Trends, Value, Growth, Revenue, Share, Size, Forecast
Market Forecast By Type (Animal-derived Rennet, Microbial Rennet, Fermentation Produced Chymosin Rennet, Vegetable Rennet), By Form (Liquid, Powder, Paste), By End-Users (Food & Beverages, Pharmaceuticals, Industrial, Chemicals, Others), By Sales Channel (Online, Offline) And Competitive Landscape
| Product Code: ETC235588 | Publication Date: Aug 2023 | Updated Date: Mar 2026 | Product Type: Market Research Report | |
| Publisher: 6Wresearch | Author: Ravi Bhandari | No. of Pages: 75 | No. of Figures: 35 | No. of Tables: 20 |
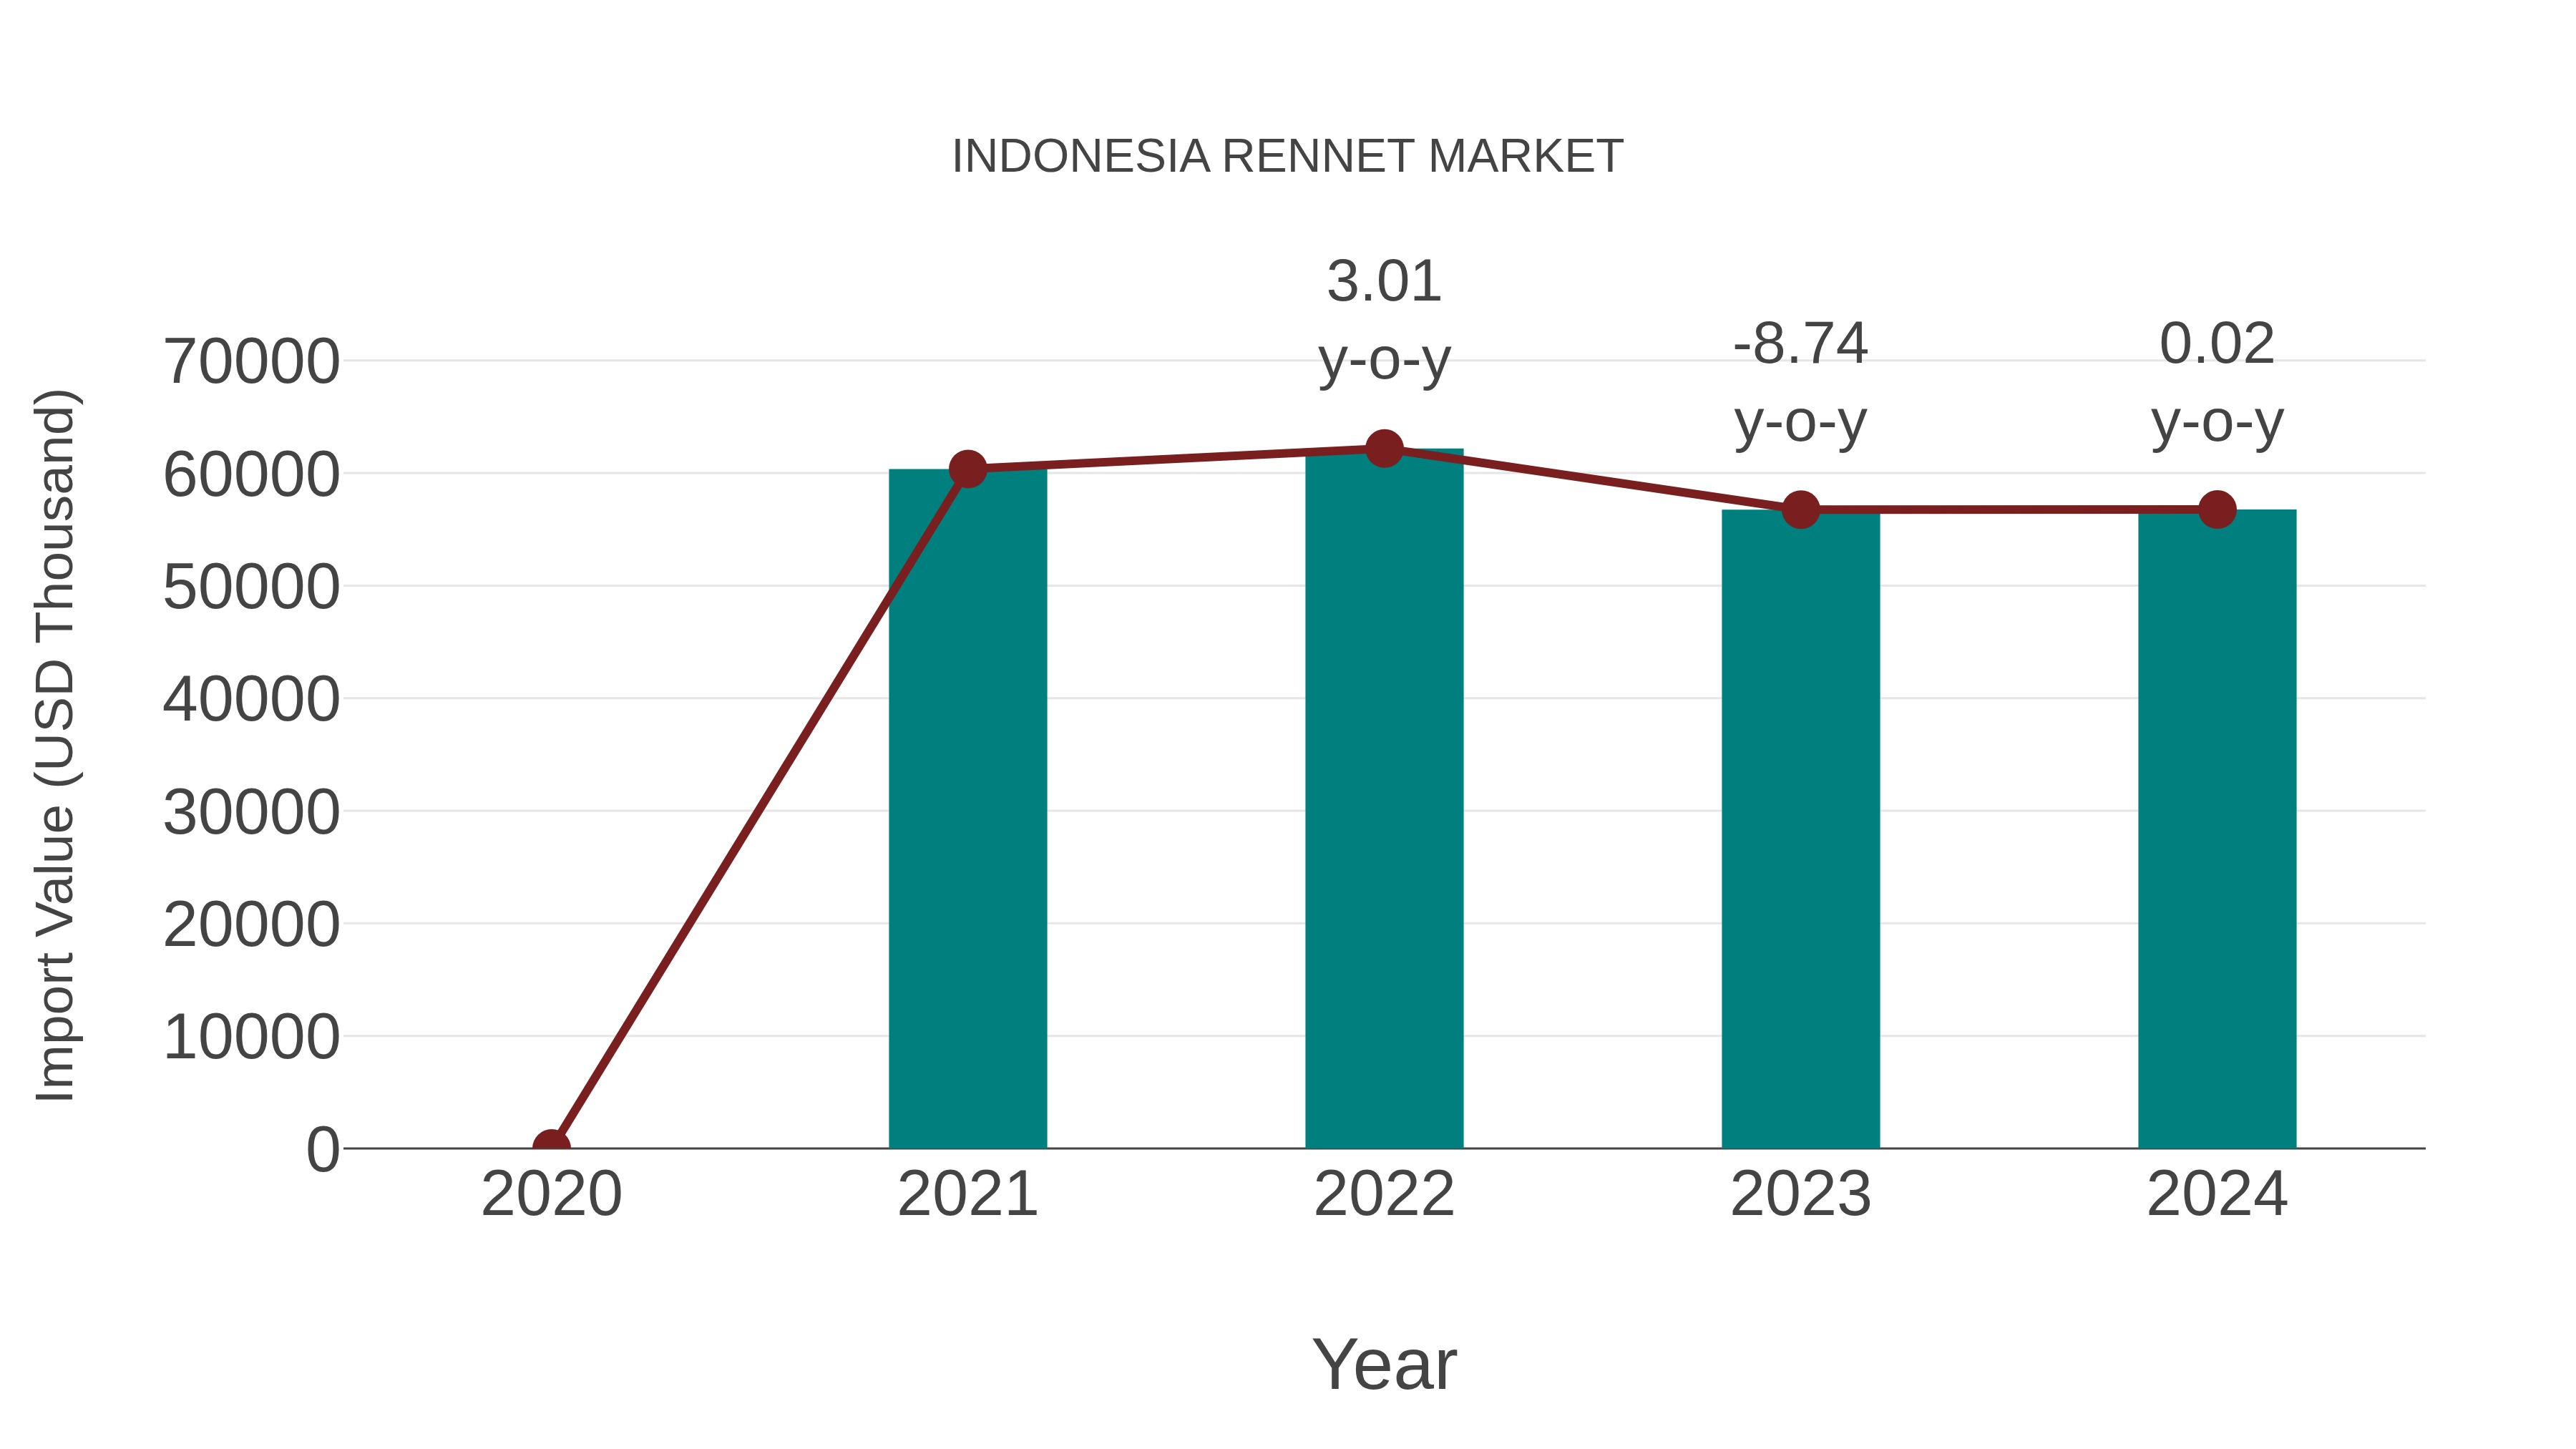
Indonesia Rennet Market: Import Trend Analysis
In 2024, Indonesia`s import trend for rennet showed minimal growth, with a rate of 0.02%, following a compound annual growth rate (CAGR) of -2.03% from 2020 to 2023. This decline in CAGR may be attributed to shifts in consumer preferences towards alternative products or changes in trade policies affecting the market`s stability.
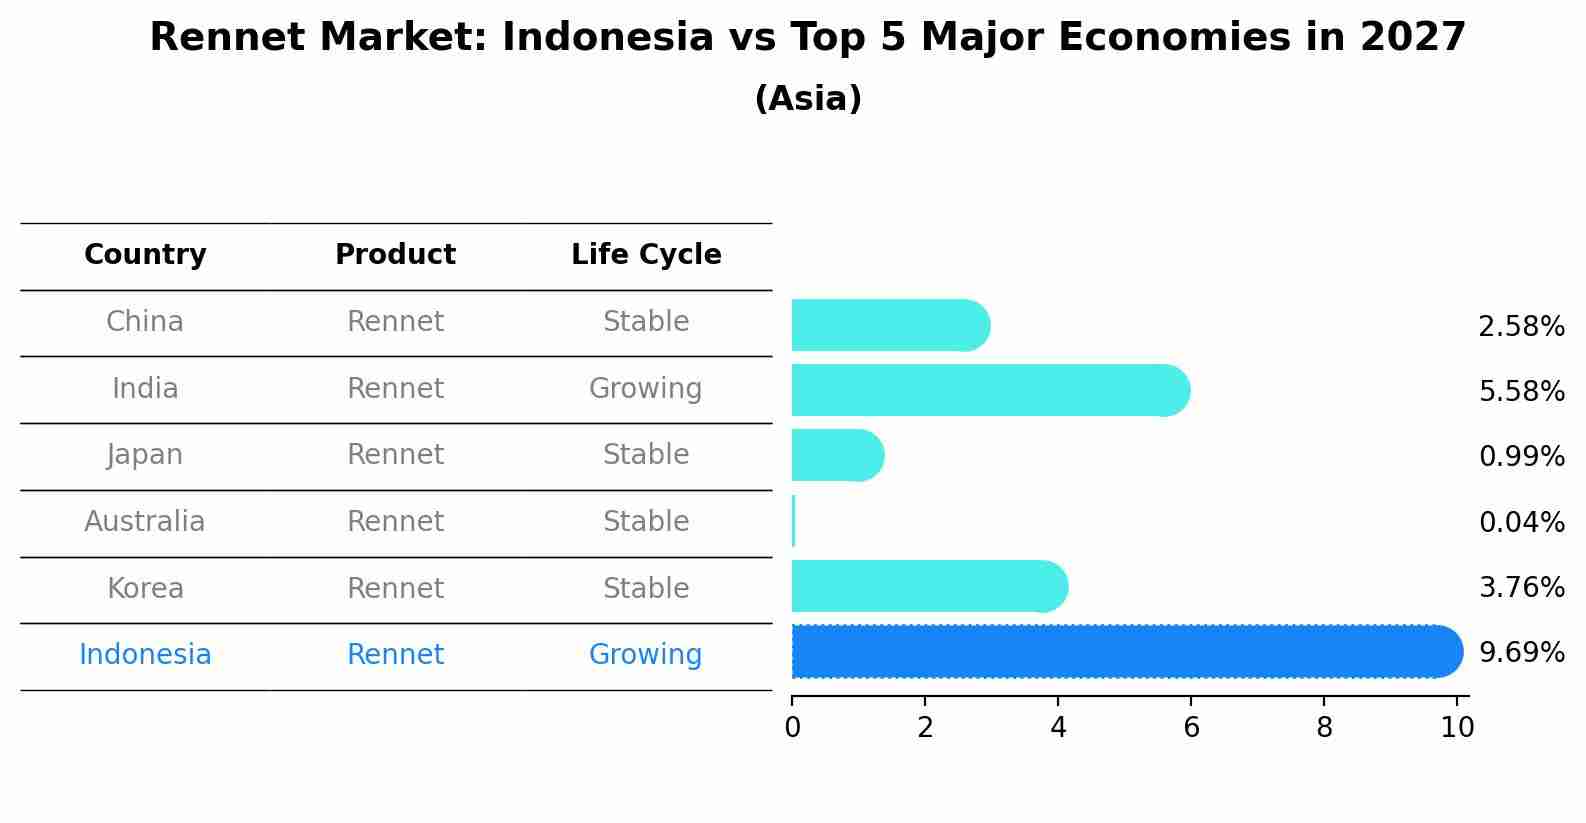
Rennet Market: Indonesia vs Top 5 Major Economies in 2027 (Asia)
By 2027, the Rennet market in Indonesia is anticipated to reach a growth rate of 9.69%, as part of an increasingly competitive Asia region, where China remains at the forefront, supported by India, Japan, Australia and South Korea, driving innovations and market adoption across sectors.
Indonesia Rennet Market Synopsis
In the food industry, the rennet market shows potential growth due to the country`s rich dairy tradition and increasing consumption of dairy products. Rennet, a vital enzyme in cheese-making, is likely to experience rising demand from the dairy processing sector.
Drivers of the Market
In the food and beverage industry, the Indonesia rennet market is anticipated to witness growth due to the rising demand for cheese and dairy products. Rennet is a crucial ingredient in cheese production, and as the consumption of cheese increases in the country, so does the demand for rennet.
Challenges of the Market
The rennet market in Indonesia faces challenges related to the sourcing of raw materials and maintaining consistent quality. Rennet, an enzyme used in the cheese-making process, is primarily derived from animal sources, and the industry must navigate ethical and sustainability concerns associated with its production. As consumers become more conscious of animal welfare, manufacturers and producers need to find viable alternatives or adopt more sustainable practices.
COVID-19 Impact on the Market
Rennet is an essential enzyme used in cheese production, and the Indonesia Rennet market has been influenced by the country`s dairy and food processing industries. The market faced challenges during the pandemic due to disruptions in the supply chain and logistical constraints. However, as the food and dairy sectors recover with the easing of restrictions, the demand for rennet is expected to rebound.
Key Highlights of the Report:
- Indonesia Rennet Market Outlook
- Market Size of Indonesia Rennet Market, 2025
- Forecast of Indonesia Rennet Market, 2032
- Historical Data and Forecast of Indonesia Rennet Revenues & Volume for the Period 2022-2032F
- Indonesia Rennet Market Trend Evolution
- Indonesia Rennet Market Drivers and Challenges
- Indonesia Rennet Price Trends
- Indonesia Rennet Porter's Five Forces
- Indonesia Rennet Industry Life Cycle
- Historical Data and Forecast of Indonesia Rennet Market Revenues & Volume By Type for the Period 2022-2032F
- Historical Data and Forecast of Indonesia Rennet Market Revenues & Volume By Animal-derived Rennet for the Period 2022-2032F
- Historical Data and Forecast of Indonesia Rennet Market Revenues & Volume By Microbial Rennet for the Period 2022-2032F
- Historical Data and Forecast of Indonesia Rennet Market Revenues & Volume By Fermentation Produced Chymosin Rennet for the Period 2022-2032F
- Historical Data and Forecast of Indonesia Rennet Market Revenues & Volume By Vegetable Rennet for the Period 2022-2032F
- Historical Data and Forecast of Indonesia Rennet Market Revenues & Volume By Form for the Period 2022-2032F
- Historical Data and Forecast of Indonesia Rennet Market Revenues & Volume By Liquid for the Period 2022-2032F
- Historical Data and Forecast of Indonesia Rennet Market Revenues & Volume By Powder for the Period 2022-2032F
- Historical Data and Forecast of Indonesia Rennet Market Revenues & Volume By Paste for the Period 2022-2032F
- Historical Data and Forecast of Indonesia Rennet Market Revenues & Volume By End-Users for the Period 2022-2032F
- Historical Data and Forecast of Indonesia Rennet Market Revenues & Volume By Food & Beverages for the Period 2022-2032F
- Historical Data and Forecast of Indonesia Rennet Market Revenues & Volume By Pharmaceuticals for the Period 2022-2032F
- Historical Data and Forecast of Indonesia Rennet Market Revenues & Volume By Industrial for the Period 2022-2032F
- Historical Data and Forecast of Indonesia Rennet Market Revenues & Volume By Chemicals for the Period 2022-2032F
- Historical Data and Forecast of Indonesia Rennet Market Revenues & Volume By Others for the Period 2022-2032F
- Historical Data and Forecast of Indonesia Rennet Market Revenues & Volume By Sales Channel for the Period 2022-2032F
- Historical Data and Forecast of Indonesia Rennet Market Revenues & Volume By Online for the Period 2022-2032F
- Historical Data and Forecast of Indonesia Rennet Market Revenues & Volume By Offline for the Period 2022-2032F
- Indonesia Rennet Import Export Trade Statistics
- Market Opportunity Assessment By Type
- Market Opportunity Assessment By Form
- Market Opportunity Assessment By End-Users
- Market Opportunity Assessment By Sales Channel
- Indonesia Rennet Top Companies Market Share
- Indonesia Rennet Competitive Benchmarking By Technical and Operational Parameters
- Indonesia Rennet Company Profiles
- Indonesia Rennet Key Strategic Recommendations
Indonesia Rennet Market (2026-2032): FAQs
6Wresearch actively monitors the Indonesia Rennet Market and publishes its comprehensive annual report, highlighting emerging trends, growth drivers, revenue analysis, and forecast outlook. Our insights help businesses to make data-backed strategic decisions with ongoing market dynamics. Our analysts track relevent industries related to the Indonesia Rennet Market, allowing our clients with actionable intelligence and reliable forecasts tailored to emerging regional needs.
Yes, we provide customisation as per your requirements. To learn more, feel free to contact us on sales@6wresearch.com
1 Executive Summary |
2 Introduction |
2.1 Key Highlights of the Report |
2.2 Report Description |
2.3 Market Scope & Segmentation |
2.4 Research Methodology |
2.5 Assumptions |
3 Indonesia Rennet Market Overview |
3.1 Indonesia Country Macro Economic Indicators |
3.2 Indonesia Rennet Market Revenues & Volume, 2022 & 2032F |
3.3 Indonesia Rennet Market - Industry Life Cycle |
3.4 Indonesia Rennet Market - Porter's Five Forces |
3.5 Indonesia Rennet Market Revenues & Volume Share, By Type, 2022 & 2032F |
3.6 Indonesia Rennet Market Revenues & Volume Share, By Form, 2022 & 2032F |
3.7 Indonesia Rennet Market Revenues & Volume Share, By End-Users, 2022 & 2032F |
3.8 Indonesia Rennet Market Revenues & Volume Share, By Sales Channel, 2022 & 2032F |
4 Indonesia Rennet Market Dynamics |
4.1 Impact Analysis |
4.2 Market Drivers |
4.2.1 Increasing demand for dairy products in Indonesia |
4.2.2 Growth in the food processing industry |
4.2.3 Rising disposable income leading to higher spending on premium food products |
4.3 Market Restraints |
4.3.1 Fluctuating prices of raw materials |
4.3.2 Intense competition from substitute products |
4.3.3 Regulatory challenges in the food industry |
5 Indonesia Rennet Market Trends |
6 Indonesia Rennet Market, By Types |
6.1 Indonesia Rennet Market, By Type |
6.1.1 Overview and Analysis |
6.1.2 Indonesia Rennet Market Revenues & Volume, By Type, 2022-2032F |
6.1.3 Indonesia Rennet Market Revenues & Volume, By Animal-derived Rennet, 2022-2032F |
6.1.4 Indonesia Rennet Market Revenues & Volume, By Microbial Rennet, 2022-2032F |
6.1.5 Indonesia Rennet Market Revenues & Volume, By Fermentation Produced Chymosin Rennet, 2022-2032F |
6.1.6 Indonesia Rennet Market Revenues & Volume, By Vegetable Rennet, 2022-2032F |
6.2 Indonesia Rennet Market, By Form |
6.2.1 Overview and Analysis |
6.2.2 Indonesia Rennet Market Revenues & Volume, By Liquid, 2022-2032F |
6.2.3 Indonesia Rennet Market Revenues & Volume, By Powder, 2022-2032F |
6.2.4 Indonesia Rennet Market Revenues & Volume, By Paste, 2022-2032F |
6.3 Indonesia Rennet Market, By End-Users |
6.3.1 Overview and Analysis |
6.3.2 Indonesia Rennet Market Revenues & Volume, By Food & Beverages, 2022-2032F |
6.3.3 Indonesia Rennet Market Revenues & Volume, By Pharmaceuticals, 2022-2032F |
6.3.4 Indonesia Rennet Market Revenues & Volume, By Industrial, 2022-2032F |
6.3.5 Indonesia Rennet Market Revenues & Volume, By Chemicals, 2022-2032F |
6.3.6 Indonesia Rennet Market Revenues & Volume, By Others, 2022-2032F |
6.4 Indonesia Rennet Market, By Sales Channel |
6.4.1 Overview and Analysis |
6.4.2 Indonesia Rennet Market Revenues & Volume, By Online, 2022-2032F |
6.4.3 Indonesia Rennet Market Revenues & Volume, By Offline, 2022-2032F |
7 Indonesia Rennet Market Import-Export Trade Statistics |
7.1 Indonesia Rennet Market Export to Major Countries |
7.2 Indonesia Rennet Market Imports from Major Countries |
8 Indonesia Rennet Market Key Performance Indicators |
8.1 Consumer awareness and perception of rennet in Indonesia |
8.2 Adoption rate of rennet in food processing applications |
8.3 Number of new product launches incorporating rennet in the market |
9 Indonesia Rennet Market - Opportunity Assessment |
9.1 Indonesia Rennet Market Opportunity Assessment, By Type, 2022 & 2032F |
9.2 Indonesia Rennet Market Opportunity Assessment, By Form, 2022 & 2032F |
9.3 Indonesia Rennet Market Opportunity Assessment, By End-Users, 2022 & 2032F |
9.4 Indonesia Rennet Market Opportunity Assessment, By Sales Channel, 2022 & 2032F |
10 Indonesia Rennet Market - Competitive Landscape |
10.1 Indonesia Rennet Market Revenue Share, By Companies, 2025 |
10.2 Indonesia Rennet Market Competitive Benchmarking, By Operating and Technical Parameters |
11 Company Profiles |
12 Recommendations |
13 Disclaimer |
Export potential assessment - trade Analytics for 2030
Export potential enables firms to identify high-growth global markets with greater confidence by combining advanced trade intelligence with a structured quantitative methodology. The framework analyzes emerging demand trends and country-level import patterns while integrating macroeconomic and trade datasets such as GDP and population forecasts, bilateral import–export flows, tariff structures, elasticity differentials between developed and developing economies, geographic distance, and import demand projections. Using weighted trade values from 2020–2024 as the base period to project country-to-country export potential for 2030, these inputs are operationalized through calculated drivers such as gravity model parameters, tariff impact factors, and projected GDP per-capita growth. Through an analysis of hidden potentials, demand hotspots, and market conditions that are most favorable to success, this method enables firms to focus on target countries, maximize returns, and global expansion with data, backed by accuracy.
By factoring in the projected importer demand gap that is currently unmet and could be potential opportunity, it identifies the potential for the Exporter (Country) among 190 countries, against the general trade analysis, which identifies the biggest importer or exporter.
To discover high-growth global markets and optimize your business strategy:
Click Here
Pricing
- Single User License$ 1,995
- Department License$ 2,400
- Site License$ 3,120
- Global License$ 3,795

Search
Thought Leadership and Analyst Meet


Our Clients
Latest Reports
- France Thermally Conductive Filler Dispersants Market (2026-2032) | Challenges, Restraints, Value, Share, Size, segmentation, Analysis, Trends, Investment Opportunities, Outlook, Pricing, Demand, Forecast, Revenue, Companies, Growth, Drivers, Strategy, Insights, Competition
- Egypt Thermally Conductive Filler Dispersants Market (2026-2032) | Competition, Forecast, Strategy, Value, Insights, Outlook, Investment Opportunities, Pricing, Demand, Share, segmentation, Drivers, Size, Companies, Restraints, Growth, Trends, Revenue, Challenges, Analysis
- Czech Republic Thermally Conductive Filler Dispersants Market (2026-2032) | Forecast, Pricing, Analysis, Drivers, Insights, Size, Demand, Growth, Challenges, segmentation, Competition, Outlook, Trends, Investment Opportunities, Companies, Strategy, Revenue, Share, Value, Restraints
- Colombia Thermally Conductive Filler Dispersants Market (2026-2032) | segmentation, Trends, Share, Drivers, Strategy, Companies, Demand, Insights, Size, Challenges, Value, Competition, Analysis, Growth, Revenue, Restraints, Forecast, Pricing, Outlook, Investment Opportunities
- China Thermally Conductive Filler Dispersants Market (2026-2032) | Restraints, Investment Opportunities, Pricing, Companies, Share, Size, Challenges, Trends, Outlook, Value, Analysis, Competition, Revenue, Drivers, Forecast, Demand, Insights, Growth, Strategy, segmentation
- Chile Thermally Conductive Filler Dispersants Market (2026-2032) | Investment Opportunities, Trends, Value, Restraints, Share, Companies, Forecast, segmentation, Pricing, Challenges, Demand, Size, Analysis, Drivers, Outlook, Growth, Competition, Strategy, Revenue, Insights
- Cambodia Thermally Conductive Filler Dispersants Market (2026-2032) | Analysis, Share, Outlook, Strategy, Pricing, Demand, Size, Growth, segmentation, Insights, Revenue, Forecast, Challenges, Competition, Companies, Investment Opportunities, Trends, Restraints, Value, Drivers
- Brazil Thermally Conductive Filler Dispersants Market (2026-2032) | Restraints, Forecast, Competition, Size, Revenue, Value, Investment Opportunities, Trends, Insights, Outlook, Growth, Analysis, Drivers, segmentation, Pricing, Challenges, Strategy, Share, Companies, Demand
- Bangladesh Thermally Conductive Filler Dispersants Market (2026-2032) | Restraints, Trends, Analysis, Competition, Insights, Forecast, Value, Investment Opportunities, Pricing, Share, Demand, Outlook, Revenue, segmentation, Companies, Drivers, Growth, Size, Challenges, Strategy
- Bahrain Thermally Conductive Filler Dispersants Market (2026-2032) | Trends, Outlook, Pricing, Demand, Value, Competition, Forecast, Growth, segmentation, Revenue, Companies, Analysis, Insights, Size, Drivers, Challenges, Strategy, Investment Opportunities, Share, Restraints
Industry Events and Analyst Meet

HIMTEX 2026

India Refining Summit 2026

India EV Show 2026

EV tech India Expo 2026

Auto Tech Asia 2026
Whitepaper
- Middle East & Africa Commercial Security Market Click here to view more.
- Middle East & Africa Fire Safety Systems & Equipment Market Click here to view more.
- GCC Drone Market Click here to view more.
- Middle East Lighting Fixture Market Click here to view more.
- GCC Physical & Perimeter Security Market Click here to view more.
6WResearch In News
- Doha a strategic location for EV manufacturing hub: IPA Qatar
- Demand for luxury TVs surging in the GCC, says Samsung
- Empowering Growth: The Thriving Journey of Bangladesh’s Cable Industry
- Demand for luxury TVs surging in the GCC, says Samsung
- Video call with a traditional healer? Once unthinkable, it’s now common in South Africa
- Intelligent Buildings To Smooth GCC’s Path To Net Zero