Indonesia Smart Tyre Market (2026-2032) | Pricing Analysis, Companies, Growth, Outlook, Supply, Segments, Forecast, Analysis, Trends, Consumer Insights, Challenges, Competition, Demand, Competitive, Drivers, Opportunities, Value, Strategic Insights, Size, Industry, Segmentation, Revenue, Investment Trends, Strategy, Share, Restraints
Market Forecast By Tyre Type (AI-Powered Pressure Monitoring Tyres, Self-Inflating Smart Tyres, RFID-Embedded Smart Tyres, AI-Driven Performance Tyres, Solar-Powered Smart Tyres), By Connectivity (IoT-Enabled, Cloud-Based, NFC-Connected, AI-Powered, Renewable Energy Integrated), By AI Capabilities (Real-Time Air Pressure Tracking, Automated Air Adjustment, Anti-Theft Tracking, Speed & Grip Optimization, Energy Harvesting), By Application (Vehicle Safety, Fleet Management, Commercial Vehicles, Sports Cars, Sustainable Vehicles), By End User (Car Owners, Logistics Companies, Transport Companies, Racing Industry, Green Transport) And Competitive Landscape
| Product Code: ETC10840783 | Publication Date: Apr 2025 | Updated Date: Feb 2026 | Product Type: Market Research Report | |
| Publisher: 6Wresearch | No. of Pages: 65 | No. of Figures: 34 | No. of Tables: 19 | |
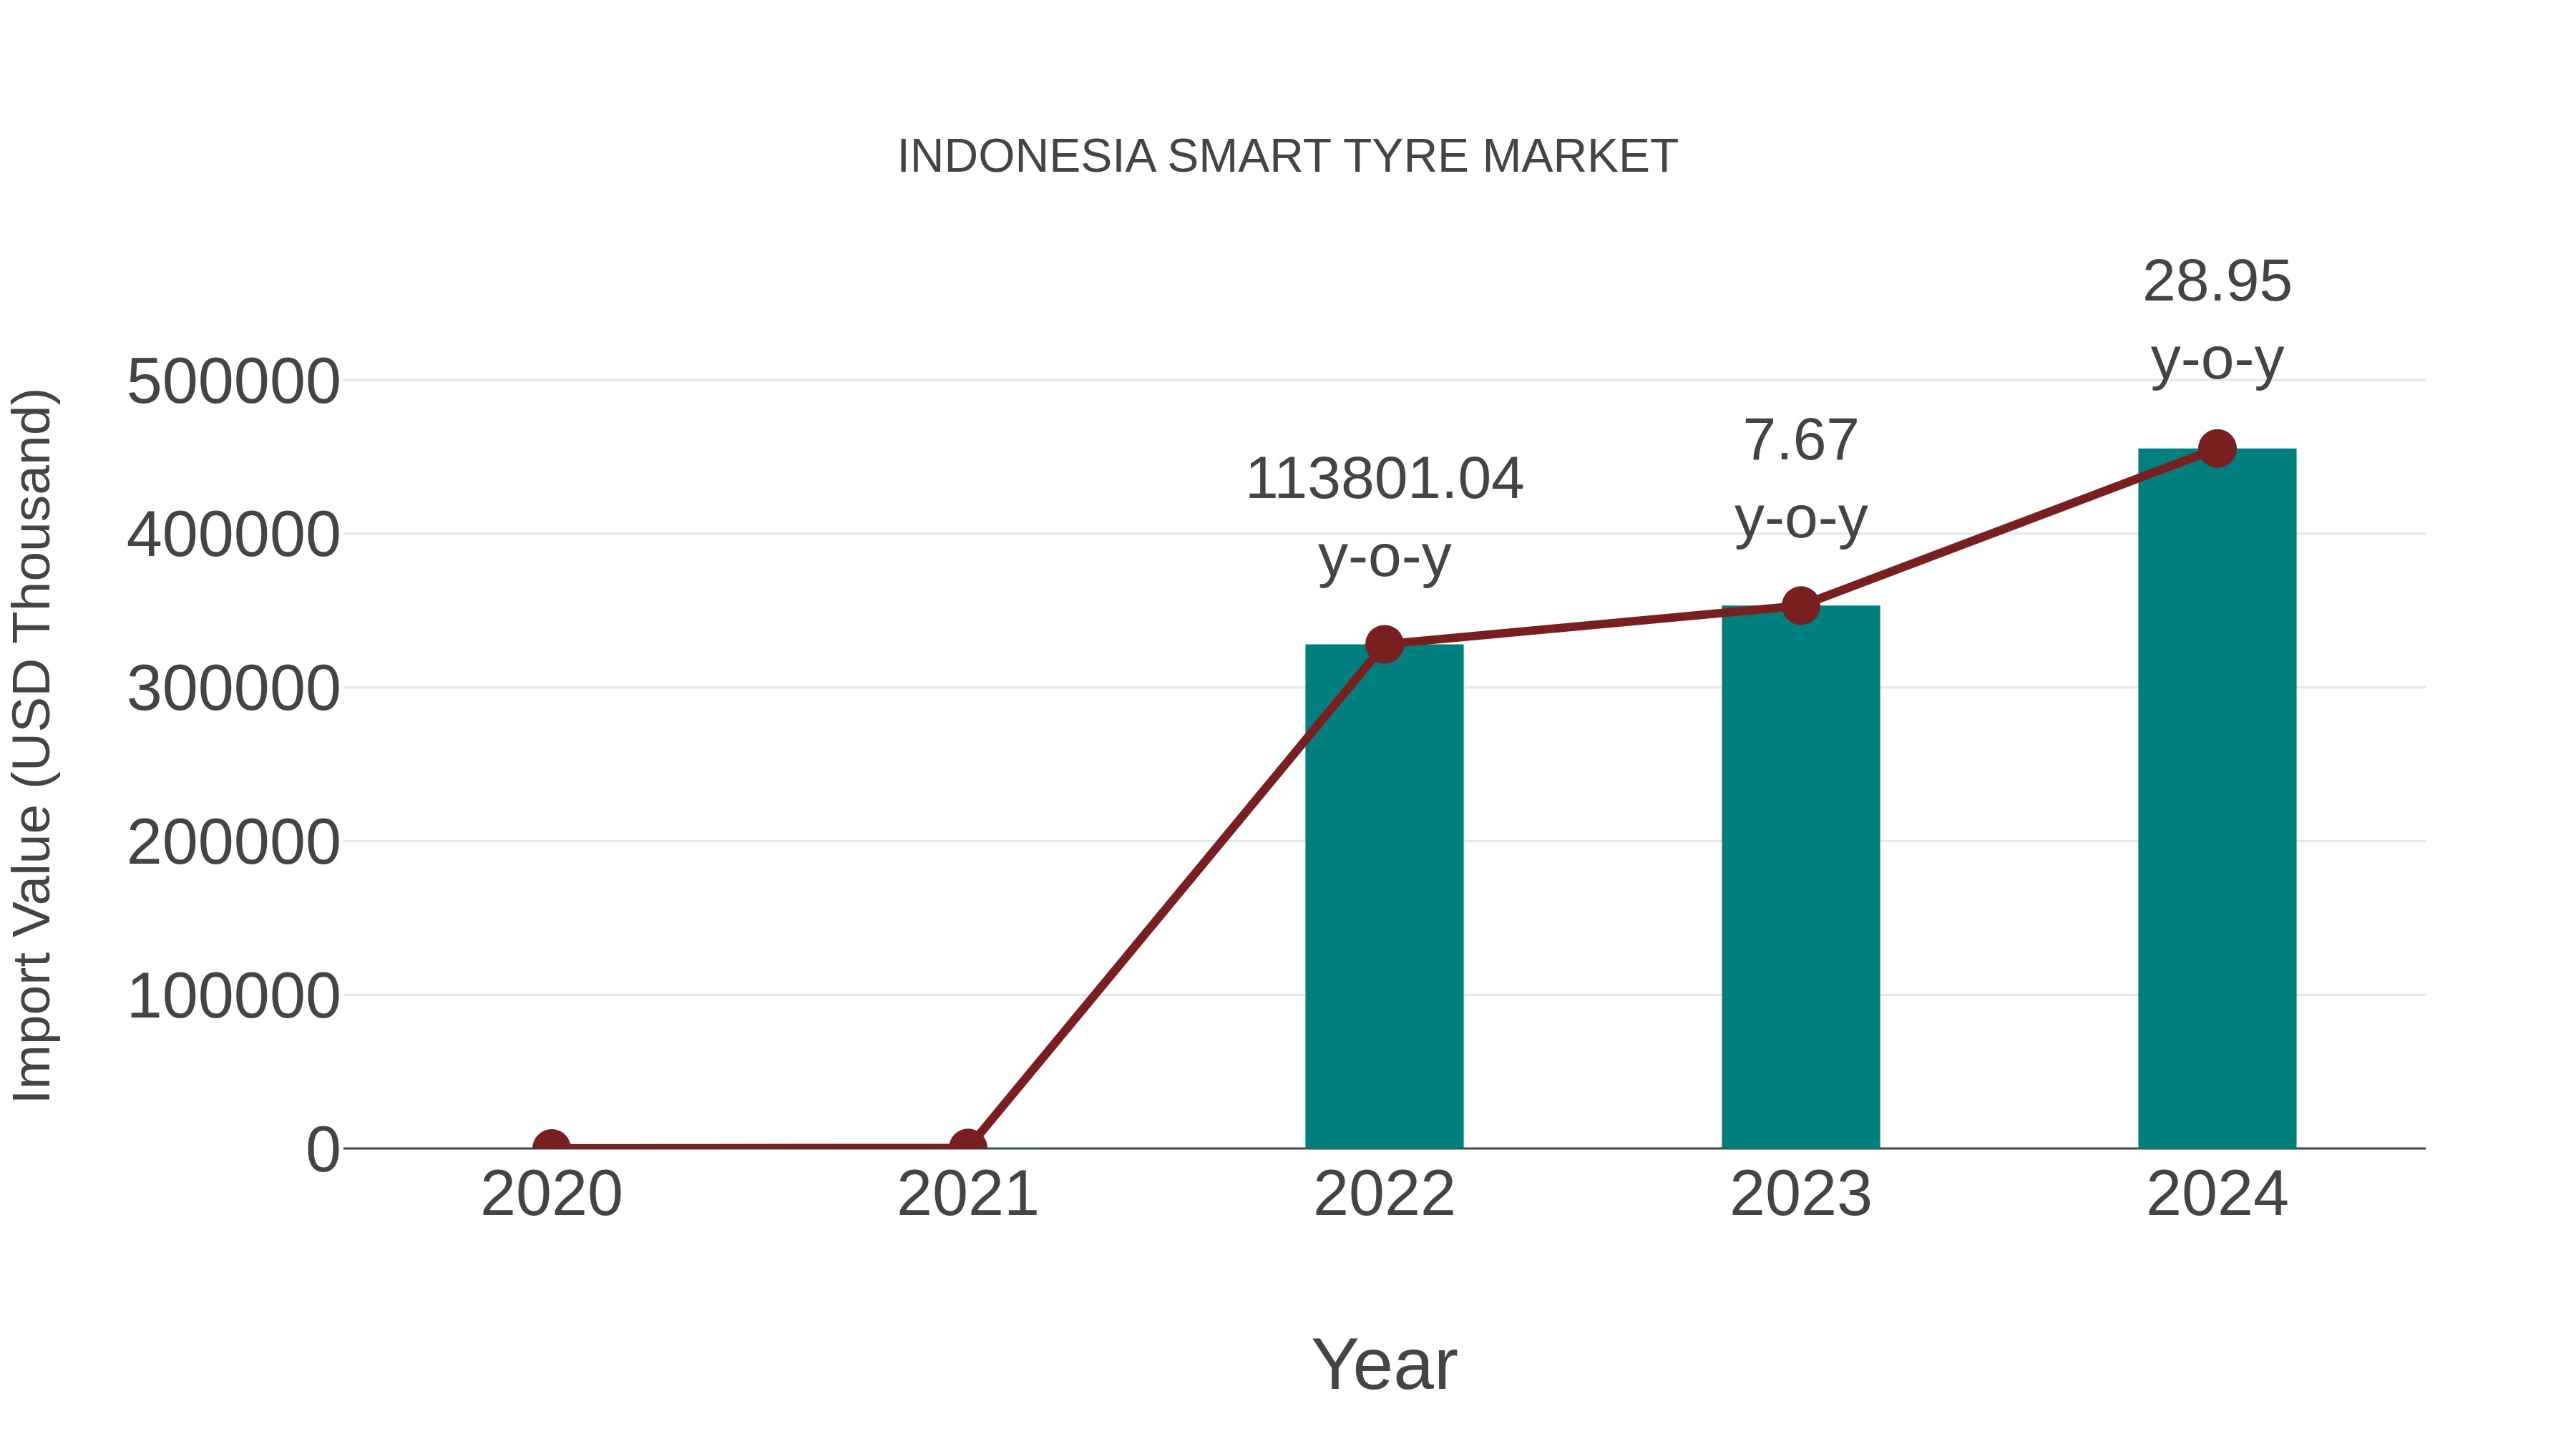
Indonesia Smart Tyre Market: Import Trend Analysis
Indonesia`s smart tyre market witnessed a notable import trend from 2023 to 2024, with a growth rate of 28.95%. The compound annual growth rate (CAGR) for imports between 2020 and 2024 stood at an impressive 1065.06%. This surge in imports could be attributed to a significant demand shift towards technologically advanced smart tyres, reflecting a growing preference for innovative automotive solutions in the market.
Key Highlights of the Report:
- Indonesia Smart Tyre Market Outlook
- Market Size of Indonesia Smart Tyre Market, 2025
- Forecast of Indonesia Smart Tyre Market, 2032
- Historical Data and Forecast of Indonesia Smart Tyre Revenues & Volume for the Period 2022-2032F
- Indonesia Smart Tyre Market Trend Evolution
- Indonesia Smart Tyre Market Drivers and Challenges
- Indonesia Smart Tyre Price Trends
- Indonesia Smart Tyre Porter's Five Forces
- Indonesia Smart Tyre Industry Life Cycle
- Historical Data and Forecast of Indonesia Smart Tyre Market Revenues & Volume By Tyre Type for the Period 2022-2032F
- Historical Data and Forecast of Indonesia Smart Tyre Market Revenues & Volume By AI-Powered Pressure Monitoring Tyres for the Period 2022-2032F
- Historical Data and Forecast of Indonesia Smart Tyre Market Revenues & Volume By Self-Inflating Smart Tyres for the Period 2022-2032F
- Historical Data and Forecast of Indonesia Smart Tyre Market Revenues & Volume By RFID-Embedded Smart Tyres for the Period 2022-2032F
- Historical Data and Forecast of Indonesia Smart Tyre Market Revenues & Volume By AI-Driven Performance Tyres for the Period 2022-2032F
- Historical Data and Forecast of Indonesia Smart Tyre Market Revenues & Volume By Solar-Powered Smart Tyres for the Period 2022 - 2032F
- Historical Data and Forecast of Indonesia Smart Tyre Market Revenues & Volume By Connectivity for the Period 2022-2032F
- Historical Data and Forecast of Indonesia Smart Tyre Market Revenues & Volume By IoT-Enabled for the Period 2022-2032F
- Historical Data and Forecast of Indonesia Smart Tyre Market Revenues & Volume By Cloud-Based for the Period 2022-2032F
- Historical Data and Forecast of Indonesia Smart Tyre Market Revenues & Volume By NFC-Connected for the Period 2022-2032F
- Historical Data and Forecast of Indonesia Smart Tyre Market Revenues & Volume By AI-Powered for the Period 2022-2032F
- Historical Data and Forecast of Indonesia Smart Tyre Market Revenues & Volume By Renewable Energy Integrated for the Period 2022 - 2032F
- Historical Data and Forecast of Indonesia Smart Tyre Market Revenues & Volume By AI Capabilities for the Period 2022-2032F
- Historical Data and Forecast of Indonesia Smart Tyre Market Revenues & Volume By Real-Time Air Pressure Tracking for the Period 2022-2032F
- Historical Data and Forecast of Indonesia Smart Tyre Market Revenues & Volume By Automated Air Adjustment for the Period 2022-2032F
- Historical Data and Forecast of Indonesia Smart Tyre Market Revenues & Volume By Anti-Theft Tracking for the Period 2022-2032F
- Historical Data and Forecast of Indonesia Smart Tyre Market Revenues & Volume By Speed & Grip Optimization for the Period 2022-2032F
- Historical Data and Forecast of Indonesia Smart Tyre Market Revenues & Volume By Energy Harvesting for the Period 2022 - 2032F
- Historical Data and Forecast of Indonesia Smart Tyre Market Revenues & Volume By Application for the Period 2022-2032F
- Historical Data and Forecast of Indonesia Smart Tyre Market Revenues & Volume By Vehicle Safety for the Period 2022-2032F
- Historical Data and Forecast of Indonesia Smart Tyre Market Revenues & Volume By Fleet Management for the Period 2022-2032F
- Historical Data and Forecast of Indonesia Smart Tyre Market Revenues & Volume By Commercial Vehicles for the Period 2022-2032F
- Historical Data and Forecast of Indonesia Smart Tyre Market Revenues & Volume By Sports Cars for the Period 2022-2032F
- Historical Data and Forecast of Indonesia Smart Tyre Market Revenues & Volume By Sustainable Vehicles for the Period 2022 - 2032F
- Historical Data and Forecast of Indonesia Smart Tyre Market Revenues & Volume By End User for the Period 2022-2032F
- Historical Data and Forecast of Indonesia Smart Tyre Market Revenues & Volume By Car Owners for the Period 2022-2032F
- Historical Data and Forecast of Indonesia Smart Tyre Market Revenues & Volume By Logistics Companies for the Period 2022-2032F
- Historical Data and Forecast of Indonesia Smart Tyre Market Revenues & Volume By Transport Companies for the Period 2022-2032F
- Historical Data and Forecast of Indonesia Smart Tyre Market Revenues & Volume By Racing Industry for the Period 2022 - 2032F
- Historical Data and Forecast of Indonesia Smart Tyre Market Revenues & Volume By Green Transport for the Period 2022 - 2032F
- Indonesia Smart Tyre Import Export Trade Statistics
- Market Opportunity Assessment By Tyre Type
- Market Opportunity Assessment By Connectivity
- Market Opportunity Assessment By AI Capabilities
- Market Opportunity Assessment By Application
- Market Opportunity Assessment By End User
- Indonesia Smart Tyre Top Companies Market Share
- Indonesia Smart Tyre Competitive Benchmarking By Technical and Operational Parameters
- Indonesia Smart Tyre Company Profiles
- Indonesia Smart Tyre Key Strategic Recommendations
Frequently Asked Questions About the Market Study (FAQs):
6Wresearch actively monitors the Indonesia Smart Tyre Market and publishes its comprehensive annual report, highlighting emerging trends, growth drivers, revenue analysis, and forecast outlook. Our insights help businesses to make data-backed strategic decisions with ongoing market dynamics. Our analysts track relevent industries related to the Indonesia Smart Tyre Market, allowing our clients with actionable intelligence and reliable forecasts tailored to emerging regional needs.
Yes, we provide customisation as per your requirements. To learn more, feel free to contact us on sales@6wresearch.com
1 Executive Summary |
2 Introduction |
2.1 Key Highlights of the Report |
2.2 Report Description |
2.3 Market Scope & Segmentation |
2.4 Research Methodology |
2.5 Assumptions |
3 Indonesia Smart Tyre Market Overview |
3.1 Indonesia Country Macro Economic Indicators |
3.2 Indonesia Smart Tyre Market Revenues & Volume, 2022 & 2032F |
3.3 Indonesia Smart Tyre Market - Industry Life Cycle |
3.4 Indonesia Smart Tyre Market - Porter's Five Forces |
3.5 Indonesia Smart Tyre Market Revenues & Volume Share, By Tyre Type, 2022 & 2032F |
3.6 Indonesia Smart Tyre Market Revenues & Volume Share, By Connectivity, 2022 & 2032F |
3.7 Indonesia Smart Tyre Market Revenues & Volume Share, By AI Capabilities, 2022 & 2032F |
3.8 Indonesia Smart Tyre Market Revenues & Volume Share, By Application, 2022 & 2032F |
3.9 Indonesia Smart Tyre Market Revenues & Volume Share, By End User, 2022 & 2032F |
4 Indonesia Smart Tyre Market Dynamics |
4.1 Impact Analysis |
4.2 Market Drivers |
4.2.1 Increasing adoption of IoT and connected technologies in the automotive industry |
4.2.2 Growing demand for advanced safety features in vehicles |
4.2.3 Focus on improving fuel efficiency and reducing carbon emissions in the transportation sector |
4.3 Market Restraints |
4.3.1 High initial costs associated with smart tyre technology |
4.3.2 Limited awareness and understanding of the benefits of smart tyres among consumers |
4.3.3 Lack of standardized regulations and guidelines for smart tyre implementation in Indonesia |
5 Indonesia Smart Tyre Market Trends |
6 Indonesia Smart Tyre Market, By Types |
6.1 Indonesia Smart Tyre Market, By Tyre Type |
6.1.1 Overview and Analysis |
6.1.2 Indonesia Smart Tyre Market Revenues & Volume, By Tyre Type, 2022 - 2032F |
6.1.3 Indonesia Smart Tyre Market Revenues & Volume, By AI-Powered Pressure Monitoring Tyres, 2022 - 2032F |
6.1.4 Indonesia Smart Tyre Market Revenues & Volume, By Self-Inflating Smart Tyres, 2022 - 2032F |
6.1.5 Indonesia Smart Tyre Market Revenues & Volume, By RFID-Embedded Smart Tyres, 2022 - 2032F |
6.1.6 Indonesia Smart Tyre Market Revenues & Volume, By AI-Driven Performance Tyres, 2022 - 2032F |
6.1.7 Indonesia Smart Tyre Market Revenues & Volume, By Solar-Powered Smart Tyres, 2022 - 2032F |
6.2 Indonesia Smart Tyre Market, By Connectivity |
6.2.1 Overview and Analysis |
6.2.2 Indonesia Smart Tyre Market Revenues & Volume, By IoT-Enabled, 2022 - 2032F |
6.2.3 Indonesia Smart Tyre Market Revenues & Volume, By Cloud-Based, 2022 - 2032F |
6.2.4 Indonesia Smart Tyre Market Revenues & Volume, By NFC-Connected, 2022 - 2032F |
6.2.5 Indonesia Smart Tyre Market Revenues & Volume, By AI-Powered, 2022 - 2032F |
6.2.6 Indonesia Smart Tyre Market Revenues & Volume, By Renewable Energy Integrated, 2022 - 2032F |
6.3 Indonesia Smart Tyre Market, By AI Capabilities |
6.3.1 Overview and Analysis |
6.3.2 Indonesia Smart Tyre Market Revenues & Volume, By Real-Time Air Pressure Tracking, 2022 - 2032F |
6.3.3 Indonesia Smart Tyre Market Revenues & Volume, By Automated Air Adjustment, 2022 - 2032F |
6.3.4 Indonesia Smart Tyre Market Revenues & Volume, By Anti-Theft Tracking, 2022 - 2032F |
6.3.5 Indonesia Smart Tyre Market Revenues & Volume, By Speed & Grip Optimization, 2022 - 2032F |
6.3.6 Indonesia Smart Tyre Market Revenues & Volume, By Energy Harvesting, 2022 - 2032F |
6.4 Indonesia Smart Tyre Market, By Application |
6.4.1 Overview and Analysis |
6.4.2 Indonesia Smart Tyre Market Revenues & Volume, By Vehicle Safety, 2022 - 2032F |
6.4.3 Indonesia Smart Tyre Market Revenues & Volume, By Fleet Management, 2022 - 2032F |
6.4.4 Indonesia Smart Tyre Market Revenues & Volume, By Commercial Vehicles, 2022 - 2032F |
6.4.5 Indonesia Smart Tyre Market Revenues & Volume, By Sports Cars, 2022 - 2032F |
6.4.6 Indonesia Smart Tyre Market Revenues & Volume, By Sustainable Vehicles, 2022 - 2032F |
6.5 Indonesia Smart Tyre Market, By End User |
6.5.1 Overview and Analysis |
6.5.2 Indonesia Smart Tyre Market Revenues & Volume, By Car Owners, 2022 - 2032F |
6.5.3 Indonesia Smart Tyre Market Revenues & Volume, By Logistics Companies, 2022 - 2032F |
6.5.4 Indonesia Smart Tyre Market Revenues & Volume, By Transport Companies, 2022 - 2032F |
6.5.5 Indonesia Smart Tyre Market Revenues & Volume, By Racing Industry, 2022 - 2032F |
6.5.6 Indonesia Smart Tyre Market Revenues & Volume, By Green Transport, 2022 - 2032F |
7 Indonesia Smart Tyre Market Import-Export Trade Statistics |
7.1 Indonesia Smart Tyre Market Export to Major Countries |
7.2 Indonesia Smart Tyre Market Imports from Major Countries |
8 Indonesia Smart Tyre Market Key Performance Indicators |
8.1 Number of vehicles equipped with smart tyre technology in Indonesia |
8.2 Percentage increase in fuel efficiency achieved through the use of smart tyres |
8.3 Rate of adoption of connected car solutions in the Indonesian automotive market |
9 Indonesia Smart Tyre Market - Opportunity Assessment |
9.1 Indonesia Smart Tyre Market Opportunity Assessment, By Tyre Type, 2022 & 2032F |
9.2 Indonesia Smart Tyre Market Opportunity Assessment, By Connectivity, 2022 & 2032F |
9.3 Indonesia Smart Tyre Market Opportunity Assessment, By AI Capabilities, 2022 & 2032F |
9.4 Indonesia Smart Tyre Market Opportunity Assessment, By Application, 2022 & 2032F |
9.5 Indonesia Smart Tyre Market Opportunity Assessment, By End User, 2022 & 2032F |
10 Indonesia Smart Tyre Market - Competitive Landscape |
10.1 Indonesia Smart Tyre Market Revenue Share, By Companies, 2025 |
10.2 Indonesia Smart Tyre Market Competitive Benchmarking, By Operating and Technical Parameters |
11 Company Profiles |
12 Recommendations |
13 Disclaimer |
Global Go To Market Strategy - 2030
Export potential enables firms to identify high-growth global markets with greater confidence by combining advanced trade intelligence with a structured quantitative methodology. The framework analyzes emerging demand trends and country-level import patterns while integrating macroeconomic and trade datasets such as GDP and population forecasts, bilateral import–export flows, tariff structures, elasticity differentials between developed and developing economies, geographic distance, and import demand projections. Using weighted trade values from 2020–2024 as the base period to project country-to-country export potential for 2030, these inputs are operationalized through calculated drivers such as gravity model parameters, tariff impact factors, and projected GDP per-capita growth. Through an analysis of hidden potentials, demand hotspots, and market conditions that are most favorable to success, this method enables firms to focus on target countries, maximize returns, and global expansion with data, backed by accuracy.
By factoring in the projected importer demand gap that is currently unmet and could be potential opportunity, it identifies the potential for the Exporter (Country) among 190 countries, against the general trade analysis, which identifies the biggest importer or exporter.
To discover high-growth global markets and optimize your business strategy:
Click Here
Pricing
- Single User License$ 1,995
- Department License$ 2,400
- Site License$ 3,120
- Global License$ 3,795

Leadership Perspectives from Industry Events
Search
Thought Leadership and Analyst Meet


Our Clients
6WResearch In News
- Doha a strategic location for EV manufacturing hub: IPA Qatar
- Demand for luxury TVs surging in the GCC, says Samsung
- Empowering Growth: The Thriving Journey of Bangladesh’s Cable Industry
- Demand for luxury TVs surging in the GCC, says Samsung
- Video call with a traditional healer? Once unthinkable, it’s now common in South Africa
- Intelligent Buildings To Smooth GCC’s Path To Net Zero
Latest Reports
- Cape Verde Portable Hand-Thrown Extinguisher Market (2026-2032)
- Canada Portable Hand-Thrown Extinguisher Market (2026-2032)
- Cameroon Portable Hand-Thrown Extinguisher Market (2026-2032)
- Burundi Portable Hand-Thrown Extinguisher Market (2026-2032)
- Burkina Faso Portable Hand-Thrown Extinguisher Market (2026-2032)
- Bulgaria Portable Hand-Thrown Extinguisher Market (2026-2032)
- Brunei Portable Hand-Thrown Extinguisher Market (2026-2032)
- Botswana Portable Hand-Thrown Extinguisher Market (2026-2032)
- Bosnia and Herzegovina Portable Hand-Thrown Extinguisher Market (2026-2032)
- Bolivia Portable Hand-Thrown Extinguisher Market (2026-2032)
Industry Events and Analyst Meet

HIMTEX 2026

India Refining Summit 2026

India EV Show 2026

EV tech India Expo 2026

Auto Tech Asia 2026
Whitepaper
- Middle East & Africa Commercial Security Market Click here to view more.
- Middle East & Africa Fire Safety Systems & Equipment Market Click here to view more.
- GCC Drone Market Click here to view more.
- Middle East Lighting Fixture Market Click here to view more.
- GCC Physical & Perimeter Security Market Click here to view more.