Indonesia Telecom Power Systems Market (2026-2032) Outlook | Revenue, Growth, Analysis, Industry, Value, Size, Forecast, Share, Trends, Companies
Market Forecast By Product (AC Power Systems, DC Power Systems, Digital Electricity), By Grid Type (On-Grid, Off-Grid, Bad-Grid), By Power Source (Diesel-Battery, Diesel-Solar, Diesel-Wind, Other Sources) And Competitive Landscape
| Product Code: ETC271708 | Publication Date: Aug 2023 | Updated Date: Mar 2026 | Product Type: Market Research Report | |
| Publisher: 6Wresearch | Author: Ravi Bhandari | No. of Pages: 75 | No. of Figures: 35 | No. of Tables: 20 |
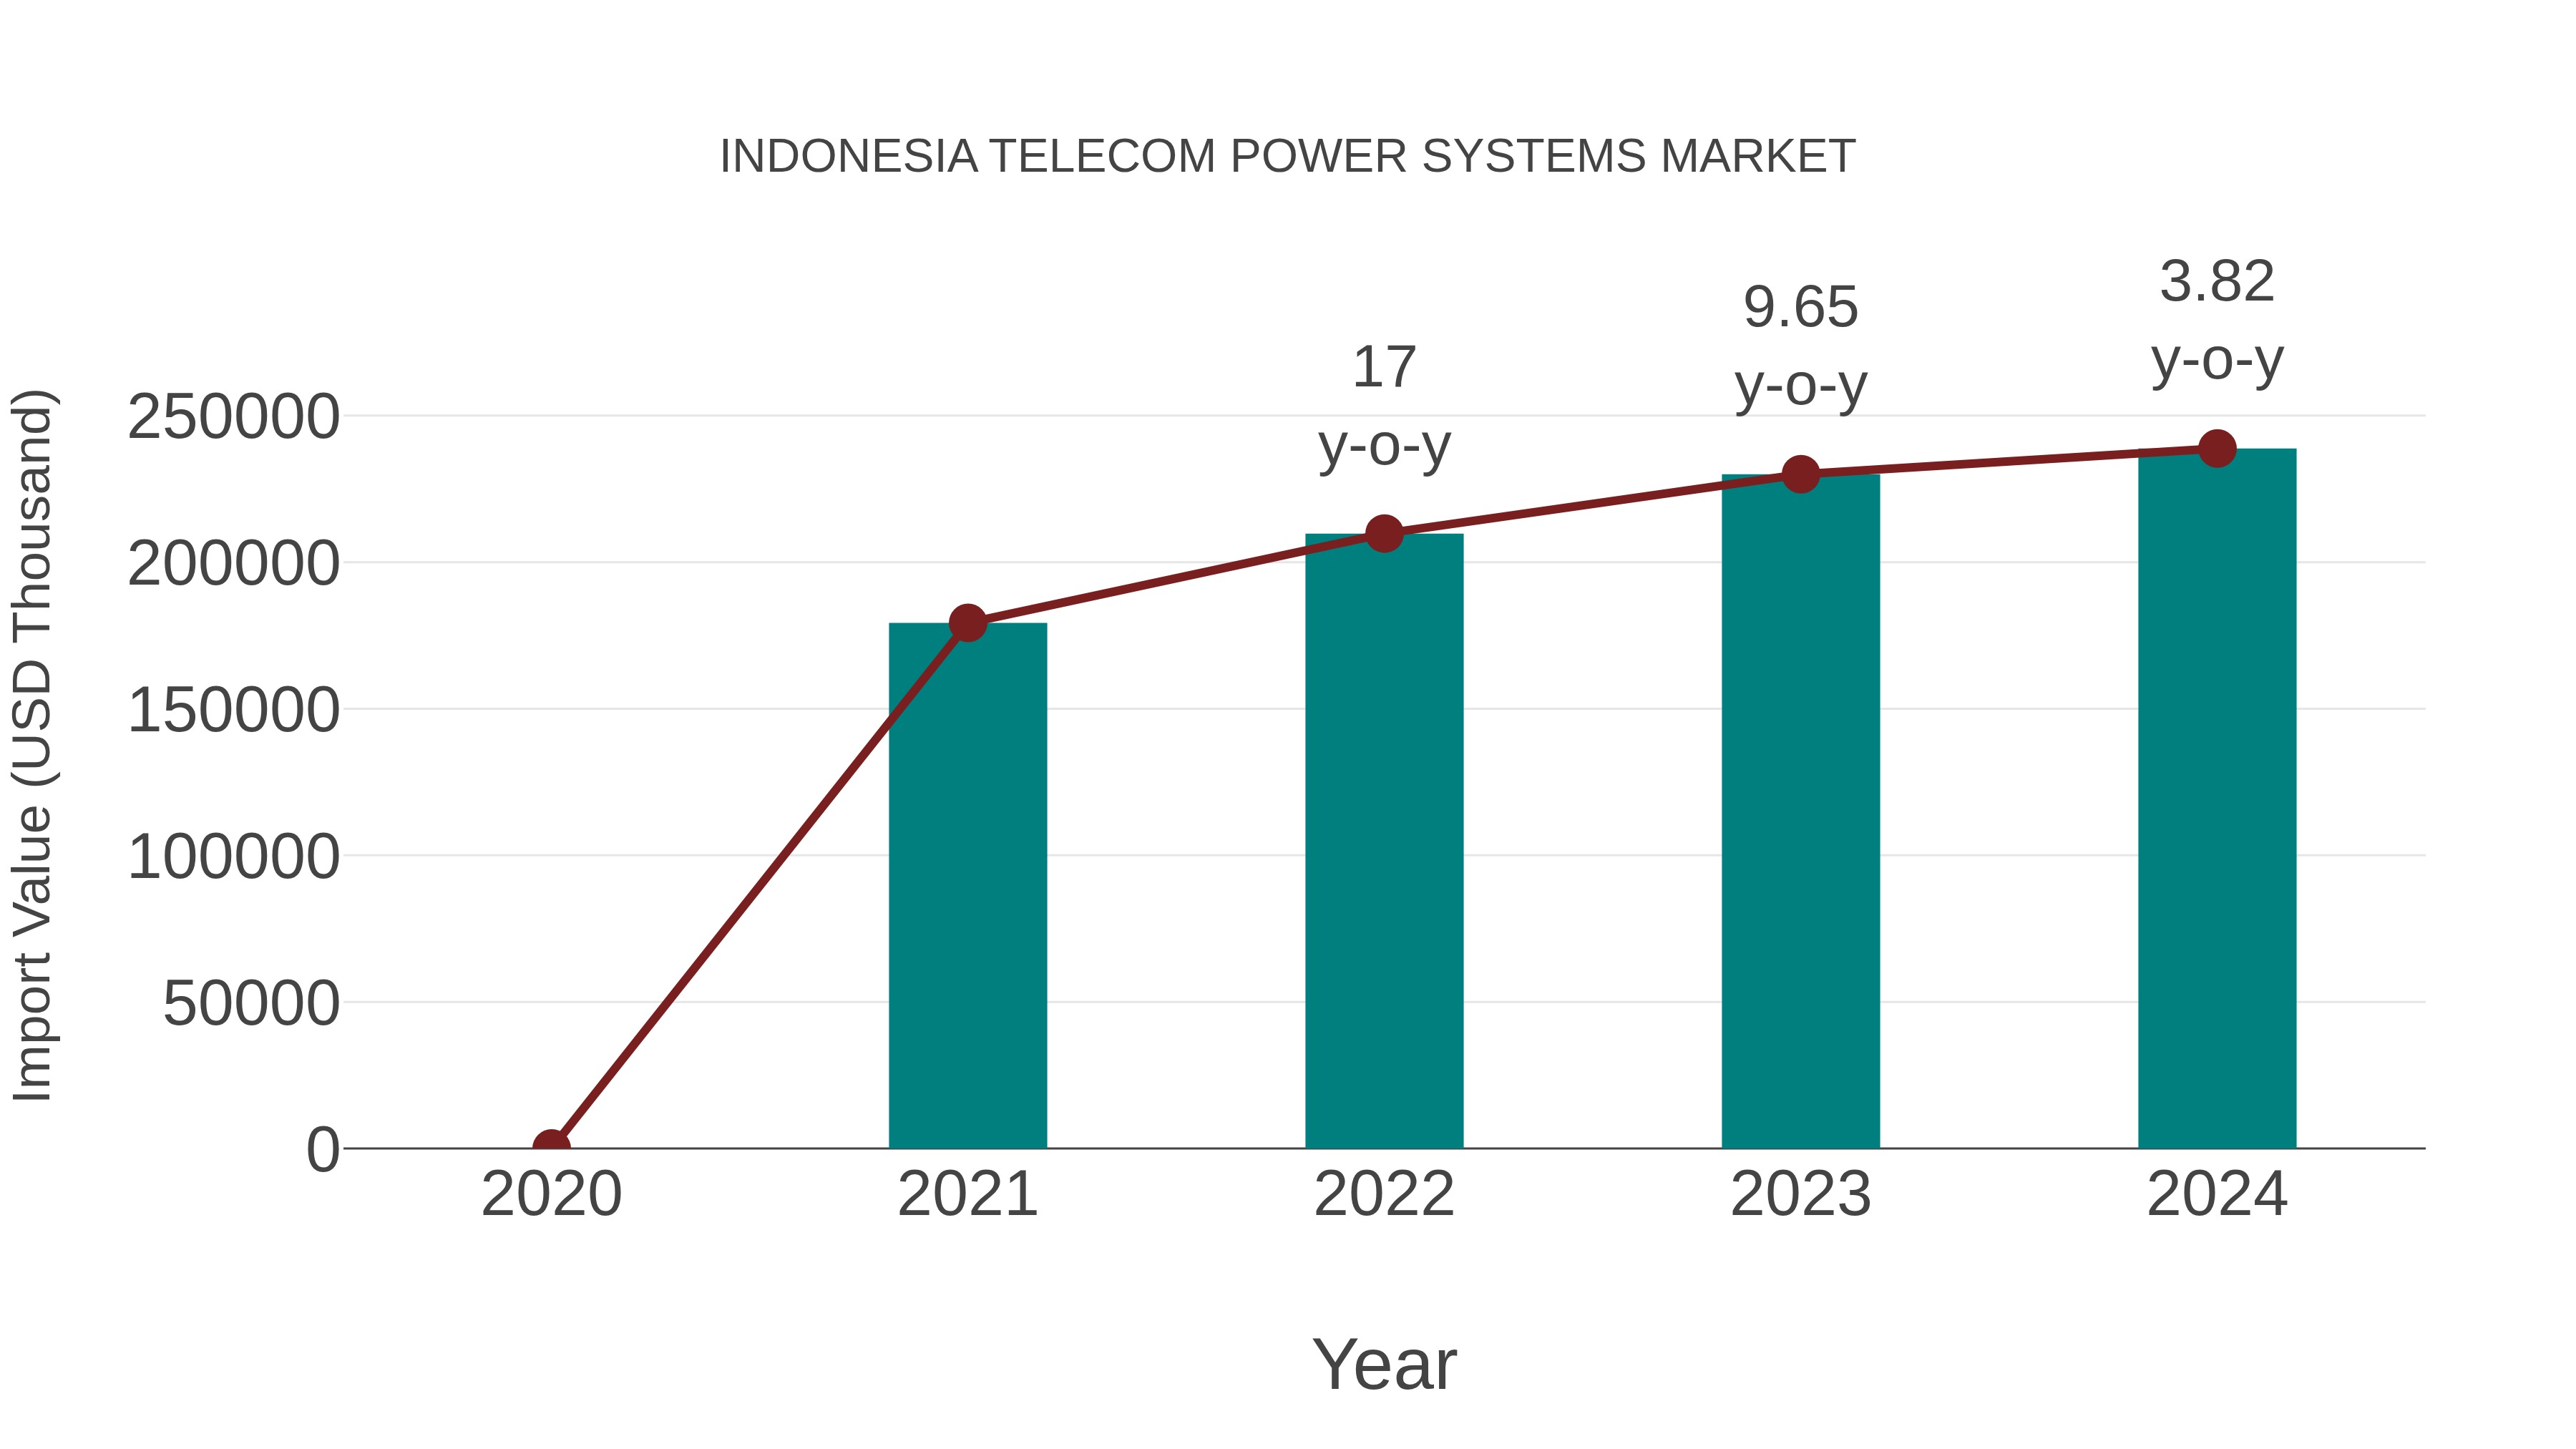
Indonesia Telecom Power Systems Market: Import Trend Analysis
In the Indonesia telecom power systems market, the import trend showed a growth rate of 3.82% from 2023 to 2024, with a compound annual growth rate (CAGR) of 10.02% from 2020 to 2024. This increase in imports can be attributed to a sustained demand shift towards advanced telecom infrastructure technologies, driving market stability and fostering trade momentum within the industry.
Indonesia Telecom Power Systems Market Synopsis
The telecom power systems market in Indonesia is expected to grow at a compound annual growth rate (CAGR) of 7. 4% during the forecast period, reaching USD 554 million by 2031. The market is driven by increasing government investments in infrastructure and rapid adoption of digital services such as mobile banking, e-commerce, and cloud computing. Moreover, the introduction of 4G/LTE networks along with various promotions from operators has boosted the demand for telecom power systems across Indonesia.
Drivers of the Market
The Telecom Power Systems market is propelled by the expansion of telecommunications infrastructure, including mobile networks and broadband services. The need for reliable power solutions to support uninterrupted communication drives the demand for telecom power systems, including backup power sources and energy-efficient solutions.
Challenges of the Market
The Indonesia Telecom Power Systems Market plays a crucial role in supporting reliable communication networks. Challenges include ensuring uninterrupted power supply, optimizing energy efficiency, and integrating renewable energy sources to reduce reliance on fossil fuels.
COVID-19 Impact on the Market
The Indonesia Telecom Power Systems Market could have experienced disruptions due to the pandemic`s impact on network expansion and upgrades. However, as remote communication became more crucial, the market might have seen increased demand for reliable power solutions for telecommunications infrastructure.
Key Highlights of the Report:
- Indonesia Telecom Power Systems Market Outlook
- Market Size of Indonesia Telecom Power Systems Market, 2025
- Forecast of Indonesia Telecom Power Systems Market, 2032
- Historical Data and Forecast of Indonesia Telecom Power Systems Revenues & Volume for the Period 2022-2032F
- Indonesia Telecom Power Systems Market Trend Evolution
- Indonesia Telecom Power Systems Market Drivers and Challenges
- Indonesia Telecom Power Systems Price Trends
- Indonesia Telecom Power Systems Porter's Five Forces
- Indonesia Telecom Power Systems Industry Life Cycle
- Historical Data and Forecast of Indonesia Telecom Power Systems Market Revenues & Volume By Product for the Period 2022-2032F
- Historical Data and Forecast of Indonesia Telecom Power Systems Market Revenues & Volume By AC Power Systems for the Period 2022-2032F
- Historical Data and Forecast of Indonesia Telecom Power Systems Market Revenues & Volume By DC Power Systems for the Period 2022-2032F
- Historical Data and Forecast of Indonesia Telecom Power Systems Market Revenues & Volume By Digital Electricity for the Period 2022-2032F
- Historical Data and Forecast of Indonesia Telecom Power Systems Market Revenues & Volume By Grid Type for the Period 2022-2032F
- Historical Data and Forecast of Indonesia Telecom Power Systems Market Revenues & Volume By On-Grid for the Period 2022-2032F
- Historical Data and Forecast of Indonesia Telecom Power Systems Market Revenues & Volume By Off-Grid for the Period 2022-2032F
- Historical Data and Forecast of Indonesia Telecom Power Systems Market Revenues & Volume By Bad-Grid for the Period 2022-2032F
- Historical Data and Forecast of Indonesia Telecom Power Systems Market Revenues & Volume By Power Source for the Period 2022-2032F
- Historical Data and Forecast of Indonesia Telecom Power Systems Market Revenues & Volume By Diesel-Battery for the Period 2022-2032F
- Historical Data and Forecast of Indonesia Telecom Power Systems Market Revenues & Volume By Diesel-Solar for the Period 2022-2032F
- Historical Data and Forecast of Indonesia Telecom Power Systems Market Revenues & Volume By Diesel-Wind for the Period 2022-2032F
- Historical Data and Forecast of Indonesia Telecom Power Systems Market Revenues & Volume By Other Sources for the Period 2022-2032F
- Indonesia Telecom Power Systems Import Export Trade Statistics
- Market Opportunity Assessment By Product
- Market Opportunity Assessment By Grid Type
- Market Opportunity Assessment By Power Source
- Indonesia Telecom Power Systems Top Companies Market Share
- Indonesia Telecom Power Systems Competitive Benchmarking By Technical and Operational Parameters
- Indonesia Telecom Power Systems Company Profiles
- Indonesia Telecom Power Systems Key Strategic Recommendations
Indonesia Telecom Power Systems Market (2026-2032): FAQs
6Wresearch actively monitors the Indonesia Telecom Power Systems Market and publishes its comprehensive annual report, highlighting emerging trends, growth drivers, revenue analysis, and forecast outlook. Our insights help businesses to make data-backed strategic decisions with ongoing market dynamics. Our analysts track relevent industries related to the Indonesia Telecom Power Systems Market, allowing our clients with actionable intelligence and reliable forecasts tailored to emerging regional needs.
Yes, we provide customisation as per your requirements. To learn more, feel free to contact us on sales@6wresearch.com
1 Executive Summary |
2 Introduction |
2.1 Key Highlights of the Report |
2.2 Report Description |
2.3 Market Scope & Segmentation |
2.4 Research Methodology |
2.5 Assumptions |
3 Indonesia Telecom Power Systems Market Overview |
3.1 Indonesia Country Macro Economic Indicators |
3.2 Indonesia Telecom Power Systems Market Revenues & Volume, 2022 & 2032F |
3.3 Indonesia Telecom Power Systems Market - Industry Life Cycle |
3.4 Indonesia Telecom Power Systems Market - Porter's Five Forces |
3.5 Indonesia Telecom Power Systems Market Revenues & Volume Share, By Product, 2022 & 2032F |
3.6 Indonesia Telecom Power Systems Market Revenues & Volume Share, By Grid Type, 2022 & 2032F |
3.7 Indonesia Telecom Power Systems Market Revenues & Volume Share, By Power Source, 2022 & 2032F |
4 Indonesia Telecom Power Systems Market Dynamics |
4.1 Impact Analysis |
4.2 Market Drivers |
4.2.1 Increasing demand for reliable and uninterrupted power supply in the telecom sector |
4.2.2 Growing investments in expanding telecom infrastructure in Indonesia |
4.2.3 Government initiatives to improve connectivity and digital infrastructure |
4.3 Market Restraints |
4.3.1 High initial investment costs for setting up telecom power systems |
4.3.2 Vulnerability to natural disasters and climate change impacts |
4.3.3 Regulatory challenges and compliance requirements |
5 Indonesia Telecom Power Systems Market Trends |
6 Indonesia Telecom Power Systems Market, By Types |
6.1 Indonesia Telecom Power Systems Market, By Product |
6.1.1 Overview and Analysis |
6.1.2 Indonesia Telecom Power Systems Market Revenues & Volume, By Product, 2022-2032F |
6.1.3 Indonesia Telecom Power Systems Market Revenues & Volume, By AC Power Systems, 2022-2032F |
6.1.4 Indonesia Telecom Power Systems Market Revenues & Volume, By DC Power Systems, 2022-2032F |
6.1.5 Indonesia Telecom Power Systems Market Revenues & Volume, By Digital Electricity, 2022-2032F |
6.2 Indonesia Telecom Power Systems Market, By Grid Type |
6.2.1 Overview and Analysis |
6.2.2 Indonesia Telecom Power Systems Market Revenues & Volume, By On-Grid, 2022-2032F |
6.2.3 Indonesia Telecom Power Systems Market Revenues & Volume, By Off-Grid, 2022-2032F |
6.2.4 Indonesia Telecom Power Systems Market Revenues & Volume, By Bad-Grid, 2022-2032F |
6.3 Indonesia Telecom Power Systems Market, By Power Source |
6.3.1 Overview and Analysis |
6.3.2 Indonesia Telecom Power Systems Market Revenues & Volume, By Diesel-Battery, 2022-2032F |
6.3.3 Indonesia Telecom Power Systems Market Revenues & Volume, By Diesel-Solar, 2022-2032F |
6.3.4 Indonesia Telecom Power Systems Market Revenues & Volume, By Diesel-Wind, 2022-2032F |
6.3.5 Indonesia Telecom Power Systems Market Revenues & Volume, By Other Sources, 2022-2032F |
7 Indonesia Telecom Power Systems Market Import-Export Trade Statistics |
7.1 Indonesia Telecom Power Systems Market Export to Major Countries |
7.2 Indonesia Telecom Power Systems Market Imports from Major Countries |
8 Indonesia Telecom Power Systems Market Key Performance Indicators |
8.1 Average uptime percentage of the power systems |
8.2 Energy efficiency ratio of the systems |
8.3 Percentage of power outages in the sector due to system failures |
8.4 Adoption rate of renewable energy sources in powering the systems |
8.5 Average response time for addressing power system failures |
9 Indonesia Telecom Power Systems Market - Opportunity Assessment |
9.1 Indonesia Telecom Power Systems Market Opportunity Assessment, By Product, 2022 & 2032F |
9.2 Indonesia Telecom Power Systems Market Opportunity Assessment, By Grid Type, 2022 & 2032F |
9.3 Indonesia Telecom Power Systems Market Opportunity Assessment, By Power Source, 2022 & 2032F |
10 Indonesia Telecom Power Systems Market - Competitive Landscape |
10.1 Indonesia Telecom Power Systems Market Revenue Share, By Companies, 2025 |
10.2 Indonesia Telecom Power Systems Market Competitive Benchmarking, By Operating and Technical Parameters |
11 Company Profiles |
12 Recommendations |
13 Disclaimer |
Global Go To Market Strategy - 2030
Export potential enables firms to identify high-growth global markets with greater confidence by combining advanced trade intelligence with a structured quantitative methodology. The framework analyzes emerging demand trends and country-level import patterns while integrating macroeconomic and trade datasets such as GDP and population forecasts, bilateral import–export flows, tariff structures, elasticity differentials between developed and developing economies, geographic distance, and import demand projections. Using weighted trade values from 2020–2024 as the base period to project country-to-country export potential for 2030, these inputs are operationalized through calculated drivers such as gravity model parameters, tariff impact factors, and projected GDP per-capita growth. Through an analysis of hidden potentials, demand hotspots, and market conditions that are most favorable to success, this method enables firms to focus on target countries, maximize returns, and global expansion with data, backed by accuracy.
By factoring in the projected importer demand gap that is currently unmet and could be potential opportunity, it identifies the potential for the Exporter (Country) among 190 countries, against the general trade analysis, which identifies the biggest importer or exporter.
To discover high-growth global markets and optimize your business strategy:
Click Here
Pricing
- Single User License$ 1,995
- Department License$ 2,400
- Site License$ 3,120
- Global License$ 3,795

Leadership Perspectives from Industry Events
Search
Thought Leadership and Analyst Meet


Our Clients
6WResearch In News
- India Air Conditioner Market Set for Strong Rebound in 2026 After Weather-Led Correction and GST-Driven Recovery: 6Wresearch
- ADAS in India: How Automatic Emergency Braking, Blind Spot Detection & Driver Monitoring are Transforming Road Safety
- Doha a strategic location for EV manufacturing hub: IPA Qatar
- Demand for luxury TVs surging in the GCC, says Samsung
- Empowering Growth: The Thriving Journey of Bangladesh’s Cable Industry
- Demand for luxury TVs surging in the GCC, says Samsung
Latest Reports
- Nicaragua RPG Gaming Market (2026-2032)
- New Zealand RPG Gaming Market (2026-2032)
- Netherlands RPG Gaming Market (2026-2032)
- Nauru RPG Gaming Market (2026-2032)
- Namibia RPG Gaming Market (2026-2032)
- Mozambique RPG Gaming Market (2026-2032)
- Montenegro RPG Gaming Market (2026-2032)
- Mongolia RPG Gaming Market (2026-2032)
- Monaco RPG Gaming Market (2026-2032)
- Micronesia RPG Gaming Market (2026-2032)
Industry Events and Analyst Meet

EV India Expo 2026

HIMTEX 2026

India Refining Summit 2026

India EV Show 2026

EV tech India Expo 2026
Whitepaper
- Middle East & Africa Commercial Security Market Click here to view more.
- Middle East & Africa Fire Safety Systems & Equipment Market Click here to view more.
- GCC Drone Market Click here to view more.
- Middle East Lighting Fixture Market Click here to view more.
- GCC Physical & Perimeter Security Market Click here to view more.