Indonesia Tongue Market (2026-2032) Outlook | Value, Growth, Forecast, Industry, Companies, Trends, Revenue, Analysis, Share & Size
Market Forecast By Diagnosis (Physical Examinations, Biopsy, Tests, Vitamin B Testing, Hla B Antigen Testing, Others), By Treatment (Topical Corticosteroids, Zinc Supplements, Topical Anaesthetic, Others), By End Users (Hospitals & Clinics, Research Organization, Diagnostic Labs, Others) And Competitive Landscape
| Product Code: ETC407544 | Publication Date: Oct 2022 | Updated Date: Mar 2026 | Product Type: Market Research Report | |
| Publisher: 6Wresearch | Author: Ravi Bhandari | No. of Pages: 75 | No. of Figures: 35 | No. of Tables: 20 |
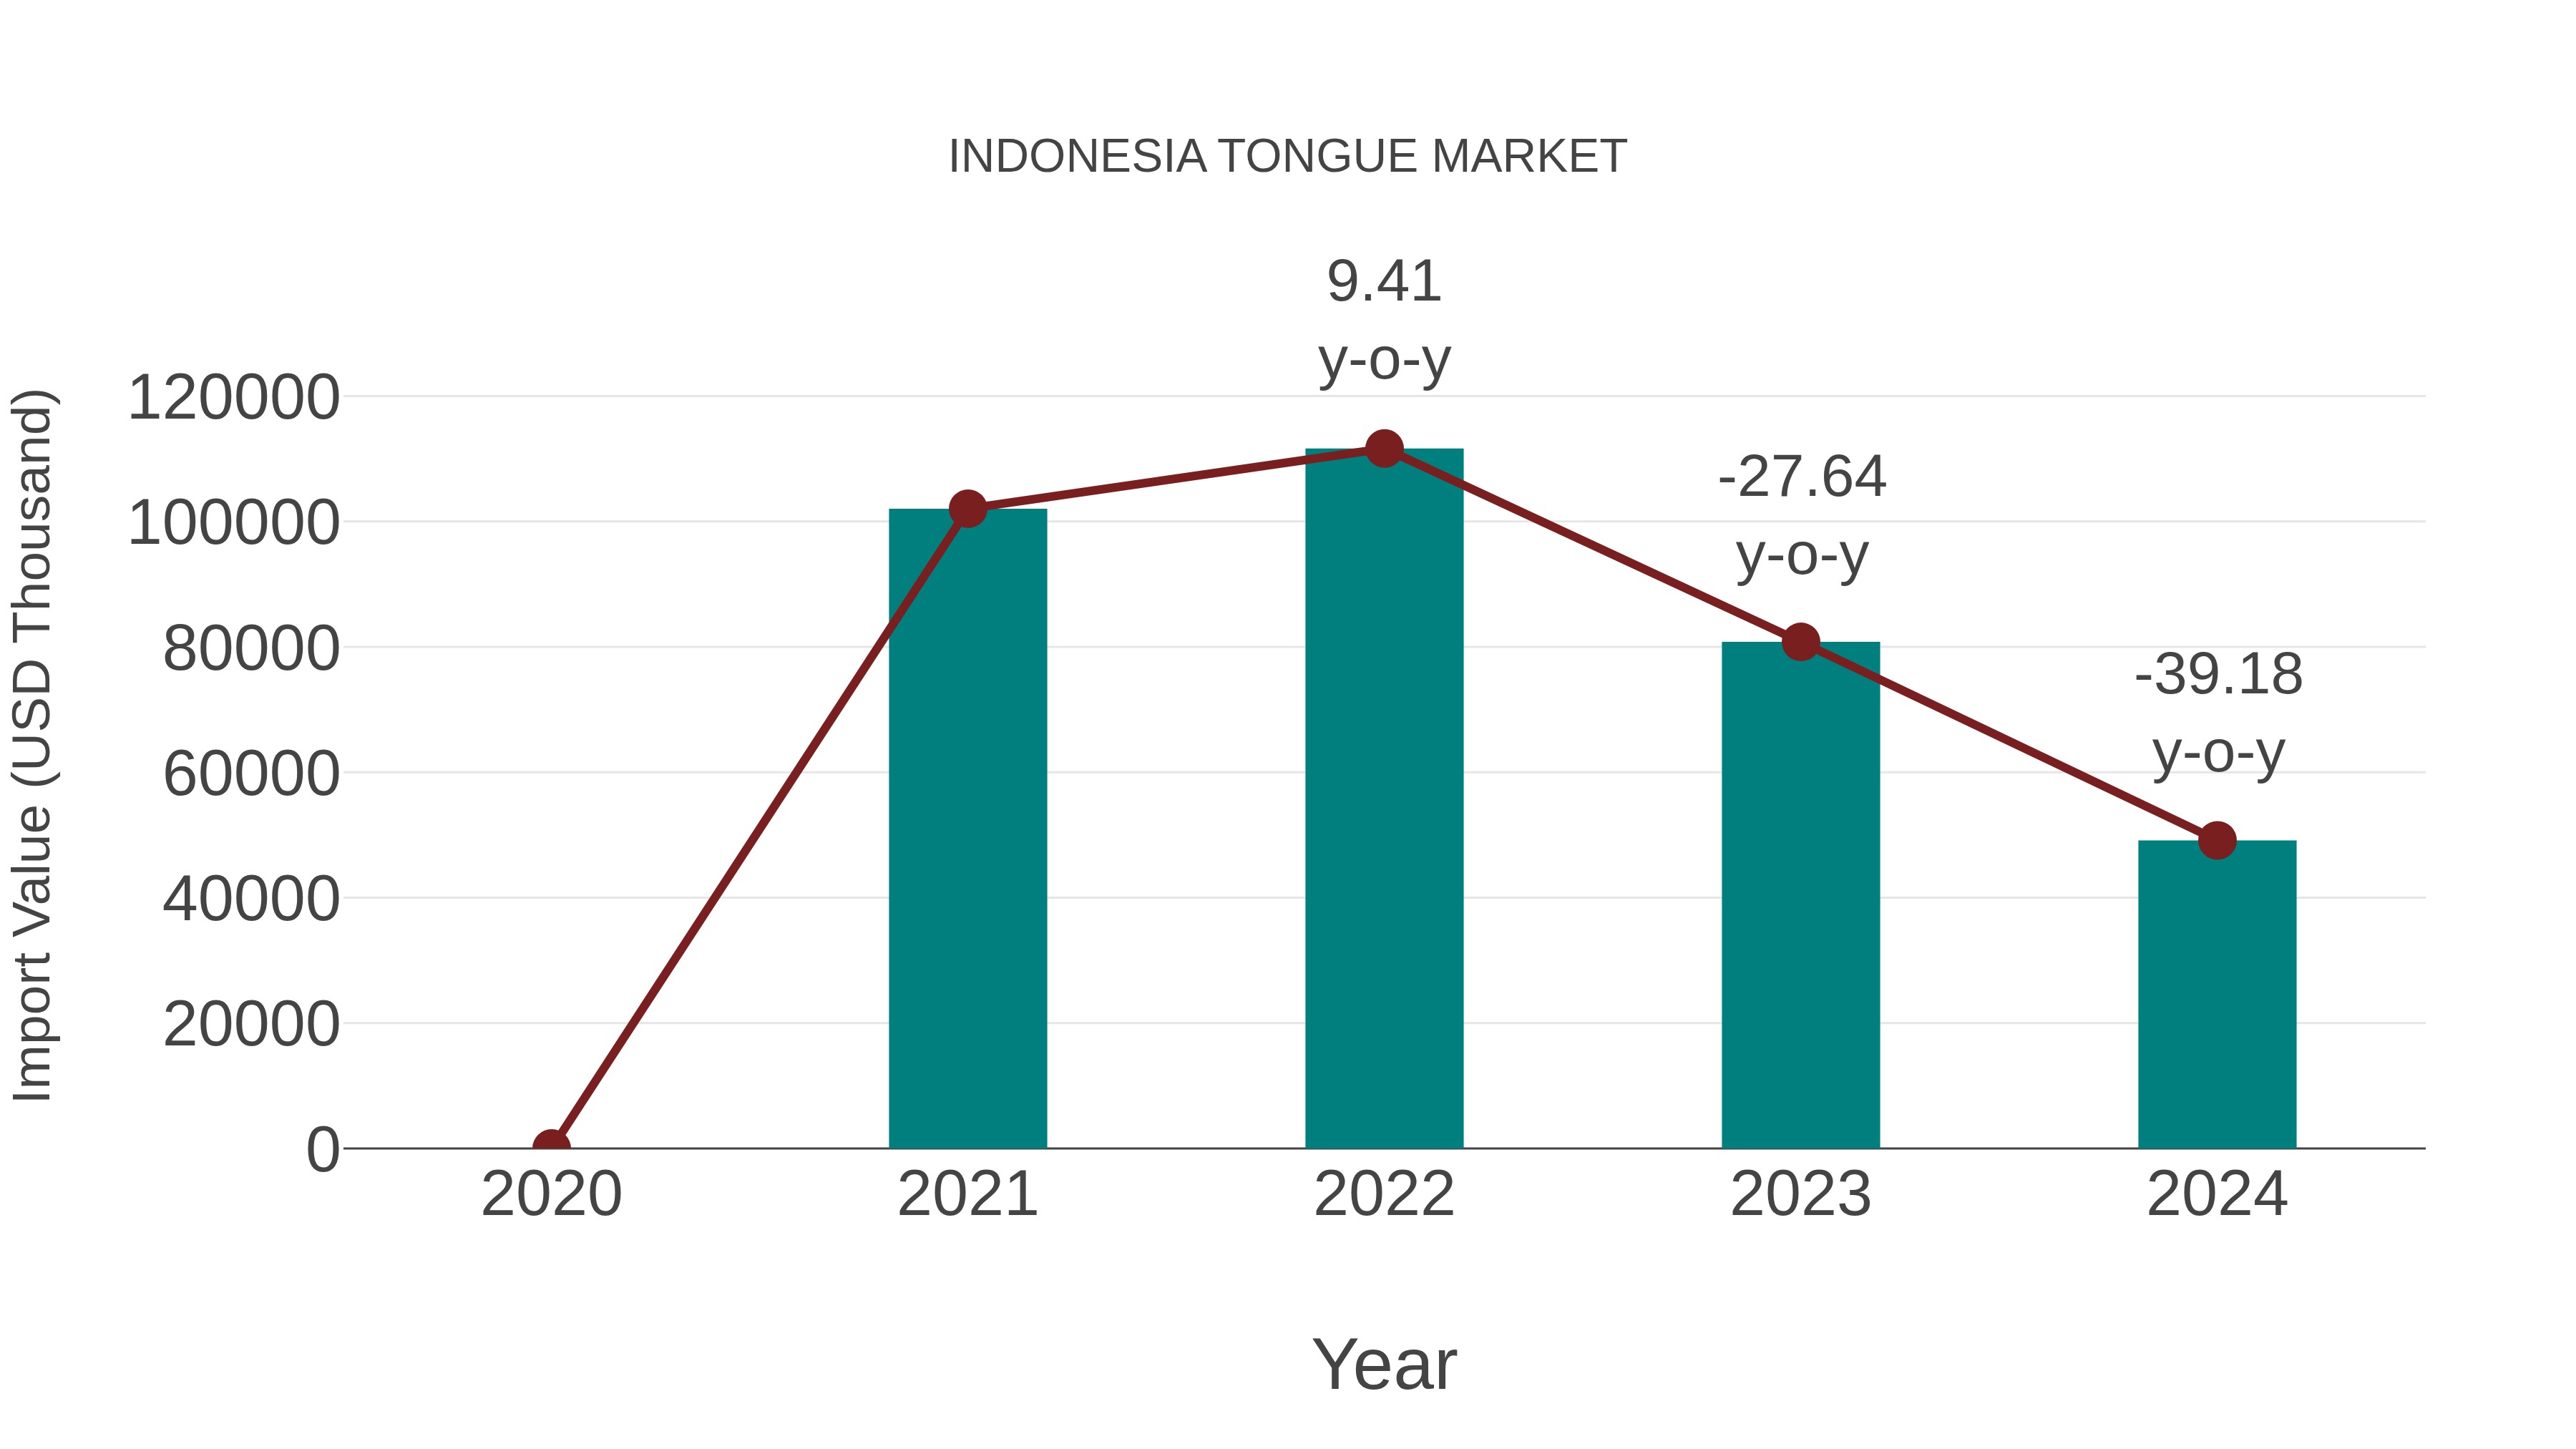
Indonesia Tongue Market: Import Trend Analysis
In the Indonesia tongue market, the import trend experienced a significant decline from 2023 to 2024, with a growth rate of -39.18%. The compound annual growth rate (CAGR) for the period 2020-2024 stood at -21.62%. This negative import momentum could be attributed to shifting demand patterns or changes in trade policies affecting market stability.
Indonesia Tongue Market Synopsis
The Indonesia Tongue market is a specialized segment within the culinary industry, primarily catering to traditional and regional cuisines. While not as mainstream as other meat products, tongue dishes have a niche following among food connoisseurs. The market`s outlook depends on factors such as cultural preferences, culinary trends, and the availability of tongue meat.
Drivers of the Market
The tongue market in Indonesia is influenced by cultural and culinary factors. Beef and lamb tongues are considered delicacies in Indonesia cuisine, and they are used in various traditional dishes. The market for tongues is driven by the popularity of these dishes in both local restaurants and home cooking. Additionally, tongues are a source of income for livestock farmers, contributing to the local economy. The market outlook depends on consumer preferences and the continuation of traditional culinary practices.
Challenges of the Market
The tongue market in Indonesia encounters challenges primarily related to cultural preferences. While tongue meat is a delicacy in some regions, others may find it unappealing. Therefore, market penetration and consumer acceptance can be region-specific. Furthermore, ensuring consistent supply and quality of tongue meat can be challenging due to the relatively small market demand.
COVID-19 Impact on the Market
The market for tongue in Indonesia has seen a steady demand due to its popularity in local cuisines. However, the COVID-19 pandemic initially disrupted the supply chain and led to fluctuations in prices. As the situation stabilizes, the market is expected to recover, driven by the resumption of restaurant and foodservice operations.
Key Players in the Market
Indonesia`s tongue market is relatively niche, with a few players like PT Surya Mitra Niaga specializing in the distribution of premium beef and lamb tongues to restaurants and culinary establishments. Their focus on quality and sourcing from reputable suppliers has made them trusted providers in this specific market.
Key Highlights of the Report:
- Indonesia Tongue Market Outlook
- Market Size of Indonesia Tongue Market, 2025
- Forecast of Indonesia Tongue Market, 2032
- Historical Data and Forecast of Indonesia Tongue Revenues & Volume for the Period 2022-2032F
- Indonesia Tongue Market Trend Evolution
- Indonesia Tongue Market Drivers and Challenges
- Indonesia Tongue Price Trends
- Indonesia Tongue Porter's Five Forces
- Indonesia Tongue Industry Life Cycle
- Historical Data and Forecast of Indonesia Tongue Market Revenues & Volume By Diagnosis for the Period 2022-2032F
- Historical Data and Forecast of Indonesia Tongue Market Revenues & Volume By Physical Examinations for the Period 2022-2032F
- Historical Data and Forecast of Indonesia Tongue Market Revenues & Volume By Biopsy for the Period 2022-2032F
- Historical Data and Forecast of Indonesia Tongue Market Revenues & Volume By Tests for the Period 2022-2032F
- Historical Data and Forecast of Indonesia Tongue Market Revenues & Volume By Vitamin B Testing for the Period 2022-2032F
- Historical Data and Forecast of Indonesia Tongue Market Revenues & Volume By Hla B Antigen Testing for the Period 2022-2032F
- Historical Data and Forecast of Indonesia Tongue Market Revenues & Volume By Others for the Period 2022-2032F
- Historical Data and Forecast of Indonesia Tongue Market Revenues & Volume By Treatment for the Period 2022-2032F
- Historical Data and Forecast of Indonesia Tongue Market Revenues & Volume By Topical Corticosteroids for the Period 2022-2032F
- Historical Data and Forecast of Indonesia Tongue Market Revenues & Volume By Zinc Supplements for the Period 2022-2032F
- Historical Data and Forecast of Indonesia Tongue Market Revenues & Volume By Topical Anaesthetic for the Period 2022-2032F
- Historical Data and Forecast of Indonesia Tongue Market Revenues & Volume By Others for the Period 2022-2032F
- Historical Data and Forecast of Indonesia Tongue Market Revenues & Volume By End Users for the Period 2022-2032F
- Historical Data and Forecast of Indonesia Tongue Market Revenues & Volume By Hospitals & Clinics for the Period 2022-2032F
- Historical Data and Forecast of Indonesia Tongue Market Revenues & Volume By Research Organization for the Period 2022-2032F
- Historical Data and Forecast of Indonesia Tongue Market Revenues & Volume By Diagnostic Labs for the Period 2022-2032F
- Historical Data and Forecast of Indonesia Tongue Market Revenues & Volume By Others for the Period 2022-2032F
- Indonesia Tongue Import Export Trade Statistics
- Market Opportunity Assessment By Diagnosis
- Market Opportunity Assessment By Treatment
- Market Opportunity Assessment By End Users
- Indonesia Tongue Top Companies Market Share
- Indonesia Tongue Competitive Benchmarking By Technical and Operational Parameters
- Indonesia Tongue Company Profiles
- Indonesia Tongue Key Strategic Recommendations
Indonesia Tongue Market (2026-2032): FAQs
6Wresearch actively monitors the Indonesia Tongue Market and publishes its comprehensive annual report, highlighting emerging trends, growth drivers, revenue analysis, and forecast outlook. Our insights help businesses to make data-backed strategic decisions with ongoing market dynamics. Our analysts track relevent industries related to the Indonesia Tongue Market, allowing our clients with actionable intelligence and reliable forecasts tailored to emerging regional needs.
Yes, we provide customisation as per your requirements. To learn more, feel free to contact us on sales@6wresearch.com
1 Executive Summary |
2 Introduction |
2.1 Key Highlights of the Report |
2.2 Report Description |
2.3 Market Scope & Segmentation |
2.4 Research Methodology |
2.5 Assumptions |
3 Indonesia Tongue Market Overview |
3.1 Indonesia Country Macro Economic Indicators |
3.2 Indonesia Tongue Market Revenues & Volume, 2022 & 2032F |
3.3 Indonesia Tongue Market - Industry Life Cycle |
3.4 Indonesia Tongue Market - Porter's Five Forces |
3.5 Indonesia Tongue Market Revenues & Volume Share, By Diagnosis, 2022 & 2032F |
3.6 Indonesia Tongue Market Revenues & Volume Share, By Treatment, 2022 & 2032F |
3.7 Indonesia Tongue Market Revenues & Volume Share, By End Users, 2022 & 2032F |
4 Indonesia Tongue Market Dynamics |
4.1 Impact Analysis |
4.2 Market Drivers |
4.2.1 Increasing consumer awareness about the importance of oral health and hygiene |
4.2.2 Growing demand for oral care products and services in Indonesia |
4.2.3 Rising disposable income leading to higher spending on oral care products |
4.3 Market Restraints |
4.3.1 Price sensitivity among consumers in Indonesia |
4.3.2 Lack of access to proper oral health education and services in remote areas |
4.3.3 Competition from other oral care products and substitutes |
5 Indonesia Tongue Market Trends |
6 Indonesia Tongue Market, By Types |
6.1 Indonesia Tongue Market, By Diagnosis |
6.1.1 Overview and Analysis |
6.1.2 Indonesia Tongue Market Revenues & Volume, By Diagnosis, 2022-2032F |
6.1.3 Indonesia Tongue Market Revenues & Volume, By Physical Examinations, 2022-2032F |
6.1.4 Indonesia Tongue Market Revenues & Volume, By Biopsy, 2022-2032F |
6.1.5 Indonesia Tongue Market Revenues & Volume, By Tests, 2022-2032F |
6.1.6 Indonesia Tongue Market Revenues & Volume, By Vitamin B Testing, 2022-2032F |
6.1.7 Indonesia Tongue Market Revenues & Volume, By Hla B Antigen Testing, 2022-2032F |
6.1.8 Indonesia Tongue Market Revenues & Volume, By Others, 2022-2032F |
6.2 Indonesia Tongue Market, By Treatment |
6.2.1 Overview and Analysis |
6.2.2 Indonesia Tongue Market Revenues & Volume, By Topical Corticosteroids, 2022-2032F |
6.2.3 Indonesia Tongue Market Revenues & Volume, By Zinc Supplements, 2022-2032F |
6.2.4 Indonesia Tongue Market Revenues & Volume, By Topical Anaesthetic, 2022-2032F |
6.2.5 Indonesia Tongue Market Revenues & Volume, By Others, 2022-2032F |
6.3 Indonesia Tongue Market, By End Users |
6.3.1 Overview and Analysis |
6.3.2 Indonesia Tongue Market Revenues & Volume, By Hospitals & Clinics, 2022-2032F |
6.3.3 Indonesia Tongue Market Revenues & Volume, By Research Organization, 2022-2032F |
6.3.4 Indonesia Tongue Market Revenues & Volume, By Diagnostic Labs, 2022-2032F |
6.3.5 Indonesia Tongue Market Revenues & Volume, By Others, 2022-2032F |
7 Indonesia Tongue Market Import-Export Trade Statistics |
7.1 Indonesia Tongue Market Export to Major Countries |
7.2 Indonesia Tongue Market Imports from Major Countries |
8 Indonesia Tongue Market Key Performance Indicators |
8.1 Number of oral health campaigns conducted in Indonesia |
8.2 Percentage of population using oral care products regularly |
8.3 Average spending per capita on oral care products in Indonesia |
9 Indonesia Tongue Market - Opportunity Assessment |
9.1 Indonesia Tongue Market Opportunity Assessment, By Diagnosis, 2022 & 2032F |
9.2 Indonesia Tongue Market Opportunity Assessment, By Treatment, 2022 & 2032F |
9.3 Indonesia Tongue Market Opportunity Assessment, By End Users, 2022 & 2032F |
10 Indonesia Tongue Market - Competitive Landscape |
10.1 Indonesia Tongue Market Revenue Share, By Companies, 2025 |
10.2 Indonesia Tongue Market Competitive Benchmarking, By Operating and Technical Parameters |
11 Company Profiles |
12 Recommendations |
13 Disclaimer |
Global Go To Market Strategy - 2030
Export potential enables firms to identify high-growth global markets with greater confidence by combining advanced trade intelligence with a structured quantitative methodology. The framework analyzes emerging demand trends and country-level import patterns while integrating macroeconomic and trade datasets such as GDP and population forecasts, bilateral import–export flows, tariff structures, elasticity differentials between developed and developing economies, geographic distance, and import demand projections. Using weighted trade values from 2020–2024 as the base period to project country-to-country export potential for 2030, these inputs are operationalized through calculated drivers such as gravity model parameters, tariff impact factors, and projected GDP per-capita growth. Through an analysis of hidden potentials, demand hotspots, and market conditions that are most favorable to success, this method enables firms to focus on target countries, maximize returns, and global expansion with data, backed by accuracy.
By factoring in the projected importer demand gap that is currently unmet and could be potential opportunity, it identifies the potential for the Exporter (Country) among 190 countries, against the general trade analysis, which identifies the biggest importer or exporter.
To discover high-growth global markets and optimize your business strategy:
Click Here
Pricing
- Single User License$ 1,995
- Department License$ 2,400
- Site License$ 3,120
- Global License$ 3,795

Leadership Perspectives from Industry Events
Search
Thought Leadership and Analyst Meet


Our Clients
6WResearch In News
- India Air Conditioner Market Set for Strong Rebound in 2026 After Weather-Led Correction and GST-Driven Recovery: 6Wresearch
- ADAS in India: How Automatic Emergency Braking, Blind Spot Detection & Driver Monitoring are Transforming Road Safety
- Doha a strategic location for EV manufacturing hub: IPA Qatar
- Demand for luxury TVs surging in the GCC, says Samsung
- Empowering Growth: The Thriving Journey of Bangladesh’s Cable Industry
- Demand for luxury TVs surging in the GCC, says Samsung
Latest Reports
- Nicaragua RPG Gaming Market (2026-2032)
- New Zealand RPG Gaming Market (2026-2032)
- Netherlands RPG Gaming Market (2026-2032)
- Nauru RPG Gaming Market (2026-2032)
- Namibia RPG Gaming Market (2026-2032)
- Mozambique RPG Gaming Market (2026-2032)
- Montenegro RPG Gaming Market (2026-2032)
- Mongolia RPG Gaming Market (2026-2032)
- Monaco RPG Gaming Market (2026-2032)
- Micronesia RPG Gaming Market (2026-2032)
Industry Events and Analyst Meet

HIMTEX 2026

India Refining Summit 2026

India EV Show 2026

EV tech India Expo 2026

Auto Tech Asia 2026
Whitepaper
- Middle East & Africa Commercial Security Market Click here to view more.
- Middle East & Africa Fire Safety Systems & Equipment Market Click here to view more.
- GCC Drone Market Click here to view more.
- Middle East Lighting Fixture Market Click here to view more.
- GCC Physical & Perimeter Security Market Click here to view more.